Databases and ontologies
GeneTIER: prioritization of candidate disease
genes using tissue-specific gene expression
profiles
Agne Antanaviciute
1,*, Catherine Daly
1, Laura A. Crinnion
2,
Alexander F. Markham
1, Christopher M. Watson
2, David T. Bonthron
1and Ian M. Carr
11
Section of Genetics, Institute of Biomedical and Clinical Sciences, School of Medicine, University of Leeds, St
James’s University Hospital and
2Yorkshire Regional Genetics Service, St James’s University Hospital, Leeds, UK
*To whom correspondence should be addressed. Associate Editor: John Hancock
Received on August 18, 2014; revised on March 13, 2015; accepted on April 1, 2015
Abstract
Motivation:
In attempts to determine the genetic causes of human disease, researchers are often
faced with a large number of candidate genes. Linkage studies can point to a genomic region
con-taining hundreds of genes, while the high-throughput sequencing approach will often identify a
great number of non-synonymous genetic variants. Since systematic experimental verification of
each such candidate gene is not feasible, a method is needed to decide which genes are worth
investigating further. Computational gene prioritization presents itself as a solution to this problem,
systematically analyzing and sorting each gene from the most to least likely to be the
disease-causing gene, in a fraction of the time it would take a researcher to perform such queries manually.
Results:
Here, we present Gene TIssue Expression Ranker (GeneTIER), a new web-based
applica-tion for candidate gene prioritizaapplica-tion. GeneTIER replaces knowledge-based inference tradiapplica-tionally
used in candidate disease gene prioritization applications with experimental data from
tissue-specific gene expression datasets and thus largely overcomes the bias toward the better
character-ized genes/diseases that commonly afflict other methods. We show that our approach is capable of
accurate candidate gene prioritization and illustrate its strengths and weaknesses using case study
examples.
Availability and Implementation:
Freely available on the web at http://dna.leeds.ac.uk/GeneTIER/.
Contact:
umaan@leeds.ac.uk
Supplementary information:
Supplementary data
are available at
Bioinformatics
online.
1 Introduction
Current high-throughput sequencing methods used for disease gene discovery can generate very large volumes of data. While the extrac-tion of non-synonymous, potentially deleterious variants can be eas-ily automated, this often results in the identification of thousands of candidate disease genes. Since the experimental verification of an in-dividual gene can be both difficult and time consuming, some method to prioritize the order in which such verification is sought is
often employed. A common approach is to examine biological data-bases and literature for information pertaining to each candidate disease gene, in order to select the most promising genes. This can be both slow and error-prone, as the data are spread across multiple resources with no common structure. Nor can this type of analysis be quantified, since the selection is based solely on the subjective im-pressions of the researcher.
VCThe Author 2015. Published by Oxford University Press. 1
This is an Open Access article distributed under the terms of the Creative Commons Attribution License (http://creativecommons.org/licenses/by/4.0/), which permits unrestricted reuse, distribution, and reproduction in any medium, provided the original work is properly cited.
Bioinformatics, 2015, 1–8 doi: 10.1093/bioinformatics/btv196 Advance Access Publication Date: 9 April 2015 Original Paper
at University of Leeds on July 24, 2015
http://bioinformatics.oxfordjournals.org/
In light of these challenges, various computational gene priori-tization methods have been proposed. These vary substantially in terms of both intended usage and underlying algorithms (reviewed inTrancheventet al.,2011). Generalized methods rely extensively on data mining of sequence information, gene expression datasets, functional annotations and/or protein–protein interactions. These data are most frequently employed in a ‘guilt-by-association’ frame-work, in which candidate disease genes are ranked based on the strength of relationships and/or similarities to genes already known to be linked with the disease. One of the major drawbacks of such approaches is the bias introduced toward better characterized genes and/or diseases. Thus, in particular where little prior knowledge about the disease and/or gene is available, accurate prioritization of putative disease genes remains a challenge.
The availability and wide coverage of experimental conditions of gene expression datasets might alleviate issues arising from incom-plete data, as current technologies allow for the quantification of an entire transcriptome. Indeed, gene expression data are a crucial constituent of several web-based gene prioritization applications; however, it tends to be used in concert with other data types, such as pathway/interaction networks or functional annotations. Established web tools such as ToppGene (Chen et al., 2009), Endeavour (Trancheventet al., 2008) and CANDID (Hutzet al., 2008) employ a modular approach to prioritization, scoring candi-dates based on a consensus from multiple data sources. Even though it has been demonstrated that consensus methods are more accurate than approaches utilizing fewer data categories (Bornigenet al., 2012), the former have been criticized for both the ‘guilt-by-associ-ation’ bias and failure to exploit the best performing methods for each component (Chenet al., 2011).
More specialized algorithms often integrate gene expression data into a heterogeneous (Chenet al., 2011, Maet al., 2007, Nitsch
et al., 2011) or homogenous (van Damet al., 2012) network, where distance between genes can be derived from and/or weighted by dif-ferential expression or co-expression values. Alternatively, some methods (Chen et al., 2009, Masottiet al., 2008, Seelowet al., 2008) consider gene co-expression in a non-network context, utiliz-ing common statistical vector correlation measures to rank candi-date disease genes based on how well their expression patterns correlate with those of genes known to be directly or indirectly linked to the disease.
Fewer applications attempt to apply tissue-specific expression patterns for gene prioritization tasks. Endeavour (Tranchevent
et al., 2008) incorporates gene expression data from 79 normal human tissues found in Gene Expression Atlas, comparing gene ex-pression between candidate and user-supplied seed genes across tis-sues. A recent update to PhenoDigm (Oellrich and Smedley, 2014 Smedleyet al., 2013) has incorporated tissue-specific, binary mouse gene expression data from 21 mouse tissues and derived phenotype-tissue associations in order to supplement its phenotype-based queries.
Nonetheless, none of these approaches distance themselves en-tirely from the ‘guilt-by-association’ approach. Here, we investigate the use of publicly available gene expression data as the sole means of prioritizing candidate disease genes. The resulting web applica-tion GeneTIER scores candidate disease genes based on the hypoth-esis that genes responsible for a tissue(s)-specific phenotype are expected to be more highly expressed in affected than unaffected tis-sues. GeneTIER depends on an extensive database that has been built using publicly available microarray and RNA sequencing data-sets and is composed of several million expression values for numer-ous normal tissues. This enables the creation of a global, cross-tissue
expression profile for each candidate disease gene, permitting expression profile-based prioritization without reliance on or re-quirement for other prior knowledge about the disease or candidate genes. GeneTIER should thus be suitable for prioritization of candi-dates for poorly characterized diseases.
2 Methods
2.1 Database
The Gene expression database contains 9 972 862 baseline gene ex-pression values from microarray and RNA-Seq experiments, encom-passing 140 different control, non-diseased mouse and human tissue types. The database was assembled from public domain sources, including datasets from Gene Expression Atlas (Petryszak et al., 2014), RNA-Seq Expression Atlas (Krupp et al., 2012), ArrayExpress (Rocca-Serra et al., 2003) and Gene Expression Omnibus (Barrettet al., 2009).
Microarray probe set to Ensembl gene transcript identifier map-pings were downloaded from the Biomart resource (Kasprzyk, 2011). As per recommended practice, ambiguous data arising from microarray probes which hybridize to more than one distinct gene were discarded (Ramasamyet al., 2008). Similarly, HGNC, Ensembl and Entrez and RefSeq gene identifiers were obtained from Biomart. UCSC gene names and exon boundary coordinates were down-loaded using the UCSC Genome Browser’s ‘Table’ page (Karolchik
et al., 2004) using the hg19 human genome assembly. Mouse–human gene orthologs were downloaded from MGI (Bult
et al., 2008) and mapped using HomoloGene (Fliceket al., 2014).
2.2 The gene prioritization algorithm
Candidate genes are ranked based on several factors derived from gene expression data. These comprise the levels of expression in the affected tissues; variance in expression across all tissues; and expres-sion level differences between affected and unaffected tissues. The base score,ðSgÞ, for each candidate disease gene is calculated using Equation (1):
Sg¼ X
tT
zt if zt¼0
zt 1þlnzt z 8 > < > : (1)
wheretis an affected tissue in a set of all affected tissuesT;ztis the
mean of modifiedz-scores (see below) for tissuet; andzis the me-dian modifiedz-score across all tissues. If gene expression in an af-fected tissue is greater than its baseline expression the natural logarithm ratio is positive; otherwise the value is negative. The value ofðSgÞis a fractional modifier, favoring genes which show elevated gene expression in disease-associated tissues, compared with tissues not linked to the disease phenotype, even if the expression value is relatively low. The score can be further adjusted for highly expressed genes which takes into account the level of variance in expression across all tissues in order to reduce the contention of highly ubiqui-tously expressed housekeeping genes. When included in the analysis, the results from human RNA sequencing, human microarray, mouse RNA sequencing and mouse microarray data are each considered separately, and combined to generate the final ranking score. In cases where incomplete data may arise—for example, genes which are not probed on the microarray or are ambiguous, the instance may still be scored using only one evidence type.When the final ranking score is derived from human and mouse data, the relative contribution of mouse tissue datasets relative to the human datasets can be adjusted by the user.
at University of Leeds on July 24, 2015
http://bioinformatics.oxfordjournals.org/
Modifiedz-scores for all RNA sequencing and microarray data-sets were calculated as shown in Equation (2):
ze2E¼0:6745 ðeE Þ
medianðjeEjÞ
; (2)
whereEdenotes a set of normalized expression values in an experi-ment, with individual elementse;Eis thus the mean value ofEand the denominator is the median absolute deviation, whereeis an in-dividual element ofEandEis the median of all elements inE.
The modified z-scores enable the transformation of non-normally distributed gene expression data and measure how each data point differs from the typical observations within the dataset. This transformation serves both to aid the prioritization and to fa-cilitate better comparability between microarray datasets, as it has been suggested that rank-based transformations of microarray data alleviate some of the issues associated with comparing cross-plat-form, cross-laboratory data (Irizarryet al., 2005).
2.3 Benchmarking dataset
The performance of the application was evaluated using a set of 1000 gene-disease associations, which was generated using the ‘The Human Phenotype Ontology’ (HPO) (Kohleret al., 2014) dataset as a source for disease genes and associated phenotypes. The HPO is a curated ontology, organizing human disease phenotypes described in the Online Inheritance In Man (OMIM) database (URL: http:// omim.org/), as well as Orphanet (URL: http://www.orpha.net) and medical literature in a structured, controlled vocabulary. This enabled the generation of a large dataset while bypassing any inac-curacies that can arise from the lack of precision when text-mining unstructured entries in OMIM (which sometimes describe legacy or historical information).
A sub-group of all HPO phenotypes was selected based on the following criteria: high term specificity (defined as the distance of a term from the root of the ontology); terms which could be unam-biguously mapped to tissues through axiomatic links to an anatom-ical ontology (Golbreich et al., 2006, Kohler et al., 2013, (Hoehndorfet al., 2010) or manual assignment. A total of 2922 dis-tinct disease genes were found to be annotated as associated with HPO diseases and were subsequently matched with selected pheno-types. Phenotypes, where a frequency modifier for a disease is denoted as ‘very rare’ or in the cases where the frequency modifier is given as a percentage,<2% of all cases reported, were not con-sidered. Finally, from the resulting data, 1000 disease-genes associ-ations were selected at random for testing (Supplementary Data 1).
In order to ascertain how tissue selection affects prioritization with GeneTiER, diseases with a distinct, localized phenotype were categorized using Disease Ontology, using definitions which are des-cendants of the term ‘disease of anatomical entity’ (DOID:7). 500 disease–gene associations were selected for testing (Supplementary Data 2).
2.4 Implementation
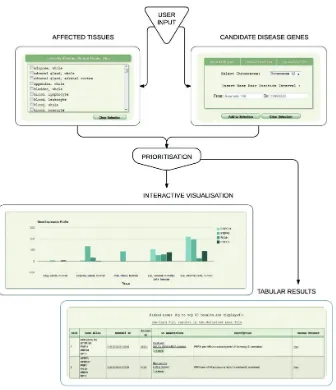
The implementation is accessible through a web-based interface (Fig. 1), which was constructed to HTML5 specification, utilizing JavaScript throughout; JavaScript browser support is thus required. Currently, the user may supply candidate disease genes in the follow-ing formats: a sfollow-ingle or multiple genomic region(s), specified by chromosome and interval boundaries; a pre-filtered VCF file contain-ing potentially deleterious variants (enforced by file size limit); a can-didate gene list in a delimited format, accepting several commonly
used delimiter types. The gene list can be composed of Ensembl (Fliceket al.,2014), Entrez (Maglottet al., 2011) or Refseq (Pruitt
et al., 2014) accession numbers, HGNC-approved gene names (Grayet al., 2013); common aliases or any combination of thereof may be used as input. GeneTIER performs automatic conversions be-tween human genes and their mouse orthologs, as well as optionally resolving ambiguous input gene aliases and identifiers based on mul-tiple criteria. Up to 100 top results can be viewed directly in the browser and the entire analysis can be downloaded as a text file. GeneTIER is freely available at http://dna.leeds.ac.uk/GeneTIER/.
3 Results
The algorithm used by GeneTIER assumes that a disease gene’s expres-sion tends to be significantly higher in affected tissues compared with unaffected tissue. To test the generality of this assumption, we retrieved expression values from our database for all genes in our training set (see Section 2) and performed a two-sample Kolmogorov–Smirnov test for non-normally distributed data, using an alternative hypothesis that the cumulative frequency distribution function of modified scores from unaffected tissues lies below that of modified scores from disease-associated tissues. For RNA-sequencing data this resulted in statistic
D¼0.1517, with respectiveP-value<2.2e16and for microarray data
D¼0.1334,P-value<2.2e16.
The performance of GeneTIER was assessed on a dataset com-prised of 1000 known associations between disease genes and tissues expected to be affected by each gene’s dysfunction. For each disease gene, four sets of random genes were generated, comprising 50, 100, 200 and 500 genes. The disease genes were prioritized against the genes in the randomly generated gene sets and the results analyzed using ROC analysis. ROC curves provide a way to visualize and compare classifier performance. Here, the candidate gene prioritiza-tion algorithm can be viewed as a non-binary scoring classifier, where disease-linked genes are positive instances and other candi-dates are negatives. The values—or ranks—from the classifier out-put can be converted into binary positive and negative scores using cut-off thresholds. Thus, a confusion matrix can be calculated for every integer rank cut-off value from which comparison metrics, such as sensitivity and specificity values are derived. ROC graphs allow the visualization of sensitivity versus 1-specificity. The line running from the origin (0,0) to the maximum point of 1,1 (Y¼X), which corresponds to an area under the curve (AUC) of 0.5, repre-sents a performance that is no better than random predictions. Points on a ROC curve that occur above this line represent an algo-rithm with better than random classifier performance, while those below the line have worse than random results, i.e. a bias toward classifying positives as negatives. An algorithm with an AUC of 1 represents perfect classifier performance.
Figure 2shows the resultant ROC graphs whileTable 1shows the corresponding AUC scores. This analysis suggests that the algo-rithm’s performance was inversely related to the number of non-disease genes in the analysis, but does not decline in a linear manner. In fact, the differences in performance when assessed on candidate lists consisting of 100, 200 or 500 candidates are minor and do not suggest that the maximum candidate gene list size will be encoun-tered in typical gene mapping experiments. Overall, the obtained AUC values are sufficiently high to suggest that disease genes are typically ranked higher than the randomly selected genes in each data set by this algorithm.
In order to illustrate the circumstances where our methodology either failed or succeeded, we used a case study of the global
at University of Leeds on July 24, 2015
http://bioinformatics.oxfordjournals.org/
expression patterns for genes implicated in retinitis pigmentosa (OMIM:610282), a degenerative eye disease causing severe vision impairment.Figure 3shows the expression profiles across multiple normal tissues of five disease genes known to underlie retinitis pig-mentosa, whileTables 2and3show the summary of the mean ranks obtained using our method. The genes PRPF3 and PRPF31 show dis-tinct, tissue-specific expression in eye tissues with negligible expres-sion in non-ocular tissue; disease genes with similar expresexpres-sion profiles are ranked very highly by our methodology. While PRPF6 is also highly expressed in eye tissues, unlike PRPF3 and PRPF31 its expression is not limited to ocular tissues, resulting in a reduced, but still strongly suggestive ranking. ROM1 is expressed in a number of non-ocular tissues as well as in corneal epithelial cells but still ranked highly. This was in spite of its lower expression in corneal epithelial cells than that of the PRPF genes and comparable expres-sion in adipose tissue. Unsurprisingly, in view of its ubiquitously low expression levels, the methodology failed to identify PR1.
[image:4.612.141.477.54.444.2]In order to ascertain whether our method is more appropriate for certain disease types, we analyzed how well GeneTiER performs across a range of tissues.Supplementary Figure S1highlights that GeneTiER can accurately prioritize genes across most tissue catego-ries, recognizing endocrine and integumentary system-specific genes Fig. 1.Overview of GeneTIER implementation. The web-based interface allows the user to supply candidate disease genes to prioritize and to select affected tis-sues. Top prioritization results are returned in a tabular form and are available to visualize and compare using an interactive chart. Full results are available for download
Fig. 2.ROC curve showing classifier performance on different size input generated using disease genes from the benchmarking dataset (see Section 2)
at University of Leeds on July 24, 2015
http://bioinformatics.oxfordjournals.org/
[image:4.612.72.290.497.697.2]particularly well, with 73 and 76% of disease genes, respectively, ranked in the top 10. However, genes in the sensory category, com-prising mostly eye-related disorders, ranked poorly.
[image:5.612.99.262.91.167.2]The eye is a complex organ with many specialized tissue types. While the GeneTiER database contains expression data from cor-neal epithelial cells, stromal cells and murine lens, these do not en-compass all the diverse cell types present in the eye. Consequently, diseases of the eye that do not affect these tissues will not be cor-rectly prioritized by our approach. Conversely, diseases affecting vi-sion can be neurodegenerative in nature, in which case the causative
Table 1.AUC scores for classifier performance when assessed using 1000 known disease genes
Random gene sample size
Area under the ROC curve
50 0.83
100 0.80
200 0.81
500 0.78
Fig. 3.Expression profiles of PRPF3, PRPF31, PRPF6, ROM11 and RP1 genes, associated with retinitis pigmentosa (OMIM:610282) across a selection of tissues, RNA sequencing data
at University of Leeds on July 24, 2015
http://bioinformatics.oxfordjournals.org/
[image:5.612.97.519.208.715.2]gene may not have a function in the eye.Finally, we have considered which data type—RNA-Seq or microarray—enabled more accurate prioritization results. We considered all diseases where both RNA-Seq and microarray data were available for all the identified affected tissue types.Supplementary Figure S2 shows the ROC curves ob-tained when the dataset was prioritized together with 100 random genes. The difference in performance between RNA-Seq and micro-array data is minimal, with RNA-sequencing data giving better re-sults (ROC 0.80 versus 0.78), but slightly worse than the combined score approach (ROC 0.81).This is in concordance with a recent study byWanget al.(2014), who found that while more differen-tially expressed genes identified by RNA-sequencing than micro-array studies could be verified by qPCR, the gain was mostly from the improved quantification of low abundance transcripts.
Furthermore, while sequencing data do provide a small improve-ment over microarray data in prioritization, this is offset by a more limited public availability of sequencing datasets. There are cur-rently 41124 microarray datasets deposited in Array Express data-base in contrast to only 5745 RNA-sequencing experiments (accessed 01/03/2014).
4 Discussion
While a number of methods have been previously employed for the prioritization of candidate disease genes, none are universally ap-plicable. These methods tend to rely heavily on prior knowledge about the disease, phenotype and/or genes, making them unsuitable systems for classifying novel and/or poorly characterized genes. The best performing methods have been shown to rely on a variety of in-formation sources to compensate for inadequacies in knowledge in any single domain. However, there is value to be found in approaches which distance themselves entirely from the ‘guilt-by-association’ principle used by these methods, which have an inherent bias toward well characterized genes.
The wide range of open access gene expression data can serve to overcome the limitations of prior knowledge-based approaches by
substituting gene- or disease-specific information with tissue-specific experimental data. However, implementations of this approach often exhibit certain limitations. Some implementations prioritize candidate disease genes based on co-expression with genes already known to be associated with the disease in question. This requires the user to supply ‘seed’ genes, thus making the assumption that pre-existing knowledge about the disease is either available or relevant to the particular disease phenotype. This may not be the case; for ex-ample, OMIM currently contains several thousand disease entries for which no contributing genes are yet known.
Conversely, a number of network-based methods prioritize genes under the assumption that a disease gene will exist in a local net-work of genes which are highly differentially expressed between af-fected and unafaf-fected tissues. However, while this type of approach can be successful in disease-specific studies, it is difficult to general-ize for wider use, due to its reliance on differential expression data-sets between disease and control tissue samples. Some implementations overcome these difficulties by requesting the user to supply their own data. However, this can be seen as a contradic-tion to the major aim of computacontradic-tional candidate prioritizacontradic-tion which is to reduce the experimental burden on a researcher, rather than requiring the user to perform further studies. In this study, we present a novel application for candidate disease gene prioritization that aims to address the shortcomings discussed above. GeneTiER does not require the user to have any prior knowledge of the disease, other than the ability to unambiguously identify affected tissues. The application has been specifically designed to require only min-imal user input, and takes care of conversions between a variety of commonly used gene identifiers and between human/mouse orthologs.
We have taken advantage of both microarray expression and RNA sequencing data available in the public domain to create an ex-tensive tissue-specific expression database that can support a wide variety of gene prioritization queries. Organs are made up of many functionally diverse tissue cell types and this can be reflected in the experimental data. Therefore, we have striven to collate data from multiple, distinctive datasets, to enable the user to make tissue cell type-specific queries which are not supported by many of the popu-lar databases.
[image:6.612.64.553.71.164.2]Many popular gene prioritization methods that rely on prior knowledge about a disease use either text-mining approaches or Gene Ontology annotations to score candidates based on relevance to query. Currently, there are still over a thousand human genes with no available GO annotations and many more with ‘shallow’ annotations. While this presents a problem for disease gene infer-ence by similarity, the method described here would not be any less applicable. For example, at the time of writing, no Gene Ontology annotations have yet been ascribed to the human CDR1 gene, known to contribute to paraneoplastic cerebellar degeneration
Table 2.Mean ranks and standard deviations of five case-study genes shown inFig. 3
Gene PR1 ROM1 PRPF6 PRPF31 PRPF3
Input size Mean rank Standard deviation Mean rank Standard deviation Mean rank Standard deviation Mean rank Standard deviation Mean rank Standard deviation
50 34.7 11.03 8.16 11.7 8.8 4.2 2.9 1.78 5.4 3.01
100 66.03 8.9 17.07 6.38 22.7 5.53 4.13 2.21 7.1 2.54 200 172.07 5.75 53.87 6.47 28.33 3.20 20.3 3.91 28.0 4.08 500 288.11 13.33 67.4 10.03 140.65 15.07 39.24 4.45 41.65 6.51
Each gene was ranked 30 times against a set of 50, 100, 200 and 500 randomly generated genes
Table 3.Mean reciprocal ranks of five case-study genes assessed against a set with 50, 100, 200 and 500 randomly generated genes; 30 replicates
Mean reciprocal rank
Input size PR1 ROM1 PRPF6 PRPF31 PRPF3
50 0.78 0.09 0.09 0.08 0.08 100 0.66 0.17 0.23 0.04 0.07 200 0.86 0.27 0.14 0.10 0.14 500 0.58 0.13 0.28 0.08 0.08
at University of Leeds on July 24, 2015
http://bioinformatics.oxfordjournals.org/
[image:6.612.63.298.236.317.2](OMIM:302650). This gene shows localized expression in brain tis-sues, in particular in the cerebellum, and as such is scored highly by our method, whereas approaches reliant on prior knowledge are likely to fail. However, direct performance comparisons between gene prioritization tools are difficult—without cross-validation, any prioritization on known disease genes is meaningless, and to the best of our knowledge, no web gene prioritization application provides a performance assessment mode.
While we have shown that GeneTiER is capable of accurate dis-ease gene prioritization through ROC analysis (with AUC values of up to 0.83), it should be noted that the disease gene is rarely ranked first in the output. This ranking should therefore be used as a guide to the order in which candidate genes should be analyzed further. Even so, it must be noted that not all disease gene expression patterns con-form to the assumptions underlying our model. For example, some disease genes show universally high or low gene expression across all tissues (see RP1 inFig. 3). Indeed, aberrant activation of genes which are normally repressed can result in a disease phenotype, as is the case in many cancers. However, in order to detect these patterns, the differ-ential expression change must be observed between the normal and af-fected states. While including differential expression data from normal and affected patients would no doubt improve GeneTiER per-formance, public availability of such data is mostly limited to a small number of well-studied diseases and therefore would enhance the re-sults for only a small proportion of cases.
Furthermore, asOellrich and Smedley (2014)note in their ana-lysis, the site of gene expression and the visible phenotype do not al-ways coincide. Consequently, the limitations of this method must be understood and taken into consideration when examining the final gene rankings. This is especially true where the link between tissue and phenotype may not be immediately obvious. For example, con-genital dysfibrinogenemia (OMIM:616004) is a blood clotting dis-order caused by defective fibrinogen genesFGB, FGGandFGA.
Circulating factors affecting blood clotting are synthesized by hep-atocytes, and indeed, our data show that fibrinogen genes are highly and exclusively expressed in the liver (Supplementary Fig. S3a). However, GeneTiER would not identity these disease genes if the user failed to take this into account and selected blood, rather than liver, as the affected tissue.
Narcolepsy-cataplexy (ORPHANET:2073) is a sleep disorder with multiple causative genes identified. GeneTiER scores a number of these highly, for example MOG and ZNF365, due to localized expression in parts of the brain (Supplementary Fig. S3b). However, the disease can have an autoimmune component and in some pa-tients the phenotype has been attributed to the loss of neurons in the hypothalamus due to autoimmune attacks. Consequently, our meth-odology fails to identify histocompatibility genesHLA-DQB1and
HLA-DRB1as causative genes for the disease and may find other phenotypes arising from heterogeneous causes challenging (Supplementary Fig. 3c).
Similarly, GeneTiER will not be able to identify disease genes that are expressed exclusively in tissues not present in our dataset. Similarly, diseases caused by genes that are expressed in response to either an environmental stimulus or within a short development time frame will not perform well if the appropriately stimulated tis-sue is absent from our dataset.
In spite of these challenges, there are numerous cases where the observed phenotype correlates with the site of expression exceed-ingly well. For example, renal tubular dysgenesis (OMIM:267430) is characterized by a congenital abnormality of the kidneys, with low amniotic fluid during pregnancy. The protein associated with the disease,REN, is produced mostly by juxtaglomerular cells of the
kidney. The data in GeneTiER database agree with this, showing elevated expression in the kidney, as well as a secondary major site of expression in the placenta (Supplementary Fig. S3d).
Our testing indicates that our gene prioritization method is cap-able of meaningful candidate gene prioritization and performs strongly in a substantial proportion of cases tested. GeneTiER aims to highlight genes with tissue-specific expression patterns to the user from among other candidate genes in their dataset, and as such will perform best for diseases with distinct, localized phenotypes. Nevertheless, a broad selection of tissues allows for scoring of com-plex phenotypes affecting any combination of tissues. We believe GeneTiER offers great utility value to the research community and can effectively supplement thein silicotoolbox of any researcher.
Funding
This work was supported by grants from Sir Jules Thorn Charitable Trust (Grant 09/JTA); and the MRC (MR/L01629X/1).
Conflict of Interest: none declared.
References
Barrett,T.et al.(2009) NCBI GEO: archive for high-throughput functional genomic data.Nucleic Acids Res.,37(Database issue), D885–D890. Bornigen,D.et al.(2012) An unbiased evaluation of gene prioritization tools.
Bioinformatics,28, 3081–3088.
Bult,C.J.et al.(2008) The Mouse Genome Database (MGD): mouse biology and model systems.Nucleic Acids Res.,36(Database issue), D724–D728. Chen,J.et al.(2009) ToppGene suite for gene list enrichment analysis and
can-didate gene prioritization. Nucleic Acids Res., 37(Web Server issue): W305–W311.
Chen,Y.et al.(2011) In silico gene prioritization by integrating multiple data sources.PLoS One,6, e21137.
Flicek,P.et al.(2014) Ensembl 2014.Nucleic Acids Res.,42(Database issue), D749–D755.
Golbreich,C.et al.(2006) The foundational model of anatomy in OWL: ex-perience and perspectives.Web Semant.,4, 181–195.
Gray,K.A. et al. (2013) Genenames.org: the HGNC resources in 2013.
Nucleic Acids Res.,41(Database issue), D545–D552.
Hoehndorf,R.et al.(2010) Interoperability between phenotype and anatomy ontologies.Bioinformatics,26, 3112–3118.
Hutz,J.E.et al.(2008) CANDID: a flexible method for prioritizing candidate genes for complex human traits.Genet. Epidemiol.,32, 779–790. Irizarry,R.A.et al.(2005) Multiple-laboratory comparison of microarray
plat-forms.Nat. Methods,2, 345–350.
Karolchik,D. et al. (2004) The UCSC table browser data retrieval tool.
Nucleic Acids Res.,32(Database issue), D493–D496.
Kasprzyk,A. (2011) BioMart: driving a paradigm change in biological data management.Database (Oxford),2011, bar049.
Kohler,S.et al.(2013) Construction and accessibility of a cross-species pheno-type ontology along with gene annotations for biomedical research.
F1000Res,2, 30.
Kohler,S.et al.(2014) The Human Phenotype Ontology project: linking mo-lecular biology and disease through phenotype data.Nucleic Acids Res.,42( Database issue), D966–D974.
Krupp,M.et al.(2012) RNA-Seq Atlas—a reference database for gene expres-sion profiling in normal tissue by next-generation sequencing.
Bioinformatics,28, 1184–1185.
Ma,X.et al.(2007) CGI: a new approach for prioritizing genes by combining gene expression and protein-protein interaction data.Bioinformatics,23, 215–221.
Maglott,D.et al.(2011) Entrez Gene: gene-centered information at NCBI.
Nucleic Acids Res.,39(Database issue), D52–D57.
Masotti,D.et al.(2008) TOM: enhancement and extension of a tool suite for in silico approaches to multigenic hereditary disorders.Bioinformatics,24, 428–429.
at University of Leeds on July 24, 2015
http://bioinformatics.oxfordjournals.org/
Nitsch,D.et al.(2011) PINTA: a web server for network-based gene prioritiza-tion from expression data. Nucleic Acids Res., 39(Web Server issue), W334–W338.
Oellrich,A., and Smedley,D. (2014) Linking tissues to phenotypes using gene expression profiles.Database (Oxford),2014, bau017.
Petryszak,R.et al.(2014) Expression Atlas update—a database of gene and transcript expression from microarray- and sequencing-based functional genomics experiments. Nucleic Acids Res., 42(Database issue), D926–D932.
Pruitt,K.D. et al.(2014) RefSeq: an update on mammalian reference se-quences.Nucleic Acids Res.,42(Database issue), D756–D763.
Ramasamy,A.et al.(2008) Key issues in conducting a meta-analysis of gene expression microarray datasets.PLoS Med.,5, e184.
Rocca-Serra,P.et al.(2003) ArrayExpress: a public database of gene expres-sion data at EBI.C R Biol.,326, 1075–1078.
Seelow,D.et al.(2008) GeneDistiller—distilling candidate genes from linkage intervals.PLoS One,3, e3874.
Smedley,D.et al.(2013) PhenoDigm: analyzing curated annotations to associ-ate animal models with human diseases.Database (Oxford),2013, bat025. Tranchevent,L.C.et al.(2008) ENDEAVOUR update: a web resource for gene
prioritization in multiple species.Nucleic Acids Res.,36(Web Server issue), W377–W384.
Tranchevent,L.C.et al.(2011) A guide to web tools to prioritize candidate genes.Brief Bioinform.,12, 22–32.
van Dam,S.et al.(2012) GeneFriends: an online co-expression analysis tool to identify novel gene targets for aging and complex diseases.BMC Genomics,
13, 535.
Wang,C.et al.(2014) The concordance between RNA-seq and microarray data depends on chemical treatment and transcript abundance. Nat. Biotechnol.,32, 926–932.
at University of Leeds on July 24, 2015
http://bioinformatics.oxfordjournals.org/