This is a repository copy of The effect of natural organic matter on the adsorption of mercury to bacterial cells.
White Rose Research Online URL for this paper: http://eprints.whiterose.ac.uk/127218/
Version: Accepted Version
Article:
Dunham-Cheatham, S, Mishra, B, Myneni, S et al. (1 more author) (2015) The effect of natural organic matter on the adsorption of mercury to bacterial cells. Geochimica et Cosmochimica Acta, 150. pp. 1-10. ISSN 0016-7037
https://doi.org/10.1016/j.gca.2014.11.018
© 2015, Elsevier Ltd. Licensed under the Creative Commons Attribution NonCommercial-NoDerivatives 4.0 International
http://creativecommons.org/licenses/by-nc-nd/4.0/
eprints@whiterose.ac.uk https://eprints.whiterose.ac.uk/
Reuse
This article is distributed under the terms of the Creative Commons Attribution-NonCommercial-NoDerivs (CC BY-NC-ND) licence. This licence only allows you to download this work and share it with others as long as you credit the authors, but you can’t change the article in any way or use it commercially. More
information and the full terms of the licence here: https://creativecommons.org/licenses/
Takedown
If you consider content in White Rose Research Online to be in breach of UK law, please notify us by
‡ Correspondingauthor: dr.smdcheatham@gmail.com
The effect of natural organic matter on the adsorption of mercury to bacterial cells
1
2
Sarrah Dunham-Cheatham1‡, Bhoopesh Mishra2, Satish Myneni3, and Jeremy B. Fein1 3
4
1 Department of Civil and Environmental Engineering and Earth Sciences, University of Notre 5
Dame, Notre Dame, IN 46556, USA
6
2 Department of Physics, Illinois Institute of Technology, Chicago, Illinois 60616, USA 7
3 Department of Geosciences, Princeton University, Princeton, NJ 08544, USA 8
9 10
Abstract
11 12
We investigated the ability of non-metabolizing Bacillus subtilis, Shewanella oneidensis 13
MR-1, and Geobacter sulfurreducens bacterial species to adsorb mercury in the absence and 14
presence of Suwanee River fulvic acid (FA). Bulk adsorption and X-ray absorption spectroscopy 15
(XAS) experiments were conducted at three pH conditions, and the results indicate that the 16
presence of FA decreases the extent of Hg adsorption to biomass under all of the pH conditions 17
studied. Hg XAS results show that the presence of FA does not alter the binding environment of 18
Hg adsorbed onto the biomass, regardless of pH or FA concentration, indicating that ternary 19
bacteria-Hg-FA complexes do not form to an appreciable extent under the experimental conditions, 20
and that Hg binding on the bacteria is dominated by sulfhydryl binding. We use the experimental 21
results to calculate apparent binding constants for Hg onto both the bacteria and the FA. The 22
calculations yield similar binding constants for Hg onto each of the bacterial species studied. The 23
calculations also indicate similar binding constants for Hg-bacteria and Hg-FA complexes, and the 24
values of these binding constants suggest a high degree of covalent bonding in each type of 25
complex, likely due to the presence of significant concentrations of sulfhydryl functional groups 26
on each. S XAS confirms the presence of sulfhydryl sites on both the FA and bacterial cells, and 27
demonstrates the presence of a wide range of S moieties on the FA in contrast to the bacterial 28
2
with bacterial binding sites for aqueous Hg, because of the relatively similar binding constants for 30
the types of sorbents, the competition is not dominated by either bacteria or FA unless the 31
concentration of one type of site greatly exceeds that of the other. 32
33
Introduction
34
Heavy metals, such as Hg, adsorb to proton-active functional groups on bacterial cell 35
envelopes (e.g., Beveridge and Murray, 1976; Fortin and Beveridge, 1997; Daughney et al., 2002; 36
Fein, 2006; Kenney and Fein, 2011), affecting the speciation and distribution of these metals in 37
geologic systems. Recent studies (e.g., Guiné et al., 2006; Mishra et al. 2007; 2009; 2010; 2011; 38
Pokrovsky et al., 2012; Song et al., 2012; Colombo et al., 2013) have shown that at least some 39
bacterial cell envelopes contain proton-active sulfhydryl functional groups. Because Hg binds 40
readily and strongly to sulfur compounds (Compeau and Bartha, 1987; Winfrey and Rudd, 1990; 41
Benoit et al., 1999), bacterial adsorption of Hg may dramatically affect the distribution, transport 42
and fate of Hg in geologic systems. 43
Natural organic matter (NOM) is present in nearly every near-surface geologic system, and 44
complexation reactions between metals and NOM can dramatically change the behavior of the 45
metals in the environment (McDowell, 2003; Ravichandran, 2004). NOM molecules contain a 46
range of functional group types, including carboxyl, phenol, amino, and sulfhydryl groups, that 47
have the potential to create highly stable complexes with metal ions across the pH range (Ephraim, 48
1992; Ravichandran et al., 1999; Drexel et al., 2002; Haitzer et al., 2002; Croué et al., 2003; 49
Ravichandran, 2004). Hg binds strongly to the sulfhydryl groups present within the NOM structure 50
(Dong et al., 2011; Muresan et al., 2011). The relative thermodynamic stabilities of Hg-NOM and 51
3
of metal-NOM complexes may decrease adsorption of Hg to bacteria cell envelopes due to a 53
competitive ligand effect, or under certain conditions may increase adsorption of Hg to bacteria 54
due to ternary complexation with NOM. For example, investigating Pb, Cu, and Ni separately, 55
Borrok et al. (2007) found that ternary metal-FA-bacteria complexes form, and that the importance 56
of the complexes is strongly affected by pH. Conversely, Wightman and Fein (2001) found that 57
the presence of NOM decreases the amount of Cd adsorbed to bacteria under mid- and high-pH 58
conditions, and that the presence of Cd does not affect the adsorption of NOM to bacteria, 59
suggesting that ternary complexes do not occur. No studies have been conducted to date to 60
determine the effects of NOM on Hg binding to bacteria. However, because Hg forms strong 61
complexes both with cell envelopes (Daughney et al., 2002; Mishra et al., 2011; Dunham-62
Cheatham et al.) and NOM (Loux et al., 1998; Ravichandran, 2004; Skyllberg et al., 2006), it is 63
likely that significant changes to Hg adsorption behavior occur in the presence of NOM. 64
In this study, we use bulk adsorption and Hg X-ray absorption spectroscopy (XAS) 65
experiments, conducted as a function of pH and FA concentration, using intact non-metabolizing 66
bacterial cells to study Hg binding onto three different bacterial species and to compare the ability 67
of bacteria to adsorb mercury in the presence and absence of a fulvic acid (FA). We use the 68
experimental results to calculate apparent stability constants for Hg-bacteria and Hg-FA 69
complexes, allowing for quantitative modeling of the competitive binding that can occur between 70
bacteria and FA in more complex settings. This study examined both positive and Gram-71
negative bacterial species in order to determine if cell envelope structure affects the binding 72
reactions, and one species was a Hg methylator, which we examined in order to determine if the 73
extent or nature of Hg binding onto that species differed from that exhibited by the non-74
4
76
Methods
77
Experimental methods
78
Bacterial growth and washing procedure
79
Bacillus subtilis (a Gram-positive aerobic soil species) and Shewanella oneidensis MR-1
80
(a Gram-negative facultative anaerobic species) cells were cultured and prepared following the 81
procedures outlined in Borrok et al. (2007). Briefly, cells were maintained on agar plates consisting 82
of trypticase soy agar with 0.5% yeast extract added. Cells for all experiments were grown by first 83
inoculating a test-tube containing 3 mL of trypticase soy broth with 0.5% yeast extract, and 84
incubating it for 24 h at 32 °C. The 3 ml bacterial suspension was then transferred to 1 L of 85
trypticase soy broth with 0.5% yeast extract for another 24 h on an incubator shaker table at 32 °C. 86
Cells were pelleted by centrifugation at 8100 g for 5 min, and rinsed 5 times with 0.1 M NaClO4. 87
Geobacter sulfurreducens (a Gram-negative species capable of Hg methylation) cells were
88
cultured and prepared using a different procedure than detailed above. Cells were maintained in 89
50 mL of anaerobic freshwater basal media (ATCC 51573) at 32 oC (Lovely and Phillips, 1988). 90
Cells for all experiments were grown by first inoculating an anaerobic serum bottle containing 50 91
mL of freshwater basal media, and incubating it for 5 days at 32 oC. Cells were pelleted by 92
centrifugation at 8100 g for 5 minutes, and rinsed 5 times with 0.1 M NaClO4 stripped of dissolved 93
oxygen by bubbling a 85%/5%/10% N2/H2/CO2 gas mixture through it for 30 minutes. After 94
washing, each of the three types of bacteria was then pelleted by centrifugation at 8100 g for 60 95
minutes to remove excess water in order to determine the wet mass so that suspensions of known 96
5
terms of gm wet biomass per liter. Bacterial cells were harvested during stationary phase, and all 98
experiments were performed under non-metabolizing, electron donor-free conditions. 99
100
Adsorption experiments
101
To prepare experiments, aqueous Hg, NOM, and suspended bacteria stock solutions were 102
mixed in different proportions to achieve the desired final concentrations for each experiment. The 103
experiments were conducted in sets with constant pH (at pH 4.0 ± 0.1, 6.0 ± 0.1, or 8.0 ± 0.3) and 104
constant bacterial concentration (0.2 g bacteria L-1 in all cases) at three different FA concentrations 105
(0, 25, or 50 mg L-1), with Hg log molalities ranging from -6.30 to -5.00 (0.1 to 2.0 mg L-1). 106
FA stock solutions were prepared in Teflon bottles by dissolving dried, powdered 107
International Humic Substances Society Suwannee River FA Standard I in a 0.1 M NaClO4 buffer 108
solution to achieve the desired final FA concentration for each experiment. A known mass of wet 109
biomass was then suspended in the FA stock solution, and the pH of the FA-bacteria parent 110
solution was immediately adjusted to the experimental pH using 0.2 M HNO3 and/or NaOH. To 111
prepare experimental solutions, aliquots of the FA-bacteria parent solution were added 112
gravimetrically to Teflon reaction vessels, followed by a small aliquot of commercially-supplied 113
1,000 mg L-1 Hg aqueous standard to achieve the desired final Hg concentration. The pH of each 114
suspension was again adjusted immediately to the experimental pH. The vessels were placed on 115
an end-over-end rotator to agitate the suspensions for the duration of the experiment (2 h for B. 116
subtilis and G. sulfurreducens and 3 h for S. oneidensis MR-1, as determined by initial kinetics
117
experiments (results not shown)). The pH of the suspensions was monitored and adjusted every 15 118
minutes throughout the duration of the experiment, except during the last 30 minutes, when the 119
6
was measured and the experimental suspensions were centrifuged at 8100 g for 5 minutes. The 121
aqueous phase was collected for Hg analysis by inductively-coupled plasma optical emission 122
spectroscopy (ICP-OES), and the solid phase of some of the runs was collected for XAS analyses. 123
Duplicate experiments were performed for each experimental condition. 124
125
ICP-OES measurements
126
ICP-OES standards were prepared gravimetrically by diluting a commercially-supplied 127
1,000 mg L-1 Hg aqueous standard with pH-adjusted 0, 25, or 50 mg L-1 FA stock solution made 128
in 0.1 M NaClO4 so that the pH, ionic strength, and FA concentration of the standards closely 129
matched that of the samples. We found significant interference when standards and samples were 130
not closely matched in this way. The log molality of the Hg standards ranged from -6.60 to -5.00. 131
The standards and samples were all stored in Teflon containers and analyzed with a Perkin Elmer 132
2000DV ICP-OES at wavelength 253.652 nm within 1 day of collection. The set of standards was 133
analyzed before and after all of the samples were analyzed, as well as after every 15 samples, to 134
check for machine drift. Analytical uncertainty, as determined by repeat analyses of the standards, 135
was ± 2.8% for the 0 mg L-1 FA samples, ± 7.7% for the 25 mg L-1 FA samples, and ± 9.5% for 136
the 50 mg L-1 FA samples. Neither standards nor samples were acidified prior to analysis. FA 137
concentration strongly affected system performance and signal strength, likely due to spectral 138
interferences caused by the FA molecule. For each pH and FA concentration condition studied, we 139
conducted biomass-free control experiments to determine the extent of Hg loss due to adsorption 140
onto the experimental apparatus as well as any interferences caused by the presence of FA during 141
the ICP-OES analysis. 142
7
XAS measurements
144
Hg LIII-edge X-ray absorption near edge structure (XANES) and extended X-ray 145
absorption fine-structure spectroscopy (EXAFS) measurements were performed at the MRCAT 146
sector 10-ID beamline (Segre et al., 2000), Advanced Photon Source, at Argonne National 147
Laboratory. The continuous-scanning mode of the undulator was used with a step size of 0.5 eV 148
and an integration time of 0.1 sec per point to decrease the radiation exposure during a single scan. 149
Additionally, measurements were made at different spots on the samples to further decrease the 150
exposure time. Hg XAS measurements were collected as described in Mishra et al. (2011). 151
Crystalline powder standards (cinnabar [red HgS] and mercuric acetate) were measured 152
and used to calibrate the theoretical calculations against experimental data. Data from the standards 153
were analyzed to obtain the S02 parameter, where S02 is the value of the passive electron reduction 154
factor used to account for many-body effects in EXAFS. By fixing the values of S and O atoms to 155
2 in cinnabar and mercuric acetate, we obtained S02 values of 1.02 ± 0.05 and 0.98 ± 0.03, 156
respectively. Hence, we chose to set the value of S02 = 1.0 for all samples. Fitting of the powder 157
standards to their known crystallographic structures (cinnabar and mercuric acetate) reproduced 158
the spectral features in the entire fitting range (1.0–4.2 Å), and fitting parameters were in 159
agreement with previously reported values. Only the paths necessary to model the solid standards 160
were used for fitting the solution standards and the unknown Hg samples. 161
Two Hg species, Hg-cysteine and Hg-acetate, were utilized as solution-phase standards for 162
Hg XAS analyses. First, an aqueous Hg2+ standard was prepared from high-purity 5 mM Hg2+ in 163
5% HNO3 and was then adjusted to pH 2.0 ± 0.1for measurement by adding appropriate amounts 164
of 5 M NaOH. A Hg-cysteine standard was prepared by adding cysteine to the aqueous Hg2+ 165
8
to 5.0 ± 0.1 by adding appropriate amounts of 1 M or 5 M NaOH. A Hg-acetate standard was 167
prepared by adding mercuric acetate salt to milliQ water and adjusting the pH to 5.0 ± 0.1 by 168
adding appropriate amounts of 1 M or 5 M NaOH. 169
Sulfur K-edge XANES spectra for biomass and FA samples were acquired at sector 9-BM 170
of the Advanced Photon Source at Argonne National Laboratory using Lytle detector in 171
fluorescence detection mode. At 9-BM, signal from higher order harmonics was removed by 172
detuning the monochromator to 70% of maximum beam flux at 2472.0 eV. Energy calibration was 173
performed by setting the first peak in the spectrum of sodium thiosulfate salt (Na2S2O3) to 2469.2 174
eV. XANES spectra were measured between 2450 and 2500 eV. Step sizes in the near-edge region 175
(2467-2482 eV) were 0.08 eV, and 0.2 eV in pre- and post- edge regions, respectively. Samples 176
were smeared on carbon tape and the data were collected under a He atmosphere. 177
For this study, sulfur species are divided into three main categories and referred to as 178
reduced S (below 2472 eV), sulfoxide S (near 2473.5 eV), and oxidized S (above 2476.5 eV). 179
Accordingly, three commercially-supplied (Sigma Aldrich) S standards, cysteine, dimethyl 180
sulfoxide (DMSO), and sodium dodecyl sulfate (NaDS), were used to fingerprint S speciation. S 181
standards were mixed with a dry powder of polyacrylic acid (PAA) to achieve a mixture containing 182
~1% total S by mass. To perform S XANES measurements, a thin layer of a PAA-S standard 183
mixture was smeared on a carbon tape. All standards were prepared within 12 hours of analysis. 184
To prepare Hg XAS samples, FA was reacted with Hg by diluting a commercially-supplied 185
1000 mg L-1 Hg standard with a pH-adjusted 50 mg L-1 FA stock solution prepared in 0.1 M 186
NaClO4. The log molalities of Hg investigated were -4.30 and -3.60 at both pH 4.00 ± 0.10 and 187
8.00 ± 0.10 for each Hg concentration. S. oneidensis MR-1 biomass was also reacted with Hg in 188
9
on the bacterial cell envelopes. Biomass was collected from the experiments with -5.30 log M Hg, 190
pH values 4.00 ± 0.10 or 8.00 ± 0.10, and 50 mg L-1 FA. Samples were loaded into slotted Plexiglas 191
holders that were subsequently covered with Kapton tape with a Kapton film sandwiched in 192
between the tape and plexiglass to avoid direct contact of the sample with the tape adhesive. 193
Samples were refrigerated until data collection. All measurements were conducted within 48 hours 194
of sample preparation. 195
The data were analyzed by using the methods described in the UWXAFS package (Stern 196
et al., 1995). Energy calibration between different scans was maintained by measuring Hg/Sn 197
amalgam on the reference chamber concurrently with the fluorescence measurements of the 198
biomass-bound Hg samples (Harris et al., 2003). The inflection point of the Hg LIII-edge (12.284 199
KeV) was used for calibration. Data processing and fitting were done with the ATHENA and 200
ARTEMIS programs (Ravel and Newville, 2005). The data range used for Fourier transformation 201
of the k-space data was 2.0–9.5 Å-1. The Hanning window function was used with dk = 1.0 Å-1. 202
Fitting of each spectrum was performed in r-space, at 1.2-3.2 Å, with multiple k-weighting (k1, k2,
203
k3) unless otherwise stated. Lower 2 (reduced chi square) was used as the criterion for inclusion 204
of an additional shell in the shell-by-shell EXAFS fitting procedure. 205
206
Thermodynamic modeling
207
Surface-complexation models were constructed to model Hg binding with bacterial cell 208
envelope functional groups and with those on the FA molecules, and to quantify the competition 209
between the two. Observed adsorption reactions between aqueous Hg species and deprotonated 210
bacterial cell envelope sites and/or FA binding sites were modeled according to the following 211
10
Hg speciesx+ + R-A
i-⇔ (R-Ai)(Hg species)(x-1)+ (1)
213
where ‘Hg speciesx+’ represents the specific aqueous Hg species considered, ‘R-A
i-’ represents the
214
deprotonated cell or FA binding site, ‘(R-Ai)(Hg species)’ represents the Hg-bacterial cell envelope
215
or Hg-FA complex, and the ‘x’ represents the charge of the aqueous Hg species. Stability constants 216
for each of the Hg-bacterial cell envelope and Hg-FA complexes are expressed as the 217
corresponding mass action equation for Reaction (1): 218 ] [ ) ( ] ) )(
[( ( 1)
− + + − − − = i x x i ads A R species Hg a species Hg A R K (2) 219
where Kads is the thermodynamic equilibrium constant for Reaction (1), the square brackets
220
represent concentrations in mol L-1, and a represents the activity of the species in parentheses. 221
We used FITEQL 2.0 (Westall, 1982) for the equilibrium thermodynamic modeling of the 222
adsorption data, using the aqueous speciation equilibria and equilibrium constants given in Table 223
S1, and using the Davies equation within FITEQL to calculate activity coefficients. Because all of 224
our experiments were conducted at the same ionic strength, we applied a non-electrostatic model 225
to account for the Hg adsorption data. Bacterial site concentrations and acidity constants used in 226
the calculations for B. subtilis, for S. oneidensis MR-1, and for G. sulfurreducens are from Fein et 227
al. (2005), Mishra et al. (2010), and Dunham-Cheatham et al., respectively. The objective of the 228
modeling exercise was not to construct precise site-specific mechanistic binding models, but rather 229
to provide a quantitative means of estimating the competitive binding of bacteria and FA under a 230
range of relative concentration conditions. Toward this end, because specific binding constants for 231
Hg with each site type on the FA molecule are not known, we modeled Hg binding with the FA as 232
a single complexation reaction between Hg2+ and the deprotonated form of a generic FA site. We 233
assumed that this generic binding site exhibits an acidity constant equal to the average of the acidity 234
11
sites, using the average values from Borrok and Fein (2004) as a model of the FA site speciation. 236
The calculated acidity constant and site concentration for this generic site are listed in Table S1. 237
238
Results
239
Adsorption experiments
240
Consistent with previous studies of Hg adsorption onto bacteria (Daughney et al., 2002; 241
Dunham-Cheatham et al.), we observed extensive adsorption of Hg onto the bacterial species 242
studied in the absence of FA, with the extent of adsorption relatively independent of pH between 243
pH 4 and 8 (Figure 1, top plots). For example, approximately 77% of the Hg in a 2 mg L-1 Hg 244
solution adsorbs at pH 4 onto 0.2 g L-1 S. oneidensis MR-1, while approximately 75% adsorbs at 245
pH 8. The presence of FA decreases the amount of Hg adsorbing to cell envelopes of each of the 246
bacterial species and at each of the pH conditions studied (Figure 1, middle and bottom plots). 247
With 50 mg L-1 FA, the extent of adsorption at pH 4 decreases to 65%, and at pH 8 to 50%. Our 248
experimental results also indicate that the three bacterial species studied here exhibit similar 249
extents of Hg adsorption under each experimental condition, consistent with the observations from 250
a number of previous studies (e.g. Cox et al., 1999; Yee and Fein, 2001; Borrok et al., 2005, 251
Johnson et al., 2007). Our data suggest that as the concentration of FA increases, so does the 252
amount of Hg remaining in solution. These results indicate that FA competes with the bacterial 253
cells for the adsorption of Hg, and that the adsorption of Hg to FA results in a competitive ligand 254
effect. As a result, less Hg is available for adsorption to proton-active functional groups on the 255
bacterial cell envelope, and less Hg is removed from solution. These results are not surprising, as 256
FA molecules contain sulfhydryl groups within their structure and sulfhydryl groups bind strongly 257
with Hg (Xia et al., 1999; Hesterberg et al., 2001; Drexel et al., 2002; Haitzer et al., 2002; 2003), 258
12
sulfhydryl functional groups (Guiné et al., 2006; Mishra et al., 2007; 2009; 2010; 2011; Pokrovsky 260
et al., 2012; Song et al., 2012; Colombo et al., 2013). In our experimental systems, FA binding 261
sites outnumber those present on the bacteria. For example, 50 mg L-1 FA corresponds to 262
approximately 2.8 x 10⁻⁴ moles of sites L-1 (Borrok and Fein, 2004), while 0.2 g L-1 B. subtilis 263
biomass contains 4.7 x 10⁻⁵ total moles of sites L-1. At pH 8, 50 mg L-1 FA does diminish the extent 264
of Hg adsorption, but only from approximately 75% (with no FA present) to 50%. It appears that 265
given equal site concentrations, bacterial binding of Hg would dominate the competition with FA. 266
267
Hg XANES and EXAFS
268
To probe the effect of FA on Hg binding mechanisms with bacterial biomass, we 269
examined Hg-biomass binding at pH 4 and 8 in the presence and absence of a stoichiometric 270
excess of FA (1 mg L-1 Hg and 50 mg L-1 FA) using Hg LIII edge XANES and EXAFS. For the 271
XAS studies, S. oneidensis MR-1 was chosen to represent the bacterial species used in this study. 272
Figure 2 shows a comparison between Hg XANES for Hg bound : 1) to FA and to S. oneidensis 273
MR-1 biomass at pH 4, 2) to S. oneidensis MR-1 biomass in the presence and absence of FA at 274
pH 4, 3) to S. oneidensis MR-1 biomass in the presence and absence of FA at pH 8, and 4) to 275
cysteine, and to acetate. Hg XANES data indicate that Hg is complexed with thiol groups in the 276
Hg-biomass samples. Spectral features supporting this conclusion are the small pre-edge peak 277
and the slight dip at 12300 eV in the biomass XANES data similar to that present in the Hg-278
cysteine data. This finding is consistent with a previous study which showed Hg binding with 279
sulfhydryl groups on B. subtilis cell envelopes under similar experimental conditions (Mishra et 280
al., 2011). The Hg-FA XANES data exhibits a small pre-edge peak similar to that present in the 281
13
groups in FA under the experimental conditions. The absence of the dip in the Hg-FA XANES at 283
12300 eV, however, indicates differences in the coordination environment of Hg between FA 284
and bacterial biomass. To understand these subtle differences in XANES, a linear combination 285
fitting of the first derivative of Hg-FA XANES data was performed which resulted in about 90% 286
contribution from Hg-cysteine binding and about 10% contribution from Hg-carboxyl binding 287
(figure S2a). The first derivative of Hg-cysteine standard reproduced the Hg-biomass data 288
confirming that the entire budget of Hg complexation with biomass was accounted by 289
complexation of Hg with thiols. XANES spectra of Hg reacted with S. oneidensis MR-1 biomass 290
in the presence and absence of FA at pH 4 and 8 are reproducible, confirming that the binding 291
mechanism of Hg with S. oneidensis MR-1 biomass does not change appreciably in the presence 292
of FA. 293
Hg EXAFS results are consistent with the Hg XANES results described above. Differences 294
between the coordination environment of Hg-FA and Hg-biomass is more pronounced in the k2 (k) 295
EXAFS data (Figure S1). Low signal to noise ratio in the aqueous Hg-FA data does not allow for 296
a meaningful Fourier Transform (FT) of the Hg-FA EXAFS data. EXAFS k2 (k) and FT data 297
between FA-bearing and FA-free Hg-biomass samples are similar (Figure S1), validating the Hg 298
XANES results. Figure S2b shows a comparison between the FT Hg EXAFS data for Hg bound 299
to S. oneidensis MR-1 biomass in the presence and absence of FA at both pH 4 and 8 and their 300
corresponding EXAFS fits. EXAFS fitting parameters are shown in Table S2. It is worth pointing 301
out that although Hg-cystein standard showed a bond distance of 2.32 Å, Hg-biomass samples at 302
pH 4 and 8 had a bond distance of 2.35 Å. This should not be considered a discrepancy because 303
Hg-S distances can vary from 2.32 to 2.36 Å for Hg(SR)2 complexes (Manceau,and Nagy 2008).
304
Similarly, Hg-S distances can range from 2.40 to 2.51 Å for Hg(SR)3 complexes, and 2.50–2.61 Å for
305
Hg(SR)4 complexes.
14 307
308
Taken together, Hg XANES and EXAFS results indicate that Hg binds predominantly to 309
the high-affinity thiol groups on bacterial cell envelopes in the presence and absence of FA and 310
Hg binding mechanisms with bacterial biomass do not change in the presence of FA, excluding 311
the possibility of the formation of a ternary complex. Additionally, Hg XAS results show that pH 312
does not affect the adsorption mechanism of Hg onto biomass in the presence of FA, which is 313
consistent with the similar extent of Hg adsorption as a function of pH described above. However, 314
it is important to note that Hg binding mechanisms with bacterial biomass may be affected by FA 315
at high Hg loadings, where Hg is primarily bound to biomass via lower-affinity carboxyl functional 316
groups. Hg XAS results suggest that S functional groups on S. oneidnensis MR-1 cell envelopes 317
outcompete S functional groups in FA for Hg binding. In other words, on average Hg binding to 318
FA appears weaker than Hg binding to bacterial biomass. S XANES was conducted to identify the 319
differences in complexation behavior of Hg with S functional groups on FA and bacterial biomass. 320
S K-edge XANES is highly sensitive to changes in the electronic environment of the sulfur 321
absorber (Xia et al., 1998). Although S K-edge XANES spectra were collected on a large number 322
of standards, in this study we have divided S species into three main categories: reduced S (below 323
2472 eV), sulfoxide S (near 2473.5 eV), and oxidized S (above 2476.5 eV). The S XANES spectra 324
for cysteine, dimethyl sulfoxide (DMSO), and sodium dodecyl sulfate (NaDS) are shown in Figure 325
3a. Species with very different S oxidation states, such as cysteine, sulfoxide, and ester sulfate, are 326
easily resolved in the XANES spectrum. However, resolving one species from another within these 327
three energy ranges is challenging. Reduced S species, including thiols, sulfides, polysulfides, and 328
thiophenes, all give white-line features occurring between 2469 and 2472 eV. More extensive 329
15 in the literature (Myneni, 2002; Vairavamurthy, 1998). 331
Speciation of S in S. oneidensis MR-1 biomass was easily identified because the peak 332
energy position of S XANES measurement on the biomass overlapped with the cysteine peak 333
position (Figure 3b). Figure 3b shows the dramatic differences between S XANES on S. oneidensis 334
MR-1 cells and Suwanee River FA. S XANES comparing FA with S. oneidensis MR-1 shows that 335
nearly the entire S budget of the biomass is present as thiol groups, which are known to form strong 336
bonds with Hg. However, FA has a range of reduced S (including reactive thiol) groups and a large 337
fraction of oxidized S species, consistent with previous observations (Morra et al., 1997). Morra 338
et al., 1997 suggest that a significant fraction of sulfur in SR Fulvic acid is found in oxidized (+5 339
oxidation state) form, followed by smaller fractions in reduced forms (-0.3 ±1.0 and 1.7 oxidations 340
states) respectively. Similarly, Einsiedl et al., 2007 used S XANES to estimate that soil FAs 341
contain around 51% oxidized (S+4,S+5,S+6) and 49% reduced (S−1,S0,S+2) sulfur species. The 342
reduced S species was dominated by thiols, thiophene and disulfide. Such a dramatic difference 343
between the S budget of FA and bacterial biomass could result in diverse reactivities and stabilities 344
of Hg-S complexes between the two. A detailed study of the reactivity and stability of Hg with FA 345
and bacterial biomass is beyond the scope of this study. 346
347
Discussion
348
The experimental results presented here suggest that bacterial cell envelope functional 349
groups and FA functional groups exhibit different binding affinities for Hg under the experimental 350
conditions. Hg binding onto the bacterial cell envelopes is extensive, and although Hg binds 351
strongly with FA, especially with the sulfhydryl groups present within FA (Xia et al., 1999; 352
16
50 ppm FA with only 0.2 g (wet mass) L-1 of bacteria does not cause the speciation of Hg to be 354
dominated by the FA. The results suggest there is a possibility for competition between the 355
bacterial and FA binding sites for the available Hg. 356
In order to quantify the competitive binding, we use a semi-empirical surface complexation 357
approach. First, we use the FA-free adsorption data at pH 4, 6, and 8 to solve for equilibrium 358
constants for the following Hg2+ adsorption reactions, respectively: 359
R-A1- + Hg2+⇔ R-A1-Hg+ (3)
360
R-A2- + Hg2+⇔ R-A2-Hg+ (4)
361
R-A3- + Hg2+⇔ R-A3-Hg+ (5)
362
where R-A1, R-A2, and R-A3 represent the bacterial functional groups with the three lowest pKa
363
values, respectively. At pH 4, the R-A1 sites are the dominant deprotonated sites available for Hg2+
364
binding for each bacterial species; at pH 6, both R-A1 and R-A2 sites are deprotonated; and at pH
365
8, R-A1, R-A2, and R-A3 sites likely contribute to the binding of Hg2+. Therefore, we used the pH 4
366
data to constrain the stability constant value for Reaction (3) alone, then fixed that value and used 367
the pH 6 data to solve for the stability constant value for Reaction (4) with a model that involved 368
Reactions (3) and (4) simultaneously. We then used the values that we calculated for the stability 369
constants for Reactions (3) and (4) and the pH 8 data to solve for the best-fitting value for Reaction 370
(5) with a model that involved Reactions (3) - (5) simultaneously. This modeling approach assumes 371
that Hg2+ binding at a given pH occurs dominantly onto sites with pKa values lower than the pH 372
of the experiments; that is, dominantly onto deprotonated sites. However, the resulting stability 373
constant values, which are tabulated in Table 1, yield excellent fits to the FA-free Hg adsorption 374
data as a function of pH and Hg loading (e.g., Figure 4). The calculated stability constants for each 375
17
values for Reaction (3) range from 7.3 for B. subtilis to 7.8 for G. sulfurreducens; those for 377
Reaction (4) range from 11.2 for S. oneidensis MR-1to 11.6 for both B. subtilis and G. 378
sulfurreducens; and those for Reaction (5) range from 15.6 for S. oneidensis MR-1 to 16.5 for G.
379
sulfurreducens. The fact that the stability constant values increase by four-to-five orders of
380
magnitude from one site to the next likely is due to the simplified nature of the adsorption model. 381
We assume that Hg2+ is the adsorbing aqueous Hg species under all pH conditions. However, 382
Hg(OH)2 is the dominant aqueous Hg species under the experimental conditions, and the 383
concentration of Hg2+ is small and becomes smaller with increasing pH over the pH range of our 384
experiments. Therefore, because the extent of adsorption is relatively pH independent, the stability 385
constants that describe adsorption of Hg2+ onto bacterial binding sites must become larger with 386
each site considered. 387
Site-specific Hg binding constants have not been determined for Suwanee River FA, so we 388
could not compare the measured effects of the presence of FA with those we would predict from 389
speciation calculations. However, we used the measured extents of Hg adsorption in the presence 390
of FA to calculate empirical generic site Hg binding constants for the FA. That is, we modeled the 391
Hg binding onto the FA with the following single site reaction: 392
FA- + Hg2+⇔ FA-Hg+ (6)
393
where FA- represents the generic deprotonated site on the FA molecule. We modeled this site as a
394
hybrid of the 4 sites used by Borrok and Fein (2004) to account for FA protonation behavior, with 395
the pKa value of the hybrid FA site equal to the average of the pKa values used by Borrok and 396
Fein (2004) and the site concentration equal to the average of the total of the 4 sites for all 9 FAs 397
modeled by Borrok and Fein (2004). Clearly, modeling Hg2+ adsorption onto this hybrid generic 398
18
but it allows us to quantify the competition between the FA and the bacterial cell envelope, and to 400
calculate quantitative estimates of the effects of each binding environment in more complex 401
settings. 402
The calculated stability constants, tabulated in Table 1, yield an excellent fit to the observed 403
effects of the presence of FA on Hg adsorption onto the bacteria studied here (e.g., Figure 4). The 404
stability constants that we calculated for the three bacterial species are similar to each other and 405
do not vary systematically between bacterial species. Additionally, the 25 mg L-1 FA data yield 406
calculated Hg-FA stability constant values that are not significantly different from those calculated 407
using the 50 mg L-1 FA data. The calculated stability constant values do change systematically 408
with pH, with values increasing with increasing pH. This trend is likely a result of the 409
oversimplification of our Hg-FA binding model; it is probable that the FA molecule contains 410
multiple functional group types that deprotonate sequentially with increasing pH, not just the one 411
site type that we assumed in our models. However, the calculated log stability constant values are 412
not strongly dependent upon pH, with the largest spread being from 13.4 to 14.9 for the pH 4 to 8, 413
25 mg L-1 FA data for B. subtilis. Thus, the values in Table 1 can be used to yield reasonable 414
estimates of the competition between bacteria and FA in the pH and FA:bacteria concentration 415
ratio conditions studied here. 416
The calculated K values can be used to illustrate the direct competition between bacteria 417
and FA for available aqueous Hg2+. For example, the competition reaction between bacterial site 418
A2 and the FA binding site can be expressed as: 419
R-A2-Hg+ + FA-⇔ FA-Hg+ + R-A2- (7)
420
where the log equilibrium constant for Reaction (7) can be calculated as the log K value for 421
19
oneidensis MR-1, and 2.6 for G. sulfurreducens under pH 6 conditions with 50 mg L-1 FA, 0.2 g 423
L-1 bacteria. These calculated equilibrium constant values for Reaction (7) can be used to quantify 424
the distribution of Hg between bacterial and FA binding sites for conditions with different relative 425
concentrations of each site type, and the large positive values suggest that on a mass normalized 426
basis, bacterial binding of Hg is greater than that exhibited by FA. Although both bacteria and FA 427
contain sulfhydryl binding sites that are especially effective at binding Hg, our results suggest that 428
these sites may exhibit a higher density on bacteria than they do on FA. It is likely that the FA 429
contains binding sites with a range of Hg binding constants. The binding constants determined by 430
the simplified thermodynamic modeling described above represents an averaging of several site 431
types, some of which have larger binding constants than do the binding sites on the cell envelopes, 432
accompanied by a large number of site with binding constants that are smaller than those on the 433
cell envelopes. The resulting averaged Hg binding constant that we calculate for the FA is similar 434
to those that we calculate for the bacterial biomass. These general conclusions about the S binding 435
mechanisms on the FA and on the bacteria are supported by our S XANES data, which demonstrate 436
that the FA contains a wide range of S moieties while the bacterial biomass is dominated by a 437
single thiol-type S moiety. 438
439
Conclusions
440
The results from this study show that the presence of FA decreases the extent of Hg 441
adsorption onto three different bacterial species through competitive binding of the Hg. The 442
presence of the FA does not change the binding environment of Hg on the bacteria, indicating a 443
lack of ternary complexation between the Hg, the FA, and the bacteria. The binding of Hg to both 444
20
both ligands, and the similarities between the binding environments likely results in the 446
competitive balance between them. We use the experimental results to calibrate a quantitative 447
semi-empirical model of the binding of Hg to bacteria and FA, and the stability constants that we 448
calculate can be used to estimate the distribution and speciation of Hg in bacteria- and FA-bearing 449
geologic systems. Because accessibility of Hg to bacteria for metabolic processes such as 450
methylation may be controlled by adsorption, the stability constants calculated in this study may 451
also be useful in estimating the bioavailability of Hg in soil and groundwater systems that contain 452
significant concentrations of FA. 453
454
Acknowledgements
455
Funding for this research was provided by a U.S. Department of Energy, Subsurface 456
Biogeochemistry Research (SBR) grant. The experiments and analyses were performed at the 457
Center for Environmental Science & Technology, University of Notre Dame. XAS measurements 458
were obtained at the MRCAT-10-ID Beamline at the Advanced Photon Source (APS), Argonne 459
National Laboratory. BM was supported by the Argonne Subsurface Scientific Focus Area project, 460
which is part of the SBR Program of the Office of Biological and Environmental Research (BER), 461
21
Tables
463
Table 1: Calculated log stability constant values for Reactions (3) - (6). 464
465
[FA] (mg L-1)
pH Bacteria Reaction
(3)a
Reaction (4)b
Reaction (5)c
Reaction (6)d
25 mg L-1 FA 50 mg L-1 FA
0
B. subtilis 7.3 ± 0.1 11.6 ± 0.2 16.4 ± 0.1 S. oneidensis MR-1 7.6 ± 0.2 11.2 ± 0.1 15.6 ± 0.1 G. sulfurreducens 7.8 ± 0.2 11.6 ± 0.1 16.5 ± 0.1
25, 50
4
B. subtilis 13.4 ± 0.2 13.4 ± 0.1
S. oneidensis MR-1 13.8 ± 0.2 13.6 ± 0.3
G. sulfurreducens 13.8 ± 0.1 13.6 ± 0.1
6
B. subtilis 14.3 ± 0.1 14.0 ± 0.1
S. oneidensis MR-1 14.4 ± 0.2 14.2 ± 0.3
G. sulfurreducens 14.4 ± 0.2 14.2 ± 0.1
8
B. subtilis 14.9 ± 0.2 14.4 ± 0.2
S. oneidensis MR-1 14.9 ± 0.2 15.0 ± 0.4
G. sulfurreducens 14.6 ± 0.3 14.6 ± 0.2
Average value: 14.3 ± 0.2 14.1 ± 0.2
a R-A
1- + Hg2+⇔ R-A1-Hg+ 466
b R-A
2- + Hg2+⇔ R-A2-Hg+ 467
c R-A
3- + Hg2+⇔ R-A3-Hg+ 468
d FA
+ Hg2+⇔ FA-Hg+. Both columns present the calculated log stability constant values for the adsorption of Hg to deprotonated FA, as expressed
469
in Reaction (6). The left column presents the values calculated from the 25 mg L-1 FA data, and the right column presents the values calculated from
470
the 50 mg L-1 FA data.
22
Figures
472 473
474
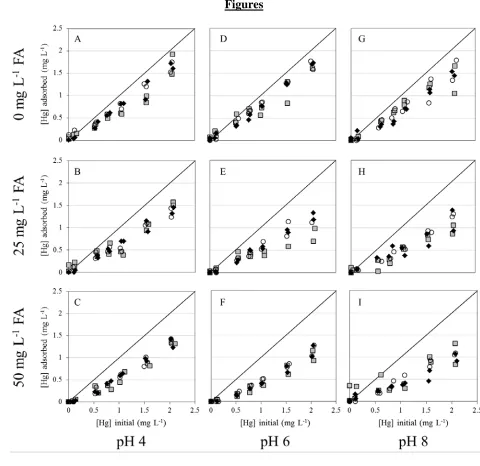
Figure 1: Aqueous chemistry results for Hg isotherms in the absence and presence of FA at pH 4 475
(A, B, C), pH 6 (D, E, F), and pH 8 (G, H, I). Plots A, D, and G present the results for the FA-476
free controls, plots B, E, and H present the results for the 25 mg L-1 FA experiments, and plots C, 477
F, and I present the results of the 50 mg L-1 FA experiments. B. subtilis is represented by the 478
[image:23.612.62.542.75.541.2]23
diamonds, and G. sulfurreducens is represented by the hollow circles. The black line on each plot 480
24 482
Figure 2: Hg LIII edge XANES spectra of Hg bound to (from top to bottom) S. oneidensis MR-1 483
only at pH 4, FA only at pH 4, S. oneidensis MR-1 in the presence of 50 and 0 mg L-1 FA at pH 484
4, S. oneidensis MR-1 in the presence of 50 and 0 mg L-1 FA at pH 8, cysteine only, and acetate 485
only. 486
25 488
Figure 3: Sulfur K edge XANES spectra for a) cysteine, dimethyl sulfoxide (DMSO), and sodium 489
26 491
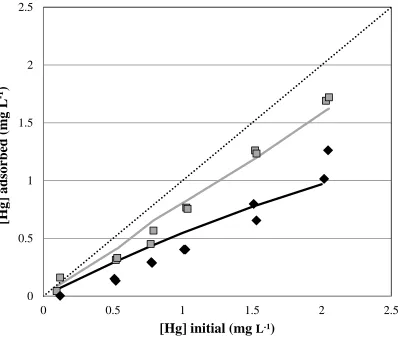
Figure 4: Representative model fits for S. oneidensis MR-1 at pH 6 under 0 mg L-1 FA (grey 492
squares and grey curve) and 50 mg L-1 FA (solid black diamonds and black curve) conditions. 493
The dotted line represents 100% Hg adsorption under each experimental condition. 494
495
0 0.5 1 1.5 2 2.5
0 0.5 1 1.5 2 2.5
[H
g] adsor
be
d (m
g
L
-1
)
27
Supplemental Information
[image:28.612.61.410.124.645.2]496
Table S1: Hg reactions used in the speciation modeling. 497
Reaction Log K
H2O – H+ = OH- -14.00 b
H2CO30 – H+ = HCO3- -6.355 a
H2CO30 – 2H+ = CO32- -16.67 a
H2CO30 – H2O = CO20 2.770 b
Na+ + H
2CO30 – 2H+ = NaCO3- -15.41 b Na+ + H
2CO30 – H+ = NaHCO30 -6.60 b
Na+ + H2O – H+ = NaOH0 -14.2 b
Hg2+ + H2O - H+ = HgOH+ -3.40 a
Hg2+ + 2H
2O - 2H+ = Hg(OH)20 -5.98 a
Hg2+ + 3H2O - 3H+ = Hg(OH)3- -21.1 a 2Hg2+ + H2O - H+ = Hg2(OH)3+ -3.30 b 3Hg2+ + 3H
2O - 3H+ = Hg3(OH)33+ -6.40 b Hg2+ + H2CO30 – 2H+ = HgCO30 -3.91 a Hg2+ + H2CO30 – H+ = HgHCO3+ 0.42 a Hg2+ + H
2CO30 + H2O – 3H+ = Hg(OH)CO3- -11.355 a B1- + H+ = B1-H0
Bacillus subtilis 3.30 c
Shewanella oneidensis 3.30 d
Geobacter sulfurreducens 3.36 e B2- + H+ = B2-H0
Bacillus subtilis 4.80 c
Shewanella oneidensis 4.80 d
Geobacter sulfurreducens 4.81 e B3- + H+ = B3-H0
Bacillus subtilis 6.80 c
Shewanella oneidensis 6.70 d
Geobacter sulfurreducens 6.49 e
FA- + H+ = FA-H0 5.85 f
a Powell et al., 2005. 498
b Martell and Smith, 2001. 499
c Fein et al., 2005 500
d Mishra et al., 2010 501
e Dunham-Cheatham et al. 502
f Calculated as the average of all reported pK
a values in Table 2 from Borrok and Fein (2004). 503
Assumed total site concentration is the sum of the average site concentrations for the individual 504
FA sites: 5.50 x 10⁻³ moles of sites per gram of humic substance. 505
28
Table S2: Best-fit values of Hg solution standards and Hg-biomass samples. 507
Sample path N R(Å) 2 (10-3 Å2)
HgAc Hg-O
Hg-C
1.78 ± 0.32 1.78a
2.06 ± 0.01 2.83 ± 0.01
10.9 ± 0.9 12.8 ± 4.0 Hg-cysteine Hg-S 1.88 ± 0.21 2.32 ± 0.01 10.5 ± 1.2 Hg-biomass (at pH 4) Hg-S 1.85 ± 0.19 2.35 ± 0.01 10.2 ± 1.5 Hg-biomass (at pH 8) Hg-S 1.70 ± 0.15 2.35 ± 0.01 11.0 ± 1.3 a Set to Coordination number of O for this sample.
508
509
510
Sample path CN R(Å) 2 (10-3 Å2) Eo 2 R
HgAc Hg-O
Hg-C
1.78 ± 0.32 1.78a
2.06 ± 0.01 2.83 ± 0.01
10.9 ± 0.9 12.8 ± 4.0
1.2 ± 0.9 48 0.63
Hg-cysteine Hg-S 1.88 ± 0.21 2.32 ± 0.01 10.5 ± 1.2 2.8 ± 0.6 22 0.45
Hg-biomass (at pH 4)
Hg-S 1.85 ± 0.19 2.35 ± 0.01 10.2 ± 1.5 3.0 ± 0.5 30 0.55
Hg-biomass (at pH 8)
Hg-S 1.70 ± 0.15 2.35 ± 0.01 11.0 ± 1.3
a Set to Coordination number of O for this sample. 511
29 513
Figure S1: k2 (k) EXAFS data for Hg L
III edge EXAFS spectra of Hg bound to (top to bottom): 514
S. oneidensis MR-1 only at pH 4, FA only at pH 4, S. oneidensis MR-1 in the presence of 50 and
515
0 mg L-1 FA at pH 4, S. oneidensis MR-1 in the presence of 50 and 0 mg L-1 FA at pH 8, cysteine 516
only, and acetate only. 517
k
2
.
(
k
) (Å
-2
)
30 518
Figure S2: Magnitude of Hg LIII edge EXAFS Fourier Transform (FT) data for Hg binding to S. 519
oneidensis MR-1 in the presence of 0 and 50 mg L-1 FA at pH 4 (top), and 0 and 50 mg L-1 FA at 520
pH 8 (bottom). 521
522
Radial Distance (Å)
Ma
g
{
FT
(
k
2
(
k
31
References
523
Benoit J. M., Gilmour C. C., Mason R. P., and Heyes A. (1999) Sulfide Controls on Mercury 524
Speciation and Bioavailability to Methylating Bacteria in Sediment Pore Waters. 33. 951-957. 525
Beveridge T. J., and Murray R. G. E. (1976) Uptake and retention of metals by cell walls of 526
Bacillus subtilis. Journal of Bacteriology. 127. 1502-1518. 527
Borrok D and Fein J. B. (2004) Distribution of protons and Cd between bacterial surfaces and 528
dissolved humic substances determined through chemical equilibrium modeling. Geochimica 529
et Cosmochimica Acta. 68. 3043-3052. 530
Borrok D., Turner B. F., and Fein J. B. (2005) A universal surface complexation framework for 531
modeling proton binding onto bacterial surfaces in geologic settings. American Journal of 532
Science. 305. 826-853. 533
Borrok D., Aumend K. and Fein J. B. (2007) Significance of ternary bacteria-metal-natural organic 534
matter complexes determined through experimentation and chemical equilibrium modeling. 535
Chemical Geology. 238. 44-62. 536
Colombo M. J., Ha J., Reinfelder J. R., Barkay T., Yee N. (2013) Anaerobic oxidation of Hg(0) 537
and methylmercury formation by Desulfovibrio desulfuricans ND132. Geochimica et 538
Cosmochimica Acta. 112. 166-177. 539
Compeau G. C., and Bartha R. (1987) Effect of salinity on mercury-methylating activity of sulfate-540
reducing bacteria in estuarine sediments. Applied and Environmental Microbiology. 53. 261-541
265. 542
Cox J. S., Smith D. S., Warren L. A., and Ferris F. G. (1999) Characterizing heterogeneous 543
bacterial surface functional groups using discrete affinity spectra for proton binding. 544
Environmental Science & Technology. 33. 4514-4521. 545
Croué J.-P., Benedetti D., Violleau D., and Leenheer J. A. (2003) Characterization and Copper 546
Binding of Humic and Nonhumic Organic Matter Isolated from the South Platte River: 547
Evidence for the Presence of Nitrogenous Binding Sites. Environmental Science & 548
Technology. 37. 328-336. 549
Daughney C. J., Siciliano S. D., Rencz A. N., Lean D., and Fortin D. (2002) Hg(II) adsorption by 550
bacteria: A surface complexation model and its application to shallow acidic lakes and 551
wetlands in Kejimkujik National Park, Nova Scotia, Canada. Environmental Science & 552
Technology. 36. 1546-1553. 553
Dong W. M., Bian Y. R., Liang L. Y., and Gu B. H. (2011) Binding Constants of Mercury and 554
Dissolved Organic Matter Determined by a Modified Ion Exchange Technique. Environmental 555
Science & Technology. 45. 3576-3583. 556
Drexel R. T., Haitzer M., Ryan J. N., Aiken G. R., and Nagy K. L. (2002) Mercury(II) Sorption to 557
Two Florida Everglades Peats: Evidence for Strong and Weak Binding and Competition by 558
Dissolved Organic Matter Released from the Peat. Environmental Science & Technology. 36. 559
4058-4064. 560
Dunham-Cheatham S., Farrell B., Mishra B., Myneni S., and Fein J. B. The effect of chloride on 561
32
Ephraim J. H. (1992) Heterogeneity as a concept in the interpretation of metal ion binding by 563
humic substances. The binding of zinc by an aquatic fulvic acid. Analytica Chimica Acta. 267. 564
39-45. 565
Fein J. B., Boily J.-F., Yee N., Gorman-Lewis D., and Turner B. F. (2005) Potentiometric titrations 566
of Bacillus subtilis cells to low pH and a comparison of modeling approaches. Geochimica et 567
Cosmochimica Acta. 69. 1123-1132. 568
Fein, J.B., 2006. Thermodynamic modeling of metal adsorption onto bacterial cell walls: current 569
challenges. Adv. Agron. 90, 179–202. 570
Fortin D. and Beveridge T. J. (1997) Role of the bacterium Thiobacillus in the formation of 571
silicates in acidic mine tailings. Chemical Geology. 141. 235-250. 572
Guiné V., Spadini L., Sarret G., Muris M., Delolme C., Gaudet J. P., and Martins J. M. F. (2006) 573
Zinc sorption to three gram-negative bacteria: Combined titration, modeling, and EXAFS 574
study. Environmental Science & Technology. 40. 1806-1813. 575
Haitzer M., Aiken G. R., and Ryan J. N. (2002) Binding of Mercury(II) to Dissolved Organic 576
Matter: The Role of the Mercury-to-DOM Concentration Ratio. Environmental Science & 577
Technology. 36. 3564-3570. 578
Haitzer M., Aiken G. R., and Ryan J. N. (2003) Binding of Mercury(II) to Aquatic Humic 579
Substances: Influence of pH and Source of Humic Substances. Environmental Science & 580
Technology. 37. 2436-2441. 581
Harris, H. H., Pickering, I. J., George, G. N. (2003) The Chemical Form of Mercury in 582
Fish.Science. 301. 1203. 583
Hesterberg D., Chou J. W., Hutchison K. J., and Sayers D. E. (2001) Bonding of Hg(II) to Reduced 584
Organic Sulfur in Humic Acid as Affected by S/Hg Ratio. Environmental Science & 585
Technology. 35. 2741-2745. 586
Johnson K. J., Szymanowski J. E. S., Borrok D., Huynh T. Q., and Fein J. B. (2007) Proton and 587
metal adsorption onto bacterial consortia: Stability constants for metal-bacterial surface 588
complexes. Chemical Geology. 239. 13-26. 589
Kenney J. P. L. and Fein J. B. (2011) Cell wall reactivity of acidophilic and alkaliphilic bacteria 590
determined by potentiometric titrations and Cd adsorption experiments. Environmental 591
Science & Technology. 45. 4446-4452. 592
Loux, N. T. (1998) An assessment of mercury-species-dependent binding with natural organic 593
carbon. Chemical Speciation and Bioavailability. 10. 127-136. 594
Lovely, D.R. and Phillips, E.J.P. (1988) Novel mode of microbial energy metabolism: organic 595
carbon oxidation coupled to dissimilatory reduction of iron or manganese. Applied and 596
Environmental Microbiology. 54. 1472-1480. 597
Martell A. E. and Smith R. M. (2001) NIST Critically selected stability constants of metal 598
complexes, Version 6.0. NIST Standard Reference Database. 46. National Institute of 599
Standards and Technology. Gaithersburg, MD. 600
McDowell W. H. (2003) Dissolved organic matter in soils – future directions and unanswered 601
33
Mishra, B., Fein, J. B., Boyanov, M. I., Kelly, S. D., Kemner, K. M., Bunker, B. A. (2007) 603
Comparison of Cd Binding Mechanisms by Gram-Positive, Gram-Negative and Consortia of 604
Bacteria Using XAFS. AIP Conference proceeding. 882. 343-345. 605
Mishra B., Boyanov M. I., Bunker B. A., Kelly S. D., Kemner K. M., Nerenberg R., Read-Daily 606
B.L., and Fein J. B. (2009) An X-ray absorption spectroscopy study of Cd binding onto 607
bacterial consortia. Geochimica et Cosmochimica Acta. 73. 4311-4325. 608
Mishra B., Boyanov M., Bunker B. A., Kelly S. D., Kemner K. M., and Fein J. B. (2010) High- 609
and low-affinity binding sites for Cd on the bacterial cell walls of Bacillus subtilis and 610
Shewanella oneidensis. Geochimica et Cosmochimica Acta. 74. 4219-4233. 611
Mishra, B., O’Loughlin, E. J., Boyanov. M.B.,, Kemner, K. M. (2011) Binding of HgII to High-612
Affinity Sites on Bacteria Inhibits Reduction to Hg0 by Mixed FeII/III Phases. Environmental 613
Science & Technology. 45. 9597-9603. 614
Morra, M.J., Fendorf, S. E., Brown, P. D. (1997) Speciation of sulfur in humic and fulvic acids 615
using X-ray absorption near-edge structure (XANES) spectroscopy. Geochimica et 616
Cosmochimica Acta. 61. 683-688. 617
Muresan B., Pernet-Coudrier B., Cossa D., and Varrault G. (2011) Measurement and modeling of 618
mercury complexation by dissolved organic matter isolates from freshwater and effluents of a 619
major wastewater treatment plant. Applied Geochemistry. 26. 2057-2063. 620
Myneni, S. C. B. (2002) Soft X-ray spectroscopy and spectromicroscopy studies of organic 621
molecules in the environment. Reviews in Mineralogy and Geochemistry. 49. 485-579. 622
Pokrovsky O.S., Pokrovski G. S., Shirokova L.S., Gonzalez A. G., Emnova E. E., Feurtet-Mazel 623
A. (2012) Chemical and structural status of copper associated with oxygenic and anoxygenic 624
phototrophs and heterotrophs: possible evolutionary consequences. Geobiology. 10. 130-149. 625
Powell K. J., Brown P. L., Byrne R. H., Gajda T., Hefter G., Sjoberg S., and Wanner H. (2005) 626
Chemical speciation of environmentally significant heavy metals with inorganic ligands. Part 627
1: The Hg2+-Cl-, OH-, CO32-, SO42-, and PO43- aqueous systems. Pure and Applied Chemistry. 628
77. 739-800. 629
Ravel, B., Newville,M. (2005) ATHENA, ARTEMIS, HEPHAESTUS: Data analysis for X-ray 630
absorption spectroscopy using IFEFFIT. Journal of Synchrotron Radiation. 12. 537–541. 631
Ravichandran M., Aiken G. R., Ryan J. N., and Reddy M. M. (1999) Inhibition of precipitation 632
and aggregation of metacinnabar (mercuric sulfide) by dissolved organic matter isolated from 633
the Florida Everglades. Environmental Science & Technology. 33. 1418-1423. 634
Ravichandran M. (2004) Interactions between mercury and dissolved organic matter – a review. 635
Chemosphere. 55. 319-331. 636
Skyllberg U., Bloom P. R., Qian J., Lin C.-M., and Bleam W. F. (2006) Complexation of 637
Mercury(II) in Soil Organic Matter: EXAFS Evidence for Linear Two-Coordination with 638
Reduced Sulfur Groups. Environmental Science & Technology. 40. 4174-4180. 639
Segre, C. U., Leyarovsky, N. E., Chapman, L. D., Lavender, W. M., Plag, P. W., King, A. S., 640
Kropf, A. J., Bunker, B. A., Kemner, K. M., Dutta, P., Duran, R. S., Kaduk, J. (2000) The 641
34
Radiation Instrumentation: Eleventh U.S. National Conference; Pianetta, P., Ed.; American 643
Institute of Physics:NewYork, 419–422. 644
Song Z., Kenney J. P. L., Fein J. B., Bunker B. A. (2012) An X-Ray Absorption Fine Structure 645
study of Au adsorbed onto the non-metabolizing cells of two soil bacterial species. Geochimica 646
et Cosmochimica Acta. 86. 103-117. 647
Stern, E. A., Newville, M., Ravel, B., Yacoby, Y., Haskel, D. (1995) The UWXAFS analysis 648
package philosophy and details. Physica B. 209. 117–120. 649
Vairavamurthy, A. (1998) Using X-ray absorption to probe sulfur oxidation states in complex 650
molecules. Spectrochimica Acta Part A: Molecular and Biomolecular Spectroscopy. 54. 2009-651
2017. 652
Westall J. C. (1982) FITEQL, A computer program for determination of chemical equilibrium 653
constants from experimental data. Version 2.0. Report 82-02, Department of Chemistry, 654
Oregon State University, Corvallis, OR, USA. 655
Wightman P. G. and Fein J. B. (2001) Ternary interactions in a humic acid-Cd-bacteria system. 656
Chemical Geology. 180. 55-65. 657
Winfrey M. R. and Rudd J. W. M. (1990) Environmental factors affecting the formation of 658
methylmercury in low pH lakes. Environmental Toxicology and Chemistry. 9. 853-869. 659
Xia K., Skyllberg U. L., Bleam W. F., Bloom P. R., Nater E. A., and Helmke P. A. (1999) X-ray 660
Absorption Spectroscopic Evidence for the Complexation of Hg(II) by Reduced Sulfur in Soil 661
Humic Substances. Environmental Science & Technology. 33. 257-261. 662
Xia K., Weesner, F., Bleam W.F., Helmke P.A., Bloom P.R., Skyllberg U.L. (1998) XANES 663
Studies of Oxidation States of Sulfur in Aquatic and Soil Humic Substances. Soil Science 664
Society of America Journal. 62. 124-1246. 665
Yee N. and Fein J. B. (2001) Cd adsorption onto bacterial surfaces: A universal adsorption edge? 666