This is a repository copy of Impact of water vapour and carbon dioxide on surface composition of C3A polymorphs studied by X-ray photoelectron spectroscopy.
White Rose Research Online URL for this paper: http://eprints.whiterose.ac.uk/84269/
Version: Accepted Version
Article:
Dubina, E, Plank, J and Black, L (2015) Impact of water vapour and carbon dioxide on surface composition of C3A polymorphs studied by X-ray photoelectron spectroscopy. Cement and Concrete Research, 73. 36 - 41. ISSN 0008-8846
https://doi.org/10.1016/j.cemconres.2015.02.026
(c) 2015, Elsevier. Licensed under the Creative Commons Attribution-NonCommercial-NoDerivatives 4.0 International http://creativecommons.org/licenses/by-nc-nd/4.0/
eprints@whiterose.ac.uk https://eprints.whiterose.ac.uk/
Reuse
Unless indicated otherwise, fulltext items are protected by copyright with all rights reserved. The copyright exception in section 29 of the Copyright, Designs and Patents Act 1988 allows the making of a single copy solely for the purpose of non-commercial research or private study within the limits of fair dealing. The publisher or other rights-holder may allow further reproduction and re-use of this version - refer to the White Rose Research Online record for this item. Where records identify the publisher as the copyright holder, users can verify any specific terms of use on the publisher’s website.
Takedown
If you consider content in White Rose Research Online to be in breach of UK law, please notify us by
1 Date: 27.11.2014
1
2
Impact of Water Vapour and Carbon Dioxide on Surface Composition of
3
C3A Polymorphs Studied by X-Ray Photoelectron Spectroscopy
4
5
Dubina E. 1,Plank J.1, , Black L.2* 6
7
8
9
1
Technische Universität München, Lehrstuhl für Bauchemie, Lichtenbergstr. 4, 85747 10
Garching bei München, Germany 11
12
2
Institute for Resilient Infrastructure, School of Civil Engineering, University of Leeds, Leeds, 13
LS2 9JT, UK 14
15
16
17
18
19
20
Number of Words: 3,820 - main text only (without references) 21
Number of Figures: 7 22
Number of Tables: 4 23
24
25
2 26
Abstract 27
The surface specific analytical method, x-ray photoelectron spectroscopy (XPS), has been 28
used to study the effects of water vapour and CO2 on the cubic and orthorhombic polymorphs 29
of C3A. Significant differences between the two polymorphs were observed in the XPS 30
spectra. Upon exposure to water vapour, both polymorphs produced C4AH13 on their surfaces. 31
Additionally, the sodium-doped o-C3A developed NaOH and traces of C3AH6 on its surface. 32
Subsequent carbonation yielded mono carboaluminate on both polymorphs. Large amounts of 33
Na2CO3 also formed on the surface of o-C3A as a result of carbonation of NaOH. 34
Furthermore, the extent of carbonation was much more pronounced for o-C3Ao than for c-35
C3A. 36
37
106 Words 38
39
Key words: Ca3Al2O6 polymorphs (D), prehydration, carbonation (C), X-ray photoelectron 40
spectroscopy 41
42
43
44
45
46
47
48
49
50
3 1. Introduction
52
Tricalcium aluminate (C3A) constitutes ~ 2 – 12 wt. % of Portland cement clinker. In 53
industrial cement, C3A usually occurs as one of two polymorphs; cubic or orthorhombic. It is 54
well known that C3A can incorporate a large number of minor and trace elements into its 55
crystal structure [1 – 4]. The impact of these elements on the crystal structure as well as the 56
hydration behaviour and kinetics has been thoroughly discussed in previous works [5 – 9]. 57
58
Among those impurities, alkalis (K2O, Na2O) appear to be the most important modifying 59
oxides. These oxides are able to change the crystal system of C3A from cubic to orthorhombic 60
and to monoclinic [8], and sodium oxide plays a significant role in stabilising different 61
modifications of C3A. The structure of pure, undoped, cubic C3A has been determined by 62
Mondal and Jeffery. They also discussed the solid solutions of the Na2O-C3A series [10]. 63
Isomorphic substitution of calcium by sodium in solid solutions formed at 1250 oC leads to 64
crystallisation into the cubic polymorph at Na2O contents of 0 - 2.5 % (by mass), the 65
orthorhombic polymorph at 3.5 - 4.2 % Na2O, and the monoclinic polymorph at > 4.2 % 66
Na2O [11]. 67
68
C3A is the most reactive phase within cement clinker. In the absence of soluble sulphates, it 69
instantaneously forms massive amounts of hydration products, mainly calcium aluminate 70
hydrates (C-A-H phases of different stoichiometric compositions). Owing to this high 71
reactivity, C3A can react with atmospheric water vapour during storage; a phenomenon 72
known as prehydration of cement [8,12]. It has been demonstrated that, of all the cement 73
constituents, C3A reacts preferably with water vapour when cement is prehydrated [13], with 74
an impact on the eventual setting behaviour of the cement [14]. However, the cubic and 75
4 [8]. For orthorhombic C3A, the onset point at which water sorption starts to occur lies at 55 % 77
relative humidity (RH), compared to 80 % RH for cubic C3A [15]. 78
79
Prehydration is predominantly a surface reaction, hence common bulk analysis methods such 80
as x-ray diffraction are of limited value. Instead, surface specific analytical techniques, such 81
as X-ray photoelectron spectroscopy (XPS), may be used to provide information on the 82
composition and speciation of the prehydrated surface, without interference from the 83
unaffected bulk material [16]. In XPS, the sample is irradiated with x-rays in order to provoke 84
the photoelectric effect, with the energy of the emitted photoelectrons being characteristic of 85
the element from which they are emitted and the chemical state of the element. The low 86
energy of the photoelectrons ensures that only those emitted from the surface of the irradiated 87
sample are detected, Consequently, XPS allows the analysis of surface layers typically 1 to 10 88
nm thick, with all elements bar hydrogen being capable of identification [17]. 89
90
In the present study, the impact of initial exposure of C3A to moisture, followed by interaction 91
with atmospheric CO2, has been investigated by XPS. Furthermore, the influence of Na2O, 92
present in the orthorhombic modification of C3A, on these processes was studied. 93
94
2. Materials and Methods 95
2.1 Synthesis of C3A polymorphs 96
Pure, undoped cubic C3A and orthorhombic C3A doped with 4 wt. % Na2O weresynthesised 97
according to the literature [16], using calcium carbonate and aluminium oxide as starting 98
materials. Sodium nitrate was used as the Na2O source in the preparation of orthorhombic 99
C3A. The samples, sintered at 1450 °C for 4 hours, were removed from the oven, allowed to 100
cool in air for 3 minutes in covered Pt crucibles and then immediately placed in the cup of a 101
5 Germany). Grinding was performed in air at 250 rpm for 10 minutes at a temperature of 21 °C 103
without the addition of a grinding agent. The ground samples were stored in sealed 20 mL 104
glass bottles placed in a vacuum desiccator. 105
106
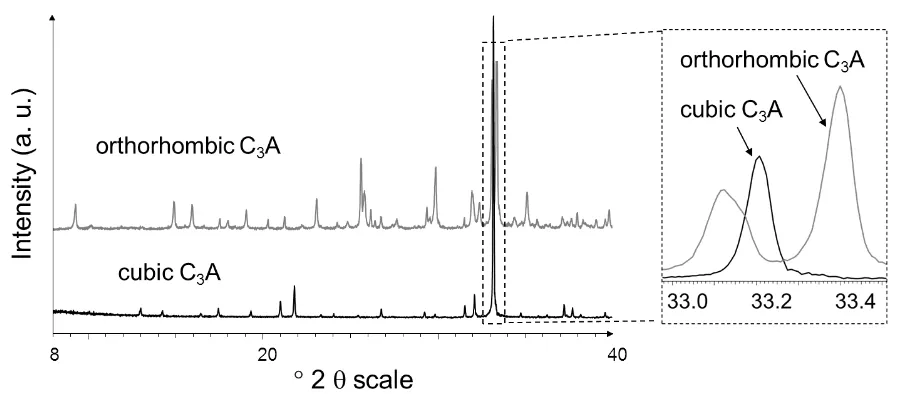
According to quantitative X-Ray diffraction (XRD) analysis of freshly prepared samples, the 107
C3A phases were 99 ± 0.5 wt. % pure. Their XRD patterns are presented in Figure 1. FTIR-108
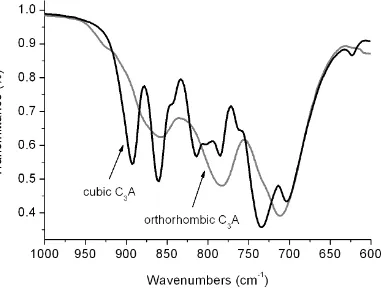
ATR spectra of the synthesised C3A samples further confirmed their phase purity. Figure 2 109
shows the characteristic differences between the two polymorphs: with a reduction in the 110
number of IR bands for orthorhombic C3A, as a result of altered symmetry of the Al6O18 ring 111
(C3 Ci). Furthermore, partial substitution of Ca2+ by Na+ induces disorder in the structure 112
and thus broadening of the bands [2]. 113
114
115
Fig. 1. XRD patterns of cubic and orthorhombic C3A phases as prepared, shown over the 116
[image:6.595.72.521.396.593.2]6 118
Fig. 2. FTIR-ATR spectra of cubic and orthorhombic C3A phases as prepared, shown over the 119
range 600 – 1000 cm-1 120
121
The surface of orthorhombic C3A was investigated by scanning electron microscopy (SEM) 122
using a FEI XL 30 FEG microscope equipped with a large field detector under low vacuum 123
conditions (1 mbar H2O pressure, corresponding to ~ 4 % RH at room temperature). 124
125
2.2 Water and CO2 exposure of samples 126
200 mg of powdered C3A were pressed into pellets (d = 13 mm) at a pressure of 50 N/mm2 127
using a hydraulic press. The pellets of cubic and orthorhombic C3A were then refired at 128
1350 °C for 3 h (c-C3A) or 20 minutes (o-C3A) to achieve complete dehydration and 129
decarbonation. 130
131
However, preliminary XPS analysis of the C3A pellets still showed evidence of slight 132
7 ion bombardment under vacuum in the spectrometer, prior to any exposure to water vapour 134
and CO2. 135
136
Each sample was cleaned by ion bombardment in the spectrometer and then subjected to three 137
different exposure cycles. Pellets were placed in a nitrogen gas filled desiccator which was 138
placed in a glove box. The relative humidity over the samples was adjusted to 85 % using a 139
saturated potassium chloride solution within the desiccator [18]. Samples were initially 140
exposed for 4 hours, and then analysed. Subsequently, the same sample was prehydrated 141
under the same conditions for a further 8 hours before the second analysis. The third and final 142
cycle exposed the previously prehydrated sample to atmospheric conditions, i.e. ambient air 143
containing CO2, for a further 12 hours. Throughout the rest of the manuscript samples are 144
identified as; 0h, 4h, 12h and 24c, where h and c indicate exposure to humidity or CO2 145
respectively and the number indicates the duration of exposure. 146
147
2.3 XPS analysis 148
Each pellet was stuck onto a double-sided adhesive copper tape and inserted into the vacuum 149
chamber for analysis. The samples were analysed using a SCIENTA ESCA 300 photoelectron 150
spectrometer (located at the National Centre for Electron Spectroscopy and Surface Analysis, 151
NCESS, Daresbury, UK) fitted with a high power rotating anode (8 kW) and a 152
monochromatic Al K (hv = 1486.7 eV) X-ray source. The X-ray beam was focused on a 153
6 mm × 0.5 mm area on the sample via a large, seven crystal double focusing 154
monochromator. The Al K line profile had a FWHM (full width at half maximum) energy 155
width of 0.26 eV. The detection system consisted of a 300 mm radius hemispherical analyser 156
and a multi-channel detector. The system was operated with 0.8 mm slits and 150 eV pass 157
8 samples were often extremely good electrical insulators, a flood gun was used to compensate 159
for sample charging. 160
161
Following an initial survey scan, high resolution spectra were recorded for the elements of 162
interest: Na 1s, Ca 2p, O 1s, C 1s, Al 2p. Derived sensitivity factors were applied to convert 163
signal intensities to atomic compositions [19]. 164
165
Data were extracted from the spectra via peak fitting using CasaXPS software. A Shirley 166
background was assumed in all cases. Spectra were corrected for charging effects using the 167
adventitious hydrocarbon peak at 284.8 eV binding energy (BE). This peak is ubiquitous due 168
to carbon contamination from the vacuum systems [20]. The presence of inorganic carbon, as 169
carbonate, was always looked for in high-resolution scans. 170
171
3. Results and discussion 172
3.1 XPS analysis of fresh C3A polymorphs 173
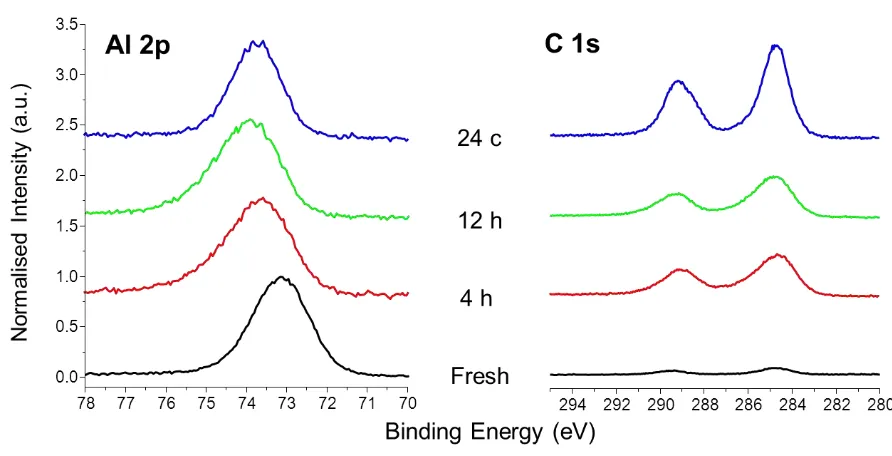
Figures 3 and 4 show the Al 2p and C 1s XPS spectra obtained from both polymorphs after 174
each exposure. The corresponding binding energies and elemental ratios are tabulated in 175
Tables 1 – 4. Note that, for simplicity, quantification assumed that samples were 176
homogeneous with respect to depth. 177
9 179
Fig. 3 XPS spectra of non-doped, cubic C3A sample, fresh and aged, showing the evolution of 180
the Al 2p (left) and C 1s (right) peaks upon exposure to water vapour and subsequent 181
carbonation 182
183
184
Fig. 4 XPS spectra of Na-doped orthorhombic C3A sample, fresh and aged, showing the 185
evolution of the Al 2p (left) and C 1s (right) peaks upon exposure to water vapour and 186
subsequent carbonation 187
[image:10.595.72.518.423.651.2]10 Table 1 Binding energies of fresh and aged cubic C3A, as obtained by XPS
189
Element Binding energy (eV)* after exposure period/mode
0 h (fresh) 4 h 12 h 24 c
Ca 2p2/3 346.4 347.1 347.2 347.2
O 1s 529.7 531.2 531.3 531.3
531.4 531.7 531.7 531.7
Al 2p 72.9 73.5 73.7 73.8
73.5 74.1 74.3 74.7
C 1s 289.7 289.7 289.7 289.6
* Shifts relative to C 1s = 284.8 eV 190
191
Table 2 Element ratios and chemical shifts of fresh and aged cubic C3A, as obtained from 192
XPS analysis 193
El. ratios Element ratios and chemical shifts (eV)* after exposure period/mode
0 h (fresh) 4 h 12 h 24 c
Ca/Al* 1.5 1.47 1.48 1.47
C/Ca 0.07 0.17 0.19 0.3
Ca - Al 273.4 273.4 273.3 273.4
Ca - C 56.8 57.4 57.5 57.6
*: Values represent normalized ratios based on the assumption that etched sample possesses the 194
ideal composition Ca3Al2O6. 195
[image:11.595.62.479.411.540.2]196
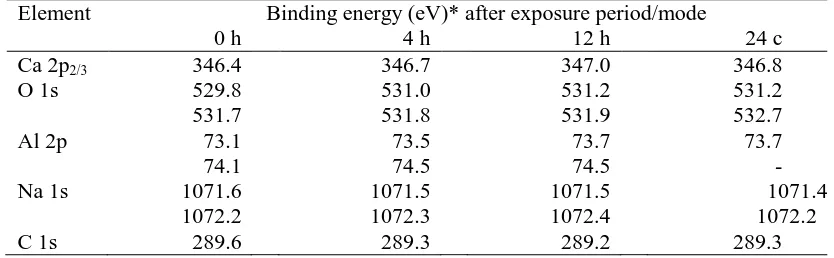
Table 3 Binding energies of fresh and aged orthorhombic C3A derived from XPS analysis 197
Element Binding energy (eV)* after exposure period/mode
0 h 4 h 12 h 24 c
Ca 2p2/3 346.4 346.7 347.0 346.8
O 1s 529.8 531.0 531.2 531.2
531.7 531.8 531.9 532.7
Al 2p 73.1 73.5 73.7 73.7
Na 1s 74.1 1071.6 1072.2 74.5 1071.5 1072.3 74.5 1071.5 1072.4 - 1071.4 1072.2
C 1s 289.6 289.3 289.2 289.3
* Shifts relative to C 1s = 284.8 eV 198
[image:11.595.65.475.608.727.2]199
Table 4 Element ratios and chemical shifts of fresh and aged orthorhombic C3A, as obtained 200
from XPS analysis 201
El. ratios Element ratios and chemical shifts (eV)* after exposure period /mode
0 h (fresh) 4 h 12 h 24 c
Ca/Al* 1.42 2.05 2.01 1.98
Na/Ca* 0.12 0.55 0.91 2.94
C/Ca 0.04 0.22 0.20 0.83
Na/C 0.47 0.43 0.78 0.75
Ca - Al 273.3 272.9 273.0 273.0
Ca - C 56.9 57.6 57.6 57.7
Na - C 782.2 782.4 782.5 782.3
*: Values represent normalized ratios based on the assumption that etched sample has the ideal 202
composition Ca8.5NaAl6O18. 203
11 205
The Al 2p spectra for the fresh phases were slightly asymmetrical, due to spin orbit coupling 206
of the Al 2p lines, with the undoped, more calcium-rich, cubic C3A having a slightly lower 207
binding energy than orthorhombic C3A (Figures 3 and 4). The Al 2p spectra for the fresh 208
samples show two contributions, namely at ~ 72.9 and 73.5 eV for the cubic and at ~ 73.1 and 209
74.0 eV for the orthorhombic C3A polymorph (Tables 1 and 3). The spectra reported here for 210
cubic C3A are very similar to the binding energy of 73.1 eV reported by Ball et al. [21]. 211
Aluminium binding energies are dependent upon the coordination number [22,23]. In both 212
C3A modifications, Al is always tetrahedrally coordinated and occurs as AlO4. Six such 213
tetrahedra form an Al6O1818- ring in orthorhombic C3A which becomes deformed upon 214
replacement of Ca2+ by the slightly less electronegative Na+ in the centre of the Al6O1818- ring 215
[24]. Thus, the slight changes in binding energy from cubic to orthorhombic C3A may be due 216
to the symmetry change (C3 Ci) or a change in electronegativity caused by the 217
incorporation of Na2O into doped C3A. 218
219
The Ca 2p binding energies for both fresh polymorphs were the same and in good agreement 220
with the value of 346.3 eV obtained by Ball et al. [21]. Unlike the Al 2p spectra, Ca 2p 221
binding energies are less sensitive to changes in composition, e.g. in both calcium aluminate 222
hydrate [21] and calcium silicate hydrate [21, 22] systems. Consequently, spectra would not 223
be expected to change upon replacement of calcium by sodium. 224
225
In addition to the binding energies, changes in the Ca 2p – Al 2p energy separation ( Ca-Al) 226
were determined (Tables 2 and 4). In previous studies on calcium silicate hydrates, these 227
values have been shown to provide valuable information related to changes in their chemical 228
structure, in particular the degree of silicate polymerisation in calcium silicate hydrates 229
12 samples. Here, the incorporation of sodium into the C3A lattice, with the conversion from 231
cubic to orthorhombic, did not induce changes in polymerisation, but there was a slight 232
reduction in Ca-Al from 273.4 to 273.2 eV, likely as a result of the reduced electronegativity 233
of sodium compared to calcium. 234
235
3.2 Exposure to water vapour and CO2 236
In a previous investigation, there was a distinct difference between the XPS spectra of the 237
surfaces of cubic and orthorhombic C3A prehydrated in moist air (85 % RH, and including 238
CO2) for just 1 h [21]. In this study emphasis has been placed on separation of the effects 239
caused by water vapour and carbon dioxide. 240
241
Prehydration under water vapour only (no CO2 present) was slower than in the previous study 242
where prehydration was performed in moist, CO2-containing air. Nonetheless, exposure to 243
water vapour led to spectral changes and shift to higher Al 2p binding energies (Figures 3 244
and 4). Furthermore, the Al 2p spectra broadened upon prehydration and two peaks were 245
required to fit them, signifying a change in the chemical environment of Al, plausibly due to 246
formation of C-A-H phases. An Al 2p binding energy of 73.8 eV has previously been reported 247
for pure C4AH13 [16]. Here, after exposure of both C3A polymorphs to water vapour for 12 h, 248
a peak could be fitted at ~ 73.7 eV, likely indicative of C4AH13 formation. The second peak in 249
the Al 2p spectra was centred at ~ 74.3 eV for the cubic and at ~ 74.5 eV for the orthorhombic 250
modification. These peaks might be attributable to C3AH6 (katoite), as was found by a 251
combination of XRD and XPS in the aforementioned previous study [16]. 252
253
Upon exposure to air, i.e. upon carbonation, the Al 2p spectra of both polymorphs showed 254
further changes, with formation of carbonate observed in the C 1s spectra, as indicated by a 255
13 For the cubic modification, the relative peak areas of the Ca 2p and C 1s spectra (Ca 2p 257
spectra not shown here) suggest a C/Ca ratio of 0.3 (Table 2), indicating the formation of 258
calcium monocarboaluminate (3 CaO ∙ Al2O3∙ CaCO3∙ 11 H2O). This is in agreement with 259
the bulk carbonation behaviour of C3A pastes, as analysed by Raman spectroscopy [26]. The 260
mechanism of the monocarboaluminate formation is based on the reaction of CO2 with C4AHx 261
phases which possesses a disordered layered structure. In this process, the interlayer OH- is 262
replaced by CO32- [27]. The ion exchange stabilises the layered structure and results in 263
shrinkage of the basal spacing from 1.08 nm in C4AH13 to 0.76 nm for the carbonated species 264
[28]. 265
266
Carbonation of orthorhombic C3A was more extensive than for the cubic modification. 267
Sample 24c revealed a C/Ca ratio of 0.8 (Table 4). This ratio was too high to be explained 268
solely by calcium monocarboaluminate formation, and indicated the presence of another 269
carbonate species. 270
271
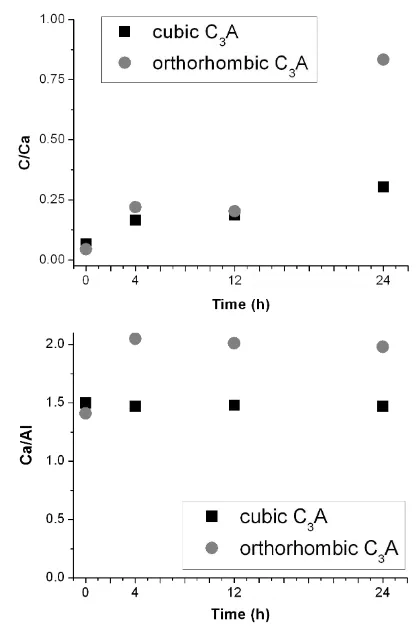
Figure 5 shows the changes in C/Ca and Ca/Al ratios with exposure for both C3A 272
modifications. While there was no change in the Ca/Al ratio of the cubic C3A, exposure to 273
water vapour led to an increase in Ca/Al ratio for orthorhombic C3A. We ascribe this to an 274
increase in the surface pH due to surface enrichment in sodium upon prehydration (see 275
below). Such conditions would accelerate the formation of C4AHx phases, as observed 276
previously [16]. This may also explain the lower relative humidity threshold above which 277
orthorhombic C3A begins to prehydrate compared to cubic C3A [8,15,16]. 278
14 280
[image:15.595.56.472.60.691.2]281
Fig. 5 Normalised ratios of C/Ca (a) and Ca/Al ratios (b) occurring on the surfaces of cubic 282
and orthorhombic C3A as a function of ageing period and mode, as measured by XPS 283
15 3.3 Impact of Na2O doping
285
The high resolution Na 1s spectra revealed how the presence of sodium affected the reactivity 286
of orthorhombic C3A, and spectra plus the calculated Na/Ca ratios are shown in Fig. 6. The 287
freshly calcined sample exhibited a Na 1s signal comprising of two signals; the main one 288
centred at ~ 1071.5 eV and a second minor peak at ~ 1072.2 eV. No definitive assignment 289
could be made for the major peak, but we assume it to be due to sodium substituted for 290
calcium within the C3A, while the second peak is of a similar binding energy to the value of 291
1072.3 eV reported for pure Na2O and NaOH [29,30]. 292
293
Exposure to water vapour only led to a gradual increase in the intensity of the signal centred 294
at ~ 1072.2 eV; indicating that less and less sodium was bound within the crystal structure of 295
orthorhombic C3A, with the increased intensity due to mobilisation of sodium and its 296
migration to the sample surface. This finding agrees with results from Glasser et al. who 297
observed that Na+ can dissolve into the aqueous phase more rapidly than Ca2+ or Al3+ [5]. 298
Upon abstraction from the crystal structure, sodium appears to combine with water to form 299
NaOH on the surface, with a binding energy of 1072.2 eV characteristic of NaOH [29]. 300
301
Exposure to CO2 within ambient air led to further changes in the Na 1s spectra, namely a 302
large growth in intensity and a slight shift back to lower binding energies, with the signal 303
centred at 1071.3 eV. Such binding energy may correspond to either Na2CO3 or NaHCO3, 304
both of which produce a peak at 1071.3 eV [29]. This finding suggests that the initially 305
formed NaOH then carbonated to form Na2CO3 or NaHCO3, which constitutes the main 306
product from the prehydration and carbonation process. The formation of this phase also helps 307
to explain the high C/Ca ratio reported above. 308
16
310
311
[image:17.595.57.473.74.708.2]312
Fig. 6 Na 1s XPS spectra of fresh and aged orthorhombic C3A samples (a) and Na/Ca ratios 313
after exposure of orthorhombic C3Asample to moisture and CO2 in air (b) 314
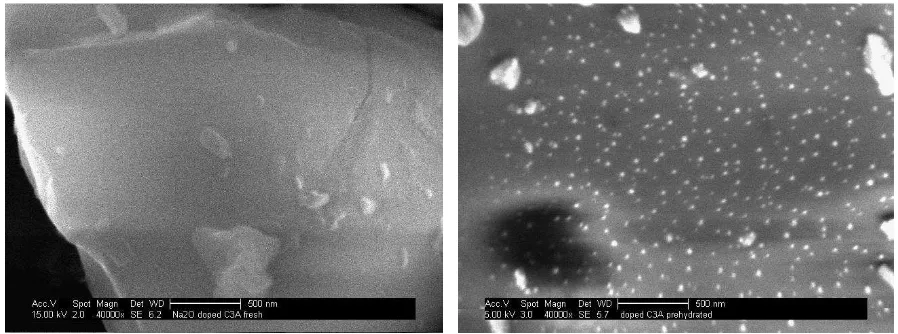
17 The formation of Na2CO3 or NaHCO3 on the surface of o-C3A was confirmed by SEM 316
imaging (Fig. 7). Bright crystalline specks were visible on the surface of sample 24c, which 317
EDX spectroscopy indicated as comprising of sodium, carbon and oxygen, presumably of 318
Na2CO3 or NaHCO3. 319
320
[image:18.595.70.519.207.374.2]321
Fig. 7 SEM images of the surfaces of a) 0h (fresh) and b) 24c (prehydrated and carbonated) 322
orthorhombic C3A, showing Na2CO3 or NaHCO3 crystals on the prehydrated sample. 323
324
4. Conclusions 325
X-ray photoelectron spectroscopy has been used to follow the interactions of cubic and 326
orthorhombic C3A polymorphs with environmental moisture and CO2 under defined storage 327
conditions. 328
329
In the XPS spectra, clear differences were observed for cubic and orthorhombic C3A after 330
prehydration with water vapour and subsequent carbonation in air. During prehydration in the 331
absence of CO2,both C3A polymorphs showed the formation of C4AH13 on their surfaces, but 332
the extent was more pronounced for the orthorhombic polymorph. Surface enrichment of 333
sodium, in the form of sodium hydroxide, was observed after prehydration of orthorhombic 334
C3A which was doped with 4 wt. % of Na2O. The increased pH induced by the formation of 335
18 reported previously [21]. It may also explain why the effects of prehydration become evident 337
at 55% RH for orthorhombic C3A, but at 80% RH for cubic C3A [8,16]. 338
339
Additionally, the impact of sodium on carbonation of orthorhombic C3A was studied. 340
Prehydrated cubic C3A produced monocarboaluminate (3 CaO∙Al2O3∙CaCO3∙11H2O) on its 341
surface, while carbonation of orthorhombic C3A resulted in formation of the same phase, 342
together with extensive Na2CO3 or NaHCO3 formation. The reason for the latter is the high 343
amount of NaOH formed after the initial prehydration at the surface of orthorhombic C3A. 344
345
Acknowledgments 346
E. Dubina is grateful to Nanocem (Core Project # 7) for financial support of this work. The 347
authors also like to acknowledge the support from EPSRC (grant reference EP/E025722/1) for 348
supporting this work through the Daresbury NCESS Facility. They also want to thank Dr. 349
Danny Law for his support at NCESS. Additionally, Dr. Holger König and Dr. Maciej Zajac, 350
both from HeidelbergCement, Leimen, Germany are thanked for their input during many 351
discussions. 352
353
References 354
[1] H. F. W. Taylor, Cement Chemistry, Academic Press, London, 1990. 355
[2] A. I. Boikova, A. I. Domansky, V. A. Paramonova, G. P. Stavitskaja and V. M. 356
Nikuschenko, “The influence of Na2O on the structure and properties of 3CaO·Al2O3”, 357
Cem. Concr. Res. 7, 1977, 483 – 492. 358
[3] L. Gobbo, L. Sant'Agostino, L. Garcez, “C3A polymorphs related to industrial clinker 359
19 [4] D. Stephan, H. Maleki, D. Knöfel, B. Eber, R. Härdtl, Influence of Cr, Ni, and Zn on the 361
properties of pure clinker phases: Part II. C3A and C4AF, Cem. Concr. Res. 29, 1999, 651 362
– 657. 363
[5] F. P. Glasser, M. B. Marinho, “Early stages of the hydration of tricalcium aluminate and 364
its sodium containing solid solutions”, Br. Ceram. Proc. 35, 1984, 221 – 236. 365
[6] S. Wistuba, D. Stephan, G. Raudaschl-Sieber, J. Plank, "Hydration and hydration products 366
of two-phase Portland cement clinker doped with Na2O", Adv. Cem. Res. 19, 2007, 125 – 367
131. 368
[7] A. P. Kirchheim, V. Fernàndez-Altable, P. J. M. Monteiro, D. C. C. Dal Molin, “Analysis 369
of cubic and orthorhombic C3A hydration in presence of gypsum and lime”, J. Mater. Sci. 370
44, 2009, 2038 – 2045. 371
[8] E. Dubina, J. Plank, L. Black and L. Wadso, Impact of environmental moisture on C3A 372
polymorphs in the absence and presence of CaSO4.0.5 H2O, Adv. Cem. Res., 26(1), 29-40 373
[9] H. Pöllmann, Composition of cement phases. In Structure and Performance of Cements 374
(BENSTED J. and BARNES P. (eds.)). Spon Press, London, 2002, 25 – 56. 375
[10] P. Mondal, and J.W. Jeffery, "The crystal structure of tricalcium aluminate Ca3Al2O6”, 376
Acta Cryst. B 31, 1975, 689 – 697. 377
[11] C. Ostrowski, J. elazny, “Solid Solutions of Calcium Aluminates C3A, C12A7 and CA 378
with Sodium Oxide”, J. Therm. Anal. Calorim., 75 (3), 2004, 867 – 885. 379
[12] E. Breval, “Gas-phase and liquid-phase hydration of C3A”, Cem. Concr. Res. 7, 1977, 380
297 – 304. 381
[13] K. Theisen, V. Johansen, “Prehydration and strength development of Portland cement”, 382
J. Am. Cer. Soc., 54 (9), 1975, 787 – 791. 383
[14] M. Whittaker, E Dubina, F Al-Mutawa, L Arkless, J Plank and L Black, “The effect of 384
prehydration on the engineering properties of CEM I Portland cement”, Adv. Cem. Res.. 385
20 [15] E. Dubina, L. Wadsö, J. Plank, “A sorption balance study of water vapour sorption on 387
anhydrous cement minerals and cement constituents”, Cem. Concr. Res. 41, 2011, 1196 – 388
1204. 389
[16] E. Dubina, L. Black, R. Sieber, J. Plank, “Interaction of water vapour with anhydrous 390
cement minerals”, Adv. Appl. Ceram., 109 (5), 2010, 260 – 268. 391
[17]J. T. Grant and D. Briggs “Surface Analysis by Auger and X-ray Photoelectron 392
Spectroscopy”, published by IM Publications, 2003, Chichester, UK. 393
[18] L. Greenspan, “Humidity Fixed Points of Binary Saturated Aqueous Solutions”, J. Res. 394
Nat. Bur., 8 (1), 1977, 89 – 95. 395
[19] C. D. Wagner, L. E. Davis, M. V. Zeller, J. A. Taylor, R. H. Raymond, L. H. Gale, 396
“Empirical atomic sensitivity factors for quantitative analysis by electron spectroscopy 397
for chemical analysis”, Surf. Interface Anal., 3 (5), 1981, 211 – 225. 398
[20] L. Black, K. Garbev, I. Gee, “Surface carbonation of synthetic C-S-H samples: A 399
comparison between fresh and aged C-S-H using X-ray photoelectron spectroscopy”, 400
Cem. Concr. Res., 38, 2008, 745 – 750. 401
[21] M. C. Ball, R. E. Simmons and I. Sutherland, “Surface composition of anhydrous 402
tricalcium aluminate and calcium aluminoferrite”, J. Mater. Sci., 22, 1987, 1975 – 1979. 403
[22] T. L. Barr, S. Seal, K. Wozniak, J. Klinowski, “ESCA studies of the coordination state of 404
aluminium in oxide environments”, J. Chem. Soc., Faraday Trans., 93, 1997, 181 – 186. 405
[23] L. Black, A. Stumm, K. Garbev, P. Stemmermann, K. R. Hallam, G. C. Allen, “X-ray 406
Photoelectron Spectroscopy of Aluminium-Substituted Tobermorite”, Cem. Conc. Res. , 407
35 (1), 2005, 51-55. 408
[24] Y. Takeuchi, F. Nishi, I. Maki, “Crystal-chemical characterization of the tricalcium 409
aluminate-sodium oxide (3CaO x Al2O3-Na2O) solid solution series”, Z. Kristallogr. 152 410
21 [25] L. Black, K. Garbev, G. Beuchle, P. Stemmermann, D. Schild, “X-ray photoelectron 412
spectroscopic investigation of nanocrystalline calcium silicate hydrates synthesised by 413
reactive milling”, Cem. Concr. Res., 36, 2006, 1023 – 1031. 414
[26] L. Black, C. Breen, J. Yarwood, J. Phipps and G. Maitland, “In situ Raman analysis of 415
hydrating C3A and C4AF pastes in presence and absence of sulphate”, Adv. Appl. Ceram., 416
2006, 105, 209 – 216. 417
[27] R. Fischer, H.J. Kuzel, “Reinvestigation of the system C4A ∙ nH2O – C4A ∙ CO2∙ nH2O” 418
Cem. Concr. Res., 12, 1982, 517 – 526. 419
[28] R. Gabrovšek, T. Vuk, V. Kaučič, “The Preparation and Thermal Behavior of Calcium 420
Monocarboaluminate”, Acta Chim. Slov., 55, 2008, 942 – 950. 421
[29] J. F. Moulder, W.F. Stickle, P.E. Sobol, K.D. Bomben, in: J. Chastain (Ed.), Handbook 422
of X-Ray Photoelectron Spectra – A Reference Book of Standard Spectra for 423
Identification and Interpretation of XPS Data, Perkin-Elmer, Eden Prairie, Minnesota, 424
1992, p. 229. 425
[30] R. A. Zarate, S. Fuentes, J. P. Wiff, V. M. Fuenzalida, A. L. Cabrera, “Chemical 426
composition and phase identification of sodium titanate nanostructures grown from titania 427