This is a repository copy of Assessment of laser cladding as an option for repairing/enhancing rails.
White Rose Research Online URL for this paper: http://eprints.whiterose.ac.uk/88833/
Version: Accepted Version
Article:
Lewis, S.R., Lewis, R. and Fletcher, D.I. (2015) Assessment of laser cladding as an option for repairing/enhancing rails. Wear , 330. 581 - 591. ISSN 0043-1648
https://doi.org/10.1016/j.wear.2015.02.027
eprints@whiterose.ac.uk https://eprints.whiterose.ac.uk/
Reuse
Unless indicated otherwise, fulltext items are protected by copyright with all rights reserved. The copyright exception in section 29 of the Copyright, Designs and Patents Act 1988 allows the making of a single copy solely for the purpose of non-commercial research or private study within the limits of fair dealing. The publisher or other rights-holder may allow further reproduction and re-use of this version - refer to the White Rose Research Online record for this item. Where records identify the publisher as the copyright holder, users can verify any specific terms of use on the publisher’s website.
Takedown
If you consider content in White Rose Research Online to be in breach of UK law, please notify us by
1 ASSESSMENT OF LASER CLADDING AS AN OPTION FOR REPAIRING/ENHANCING RAILS
S.R. Lewisα, R. Lewis, D.I. Fletcher
Department of Mechanical Engineering, The University of Sheffield, Mappin Street, Sheffield, S1 3JD, UK
2
samples showed high resistance to plastic deformation and hence crack nucleation at their surface.
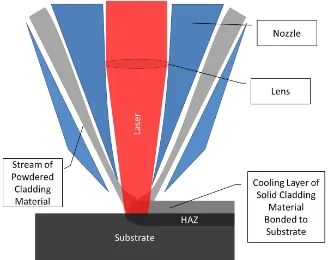
One‐step laser cladding by powder injection is the most widely adopted technique [1]. In this process a high energy laser is passed over the surface of the substrate material while a cladding material is added. The surface of the substrate and the coating material are melted by the laser subsequently welding them together.
[image:3.595.54.382.173.433.2]
Figure 1 Schematic of one‐step laser cladding process
3
laser power and powder feed rate and their effects can be found in [1]. Current technology allows layers in the region of 0.5 – 2 mm to be created. Thicker layers can be created by re‐cladding on top of pre‐deposited layers. As the first layer of cladding is deposited it will mix with some of the substrate material. One advantage of building multiple layers on top of previous ones is that less of the substrate material will be present in consecutive layers. Layer or overall cladding thickness is also important when considering where peak sub‐surface contact stresses may occur.
Currently laser cladding is used in the oil and gas [3, 4], mining [5, 6], nuclear [7, 8] and security industries. Components in these industries, particularly mining, are subject to very aggressive operating conditions which lead to high wear rates. Components such as excavator teeth and drilling equipment are repaired using laser cladding and put straight back into service. This has enormous cost benefits for such industries as whole components might have otherwise been replaced.
Laser cladding has already been proposed as a potential method for improving the performance of railway wheels [1, 2]. The advantage of laser cladding is that premium metals and alloys with better mechanical and tribological properties can be clad on top of the original substrate material. A number of candidate materials, namely Hadfield, Stellite 6, Maraging and 316 Stainless Steels were laser clad onto standard 260 grade rail steel and the anticipated improvement in performance quantified via small scale twin‐disk testing to generate representative wear and RCF data.
2.0 Test Methodology
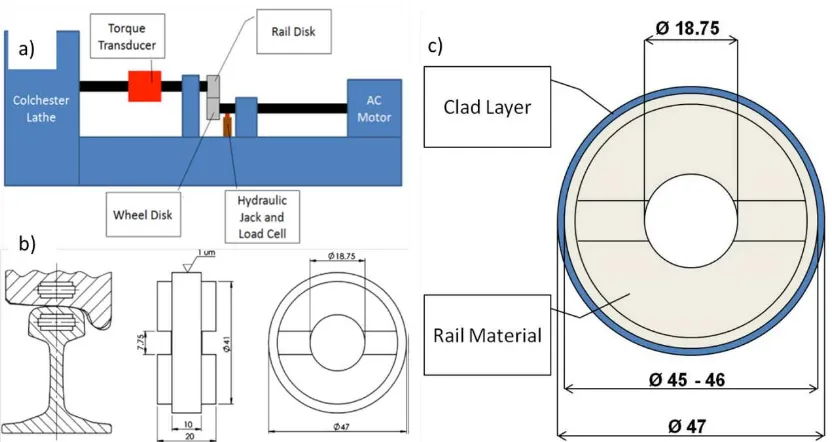
This study was carried out using The Sheffield University Rolling Sliding (SUROS) rig [1]. Figure 2 shows a schematic of the SUROS rig and typical discs used. For these tests the lathe was run at 400 rpm with 1% creep in the contact and contact load of 7.14 kN which gives a maximum contact pressure of 1500 MPa when applied to a 260 grade rail disc. These are standard wear and RCF settings for SUROS testing [9].
Four different types of material were used for cladding 260 grade rail steel discs: Hadfield Steel, Stellite 6 Steel, Maraging Steel and 316 Stainless Steel each with 1 and 2 layer samples. An un‐clad 260 grade rail disc was also tested to give a baseline.
4
Figure 2 a) Schematic of SUROS rig b) Extraction and dimensions of SUROS specimens c) Schematic of laser clad SUROS specimen. All dimensions in mm.
Each SUROS specimen was purposely manufactured undersized to a diameter of either 45 or 46 mm. The clad layer then restored the specimen to a diameter of 47 mm. Clad layers are typically laid in 1 mm thicknesses. Thus the 45 mm discs had 2 layers of clad material and the 46 mm discs had 1 clad layer. Figure 2c) shows a schematic of a laser clad SUROS specimen.
The specimens were cleaned and weighed before and after each test to monitor material lost through wear. Surface roughness was also measured before and after each test.
Two types of test were carried out; one to investigate friction and wear and one for RCF. The wear tests consisted of 5000 dry cycles and 5000 wet cycles. This approach was used in the INNOTRACK (an FP6 Integrated Project involving multiple partners from industry and academia funded by the European Commission) work which compared crack propagation and wear of high performance rail materials [10] and was chosen for these tests for comparison purposes. This showed the friction and wear characteristics in both dry and wet conditions. Information such as crack length and density (if present) could also be obtained by sectioning the discs after the wear tests.
[image:5.595.57.473.55.276.2]
5
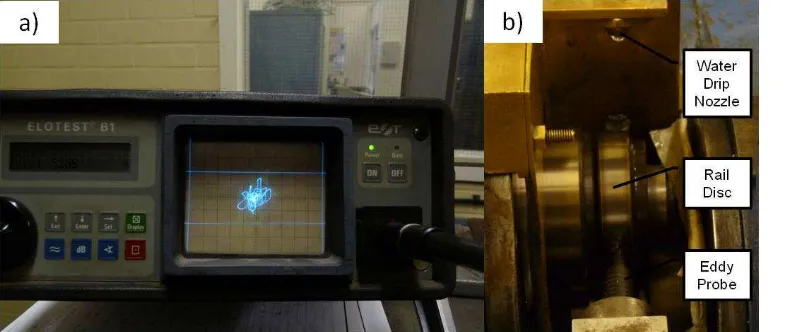
For the RCF tests an Ellotest B1 Eddy Current Crack detector was used. A differential eddy current probe was connected to the detector unit and held 0.3mm from the surface of the rail disc. An RCF failure definition was set using a calibration disc with wire eroded reference cracks in its surface as used in [14]. As the calibration disc was rotated in front of the eddy current probe a signal of fixed size was displayed on the detector screen. The size of this reference signal was used to define the point where the RCF cracks in the test specimens were of sufficient length for failure to be defined see Figure 3.
Circulating eddy currents can be induced in any electrically conducive material and magnetic material when in close proximity to a wire coil which itself is subject to an alternating current, due to fluctuations in the magnetic field surrounding the coil. These undisturbed eddy currents in turn will affect the impedance of the coil and hence the voltage across it. If a flaw in the conducting material (such as a crack) disturbs the eddy currents this will change the amount which the impedance in the coil is affected. Hence monitoring the voltage across the coil can indicate the presence of a crack [14].
[image:6.595.57.455.293.459.2]
Figure 3 a) Picture of Eddy Current Crack Detector b) Differential eddy current probe offset 0.3mm from rail disc surface.
Post‐test analysis of the discs was done by sectioning, polishing and etching the rail discs. This was done in order to observe cracks, material flow and the bond between the clad and substrate. The samples were placed in the SUROS machine and scanned with the eddy current probe while being turned by hand so that cracked sections could be located. Once a cracked section was located it was cut from the sample using an abradable cutting wheel. The extracted section was then mounted in Bakelite. The etched samples were examined with an optical microscope to observe grain deformation and the cladding/substrate interface. The samples were then re‐polished so that cracking could be more easily observed and micro‐hardness measurements could be taken.
It should be noted that Hadfield Steel is non‐magnetic and therefore theses samples were not measured with the eddy‐current probe during the RCF tests. It was decided thus that the RCF Hadfield samples should be run for 50,000 cycles so that they could be directly compared with the other RCF samples during the post‐test analysis.
A decision was taken given the time and resource constraints to explore a wide variation of parameters in this work rather than build more confidence by having repeat test at each condition.
6 3.0 Results
3.1 Wear Tests
The purpose of the wear tests was to characterise the traction and wear properties of the laser clad samples under dry and wet conditions.
3.1.1 Traction Coefficients
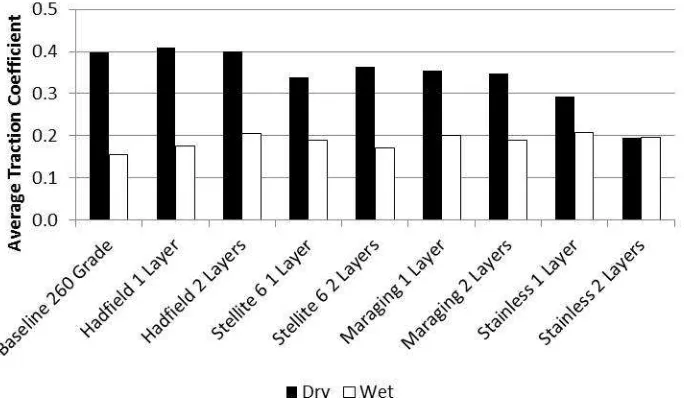
Mean traction coefficients yielded from the wear tests can be seen in Figure 4.
[image:7.595.69.411.195.394.2]
Figure 4 Average traction coefficients yielded during the friction tests.
Figure 4 shows that the Hadfield samples gave traction coefficients of 0.4. This was the same as the 260 grade baseline. All other samples were below this value the highest of these being Maraging with an average traction coefficient of 0.36. Stellite gave an average of 0.35. Stainless steel showed the lowest traction coefficient with an average of 0.25, but also showed the highest variation in traction level. Under wet conditions the baseline traction coefficient was the lowest at 0.15 with reduced variation between the other materials.
3.1.2 Wear
7
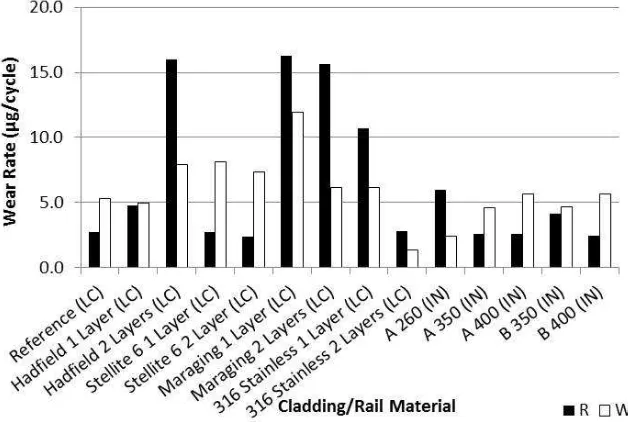
premium rails (Manufacturer A 350, 400 and Manufacturer B 350, 400) tested in the INNOTRACK project showing an average of 2.94 μg/cycle. However, wheel wear in the Stellite tests was higher averaging 7.74 μg/cycle compared to an average of 5.15 μg/cycle for wheel tested with premium rail in the INNOTRACK project.
[image:8.595.66.380.142.353.2]
Figure 5 Wear rates of the clad discs after 5000 dry cycles. R indicates wear rate of the rail disc, W indicates wear rate of wheel disc LC indicates data from current laser cladding tests, IN indicates data from the INNOTRACK project.
Figure 6 shows wear rates under wet conditions. Note that a wear rate of 51.0 µg/cycle was measured for the 260 grade rail sample tested in the INNOTRACK project. However, as this value was much greater than any of the other wear rates measured, the scale on the y‐axis of Figure 6 has been altered for easier comparison of the remaining values.
8
[image:9.595.66.373.66.281.2]
Figure 6 Wear rates of the clad discs after 5000 wet cycles.
3.1.3 Post‐test Inspection of Wear Specimens
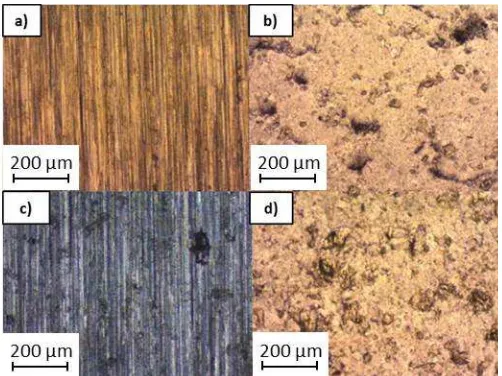
Surface microscope images of the reference wear specimens are shown in Figure 7.
Figure 7 Surface images of the reference wear specimens a) rail before test b) rail after 5000 dry cycles c) wheel before test d) wheel after 5000 dry cycles
[image:9.595.59.310.387.575.2]
9
Figure 8 Surface images of the 1 layer Hadfield wear specimens a) rail before test b) rail after 5000 dry cycles c) wheel before test d) wheel after 5000 dry cycles
Figure 8 b and d show different wear mechanisms to the reference sample shown in Figure 7. There seems to be lower deformation on the Hadfield rail disc compared to the reference rail disc with no evidence of ratcheting. There does however, seem to be more abrasive wear on the Hadfield rail sample with no adhesive wear. The wheel disc used with the Hadfield sample shown in Figure 8d) shows more severe surface damage compared to the reference wheel disc. The Wheel disc used with the Hadfield sample also shows a lot of delamination and abrasive scoring caused by three‐body‐abrasion due to wheel debris.
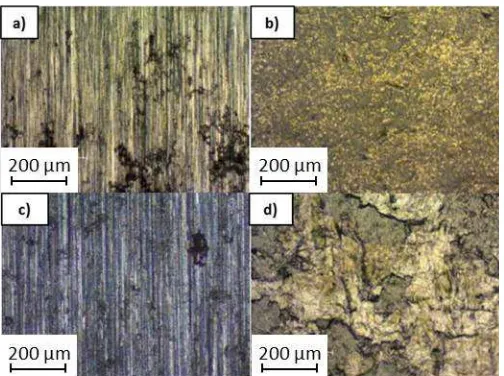
Figure 9 Surface images of the 1 layer Stellite wear specimens a) rail before test b) rail after 5000 dry cycles c) wheel before test d) wheel after 5000 dry cycles
[image:10.595.59.312.400.587.2]
10
Figure 10 Surface images of the 1 layer Maraging wear specimens a) rail before test b) rail after 5000 dry cycles c) wheel before test d) wheel after 5000 dry cycles
There is not much material flow on the surface of the Maraging rail sample compared to the reference sample. Instead there are signs of adhesive wear with some pitting. The wear surface does appear similar to the reference sample and the Maraging hardness was also similar to the reference sample as shown in Figure 13. The wheel wear is also comparable with the reference sample.
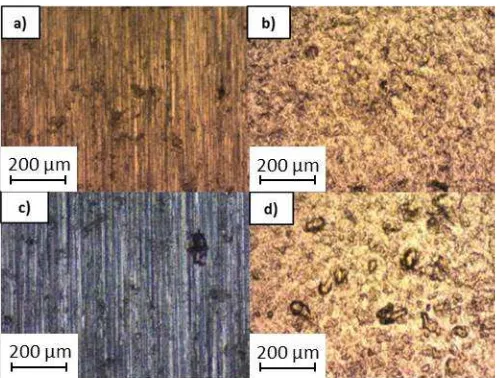
Figure 11 Surface images of the 1 layer Stainless wear specimens a) rail before test b) rail after 5000 dry cycles c) wheel before test d) wheel after 5000 dry cycles
Figure 11 shows very severe wear on both the wheel and rail Stainless sample surfaces. There are signs of high amounts of material flow. Large chunks of material loosened by ratcheting have been removed by adhesive wear. Figure 13 shows that Stainless had the lowest hardness tested which would explain the high material flow. Figure 5 also shows that the Stainless samples showed the highest wear rates further supporting observations from the surface pictures.
Samples were prepared for the post‐test analysis by the method described in section 2. Microscope images of the sections were taken and are shown in Figure 12.
[image:11.595.60.310.54.243.2] [image:11.595.60.311.370.555.2]11
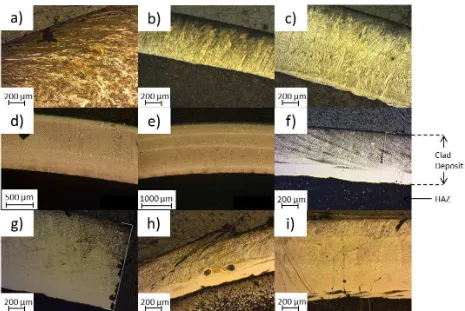
Figure 12 Etched sectioned SUROS specimens from wear testing a) unclad 260 grade reference rail disc b) 1 layer Hadfield clad c) 2 layer Hadfield clad d) Untested 1 layer Stellite 6 clad e) 2 layer Stellite 6 clad f) 1 layer Maraging clad g) 2 layer Maraging clad h) 1 layer Stainless clad i) 2 layer Stainless clad.
The boundary between the clad layers and the HAZ can be clearly seen in Figure 12. The bond between the clad and the HAZ is relatively smooth in the; Hadfield, Stellite and Maraging samples, with no inclusions or lack of bonding. In these samples no porosity or cracking was seen in the clad/deposit. The Stainless samples on the other hand show extensive cracking and delamination with some porosity in the deposit. It is not clear however, if the cracking in these samples was a result of testing or due to a lack of optimisation during the cladding process. The turbulent boundary between the deposit and the HAZ seems to suggest that the high damage in the stainless samples is more down to a manufacturing error rather than a weakness of the material.
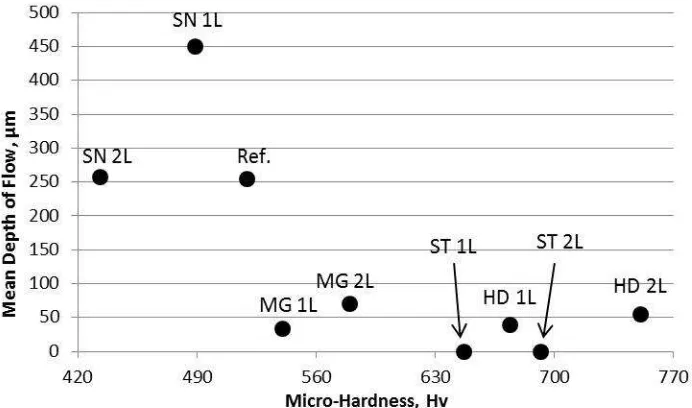
Figure 13 shows the relationship between deposit hardness and the depth of plastic deformation in each of the samples. Depth of plastic deformation was measured visually from the sectioned and etched samples. Visual inspection is not as accurate as Electron Backscatter Diffraction, EBSD when measuring the depth of plastic deformation. However, the EBSD technique was not available to the authors at the time of writing.
[image:12.595.64.529.55.366.2]12
Figure 13 Relationship between each sample’s sectioned hardness taken near the surface and the depth of plastic deformation.
It can be seen in Figure 13 that there seems to be an inverse relationship between deposit hardness and depth of plastic deformation.
3.2 Rolling Contact Fatigue Tests
The purpose of the RCF tests was to assess the RCF performance of each of the cladding materials.
3.2.1 Wear
Wear was measured during the wet part of the RCF tests and is illustrated in Figure 14. The discs had not been subject to enough cycles in the dry part of the RCF tests for the wear to stabilise.
[image:13.595.64.410.63.267.2]
Figure 14 Wear rates of RCF samples under wet conditions.
The biggest discrepancy between wheel and rail wear rate is again seen with both the Stellite 6 samples. The wheel wear for the Stellite samples is an average of 36% higher than the reference wheel wear rate. In the RCF tests the Maraging samples both showed almost equal wear rates between the wheel and rail. In the wear tests the Maraging were the only samples with wheel wear lower than that of the rail under wet conditions.
[image:13.595.65.390.495.664.2]13 3.2.2 RCF
The RCF tests consisted of 500 dry cycles to generate a plastically deformed surface layer in the discs. This is then followed by a test with distilled water dripped onto the surface of the discs at a rate of 1 drop per second. This wet section of the test was limited to 50,000 cycles (see Section 2 for explanation). Figure 15b shows the B1 output signal from the reference disc with artificial crack (Figure 15a). The two horizontal gates are positioned at the edges of the reference signal. Failure during the RCF tests was defined when these gates were breached by the signal from a test disc.
Figure 15 a) Reference disc with artificial crack b) Reference signal on B1 detector.
Only two of the samples tested failed before 50,000 cycles. These were the reference 260 grade specimen and the 2 layer stainless steel clad specimen.
Figure 16 shows the eddy current detector signal for the 1 layer Stellite sample during the wet section of the test. This is one of the samples which did not fail before the 50,000 cycle mark. There is only a slight change in the signal at the end of the test.
[image:14.595.60.463.190.390.2]
Figure 16 Eddy Current Detector signal Stellite 1 layer rail disc a) 200 cycles b) 30,000 c) no failure 50,000 cycles.
Figure 17 shows the eddy current detector signal for the reference 260 grade sample during the wet section of the test. This sample failed at approximately 15,000 cycles.
[image:14.595.56.540.517.655.2]14
[image:15.595.51.540.60.198.2]
Figure 17 Eddy Current Detector signal 260 grade reference rail disc a) 100 cycles b) 10,000 c) failure at approximately 15,000 cycles.
3.2.3 Post‐test Inspection of RCF Specimens
Microscope images of the sectioned RCF specimens are shown in Figure 18.
[image:15.595.67.523.298.638.2]
Figure 18 Etched sectioned SUROS specimens from RCF tests a) unclad 260 grade reference rail disc b) 1 layer Hadfield clad c) 2 layer Hadfield clad d) 1 layer Stellite 6 clad e) 2 layer Stellite 6 clad f) 1 layer Maraging clad g) 2 layer Maraging clad h) 1 layer Stainless clad i) 2 layer Stainless clad.
Figure 18 shows that the bond between the clad and the HAZ is relatively smooth in most of the samples with turbulent bonds only seen in the Stainless steel samples. In these samples no porosity or cracking was seen in the clad/deposit. Cracking was only seen at the surface of the two layer Stainless sample.
15
The clad RCF samples show much shallower deformation compared to the wear specimens. This would be expected as the RCF specimens have only been subject to 500 dry cycles. Whereas the wear specimens were subject to 5000 dry cycles. Under dry running the higher friction at the surface will cause higher sub‐surface shear stress to occur usually above the materials yield stress causing plastic deformation in the material. Under wet conditions the friction is reduced and hence the shear stress leading to less deformation. This can be seen in all of the clad samples. However, the opposite seems to have occurred in the reference samples with the RCF sample showing greater depth of deformation compared to the wear sample. It is not possible to calculate an estimated rate of plastic deformation (i.e. µm below the surface per cycle) under dry and wet conditions individually. This is because in both the wear and RCF tests the specimens were sectioned after being subject to both dry and wet cycling. It is therefore assumed that even though the rate of plastic deformation is slower in wet conditions; the reference RCF specimen was subject to far more test cycles than the reference wear specimen and hence a greater extent of deformation compared to the reference RCF specimen. The reason that the opposite behaviour was seen in the clad specimens is that they are much harder than the reference specimens and hence will deform at a much lower rate.
The low amount of plastic deformation in the clad RCF specimens also explains why no cracks were seen in all but one of the specimens. Generally RCF cracks in rolling contacts initiate in the plastically deformed layer of the rail material as its limit of ductility is reached, see Figure 12h. Crack growth is then driven by cyclic stressing as the contact moves over the area containing the crack [15]. Table 1 shows the optically measured depth of deformation for both the wear and RCF specimens. It can be seen that there is little to no deformation in the clad RCF specimens. This explains why no RCF cracks were seen in all but one of the clad RCF specimens as conditions for crack nucleation were not generated.
Material Depth of Deformation, μm
Wear RCF
Baseline 260 Grade 255.11 428.47 Hadfield 1L 38.41 0.00 Hadfield 2L 55.32 0.00
Stellite 1L 0.00 0.00
Stellite 2L 0.00 0.00
[image:16.595.59.283.438.620.2]Maraging 1L 33.89 5.62 Maraging 2L 70.62 0.00 Stainless 1L 449.73 20.16 Stainless 2L 256.99 111.57
16
Material Wet
[image:17.595.57.263.55.240.2]Traction Wear RCF Baseline 260 Grade 0.15 0.22 Hadfield 1 Layer 0.18 0.20 Hadfield 2 Layers 0.20 0.22 Stellite 6 1 Layer 0.19 0.21 Stellite 6 2 Layers 0.17 0.22 Maraging 1 Layer 0.20 0.20 Maraging 2 Layers 0.19 0.20 Stainless 1 Layer 0.21 0.24 Stainless 2 Layers 0.20 0.23
Table 2 Average Wet Traction Coefficients
Table 2 shows that the average traction coefficient was higher for the RCF tests. However, this average value incorporates the initial part of the traction curve where the traction is rising from zero to its steady state range. As the RCF tests were of much greater duration than the wear tests this average value will be calculated with a much greater proportion of the steady state range. The traction values can therefore be said to be in good agreement with each other. The traction coefficients from Table 2 have been combined into a mean value and are compared to the dry traction coefficient from the dry part of the wear test in Table 3.
Material Traction Dry Wet Baseline 260 Grade 0.40 0.19 Hadfield 1 Layer 0.41 0.19 Hadfield 2 Layers 0.40 0.21 Stellite 6 1 Layer 0.34 0.20 Stellite 6 2 Layers 0.36 0.19 Maraging 1 Layer 0.36 0.20 Maraging 2 Layers 0.35 0.19 Stainless 1 Layer 0.29 0.22 Stainless 2 Layers 0.20 0.21
Table 3 Dry and Wet Traction Coefficients (dry data from wear tests and wet data averaged from wear and RCF tests)
Any traction coefficient 0.09 or below is considered inadequate for safe braking in dry or wet conditions [16]. All of the samples tested are clear of this critical traction coefficient. In the dry conditions the baseline coefficient of traction is 0.40. Only the Hadfield samples are able to match this traction level with all other samples ranging between 0.36 and 0.20.
[image:17.595.56.231.381.545.2]
17
rate in relation to the reference was shown for Maraging 1 layer. The best performing rail, Stellite, gave wheel wear rates which were on average 145% of the reference wheel wear rate.
18 5.0 Conclusions
In this paper an assessment has been performed on the suitability laser cladding as a means of repairing or treating new rails. The following conclusions can be made:
¥ Under wet conditions; Hadfield, Stellite 6, Maraging and 316 Stainless claddings show traction levels similar to the 260 Grade reference material.
¥ Under dry conditions only the Hadfield samples show traction similar to the reference case. All other samples show lower traction than this however, they are still higher than the 0.1 level, where any traction below this value is not considered safe for breaking purposes.
¥ The Stellite 6 samples showed wear levels in agreement with the un‐clad reference sample in the dry case. The only other sample to show an identical wear rate to the reference case was the two layer 316 Stainless sample. All other samples showed wear rates which were in a range of double to nearly eight times the reference wear rate.
¥ Wheel wear rates were higher for all of the clad discs compared to the reference wheel wear in the wet tests. In the dry conditions all but two of the clad samples showed higher wheel wear than the reference case.
¥ The RCF life of the reference 260 Grade rail disc was approximately 15,000 cycles. All of the clad specimens showed greater RCF lives than this with the shortest being shown by the 2 layer 316 Stainless steel sample at 28,000 cycles. All other samples had RCF lives in excess of 50,000 cycles.
¥ The majority of the harder deposits showed little to no plastic deformation at the surface and hence no RCF cracks. This shows that the cladding of rail has the potential to significantly delay the onset of RCF crack nucleation compared to standard rail when the rail is smooth and uncontaminated.
¥ These tests show that the RCF life of rail could be improved if rail were laser clad. However, more test need to be performed in order to understand the wear performance of these laser clad layers.
Acknowledgements
The authors would like to thank Sandra Fretwell‐Smith for assistance with the polishing and etching of some of the samples and interpretation of the images taken.
References
[1] S. Niederhauser, Laser Cladded Steel Microstructures and Mechanical Properties of Relevance for Railway Applications, Doctorial Thesis, Chalmers University of Technology, Göteborg, Sweden, 2005
[2] S. Niederhauser, B. Karlsson, Fatigue behaviour of Co‐Cr laser cladded steel plates for railway applications. Wear, Vol. 258, 2005, pp 1156‐1164
[3] Fraunhofer USA, F. Bartels, A. Jonnalagadda, M. Weiner, E. Stiles, 2011. Laser Cladding of Tubes. United States Patent Application Publication US 2011/0297083 A1. 08/12/2011
[4] D. Zhang, X Zhang, Laser cladding of stainless steel with Ni‐Cr3C2 and Ni‐WC for improving erosive‐corrosive wear performance. Surface and Coatings Technology, Vol. 190 (1‐2), 2005, pp 212‐217
19
[6] J. M. Amardo, M. J. Tobar, J. C. Alvarez, A. Yáñez, Laser cladding of tungsten carbides (Spherotene®) hardfacing alloys for the mining and mineral industry. Applied Surface Science, Vol. 255, 2009, pp 5535‐5556
[7] T. Baldridge, G. Poling, E. Foroozmehr, R, Kovacevic, T. Metz, V. Kadekar, M. C. Gupta, Laser cladding of Inconel 690 on Inconel 600 superalloy for corrosion protection in nuclear applications. Optics and Lasers in Engineering, Vol. 51, 2013, pp 180‐184
[8] G. Fu, S. Liu, J. Fan, The design of Cobalt‐free, Nickel‐based alloy powder (Ni‐3) used for sealing surfaces of nuclear power valves and its structure of laser cladding coating. Nuclear Engineering and Design, Vol. 241, 2011, pp 1403‐1406
[9] D.I. Fletcher, J.H. Beynon, Development of a machine for closely controlled rolling contact fatigue and wear testing. Journal of Testing and Evaluation, Vol. 28 (4), 2000, pp. 267–275 [10] G. Vasić, F.J. Franklin, Plastic deformation and crack initiation in hard pearlitic rail steels.
Proceedings of the IoM3 Conference on 20th Century Rail, York United Kingdom, 1st‐3rd
November 2011
[11] W.R. Tyfour, J.H. Beynon, A. Kapoor, Deterioration of rolling contact fatigue life of pearletic rail steel due to dry – wet rolling – sliding line contact. Wear, Vol. 196, 1996, pp 255‐265 [12] A.F. Bower, The influence of crack face friction and trapped fluid on surface initiated rolling
contact fatigue cracks. Trans. ASME, Journal of Tribology, Vol. 110, 1988, pp 704‐711
[13] D.I. Fletcher, P. Hyde, A. Kapoor, Investigating fluid penetration of rolling contact fatigue cracks in rails using a newly developed full‐scale test facility. Proc. IMechE Part F: J. Rail and Rapid Transit, Vol. 221, 2006, pp 35‐44
[14] J.E. Garnham, J.H. Beynon, The early detection of rolling‐sliding fatigue cracks. Wear, Vol. 144, 1991, pp 103‐116
[15] A. Kapoor, A Re‐evaluation of the Life to Rupture of Ductile Materials by Cyclic Plastic Strain. Fatigue and Fracture of Engineering Materials and Structures, Vol. 17 (2), 1994, pp 201‐219 [16] C.R. Fulford, Review of Low Adhesion Research, Rail Safety and Standards Board, Research
Program Report, CRF04002, Issue 1
[17] A. Kapoor, D. I. Fletcher, F. J. Franklin, The Role of Wear in Enhancing Rail Life. Proceedings of the 29th Leeds‐Lyon Symposium on Tribology, 2003, pp 331‐340
20 List of Figures
Figure 1 Schematic of one‐step laser cladding process ... 2
Figure 2 a) Schematic of SUROS rig b) Extraction and dimensions of SUROS specimens c) Schematic of laser clad SUROS specimen. All dimensions in mm. ... 4
Figure 3 a) Picture of Eddy Current Crack Detector b) Differential eddy current probe offset 0.3mm from rail disc surface. ... 5
Figure 4 Average traction coefficients yielded during the friction tests. ... 6
Figure 5 Wear rates of the clad discs after 5000 dry cycles. R indicates wear rate of the rail disc, W indicates wear rate of wheel disc LC indicates data from current laser cladding tests, IN indicates data from the INNOTRACK project. ... 7
Figure 6 Wear rates of the clad discs after 5000 wet cycles. ... 8
Figure 7 Surface images of the reference wear specimens a) rail before test b) rail after 5000 dry cycles c) wheel before test d) wheel after 5000 dry cycles ... 8
Figure 8 Surface images of the 1 layer Hadfield wear specimens a) rail before test b) rail after 5000 dry cycles c) wheel before test d) wheel after 5000 dry cycles ... 9
Figure 9 Surface images of the 1 layer Stellite wear specimens a) rail before test b) rail after 5000 dry cycles c) wheel before test d) wheel after 5000 dry cycles ... 9
Figure 10 Surface images of the 1 layer Maraging wear specimens a) rail before test b) rail after 5000 dry cycles c) wheel before test d) wheel after 5000 dry cycles ... 10
Figure 11 Surface images of the 1 layer Stainless wear specimens a) rail before test b) rail after 5000 dry cycles c) wheel before test d) wheel after 5000 dry cycles ... 10
Figure 12 Etched sectioned SUROS specimens from wear testing a) unclad 260 grade reference rail disc b) 1 layer Hadfield clad c) 2 layer Hadfield clad d) Untested 1 layer Stellite 6 clad e) 2 layer Stellite 6 clad f) 1 layer Maraging clad g) 2 layer Maraging clad h) 1 layer Stainless clad i) 2 layer Stainless clad. ... 11
Figure 13 Relationship between each sample’s sectioned hardness taken near the surface and the depth of plastic deformation. ... 12
Figure 14 Wear rates of RCF samples under wet conditions. ... 12
Figure 15 a) Reference disc with artificial crack b) Reference signal on B1 detector. ... 13
Figure 16 Eddy Current Detector signal Stellite 1 layer rail disc a) 200 cycles b) 30,000 c) no failure 50,000 cycles. ... 13
Figure 17 Eddy Current Detector signal 260 grade reference rail disc a) 100 cycles b) 10,000 c) failure at approximately 15,000 cycles. ... 14