BACTERIOLOGICAL PROFILE OF DIABETIC FOOT ULCERS
WITH SPECIAL REFERENCE TO H
Partial fulfillment of the regulations required for the award of
Dr. M.G.R. Medical University
BACTERIOLOGICAL PROFILE OF DIABETIC FOOT ULCERS
WITH SPECIAL REFERENCE TO HbA
1C LEVELS
Dissertation submitted in
Partial fulfillment of the regulations required for the award of
M.D. DEGREE
In
MICROBIOLOGY – BRANCH IV
The Tamil Nadu
Dr. M.G.R. Medical University
Chennai
April -2013
BACTERIOLOGICAL PROFILE OF DIABETIC FOOT ULCERS
C LEVELS.
Partial fulfillment of the regulations required for the award of
DECLARATION
I, Dr.A.Shahjahan solemnly declare that this dissertation entitled
“Bacteriological profile of diabetic foot ulcers with special reference to HbA1c levels” was done by me at Coimbatore Medical College, Coimbatore
during the period from March 2009 to September 2010 under the supervision of
ANBU.N. ARAVAZHI, M.D., former Professor and Head, Department of
Microbiology and under the guidance of DR.K.RAJENDRAN, B.Sc., M.D., Professor and Head, Department of Microbiology Coimbatore Medical College, Coimbatore.
This dissertation is submitted to The Tamilnadu Dr.M.G.R. Medical University, Chennai towards the partial fulfillment of the requirement for the award of M.D. Degree (Branch- lV) in Microbiology to be held in April 2013.
I have not submitted this dissertation on any previous occasion to any University for the award of any degree.
Place:
CERTIFICATE
This is to certify that the dissertation entitled “Bacteriological profile of Diabetic foot ulcers with special reference to HbA1
c
levels” is a bonafidework done by Dr.Shahjahan, Post graduate student in the Department of
Microbiology, under the supervision of DR.ANBU.N. ARAVAZHI, M.D., former Professor and Head, Department of Microbiology, Coimbatore Medical College and under the guidance of DR.K.RAJENDRAN, B.Sc., M.D., Professor and Head, Department of Microbiology Coimbatore Medical College, Coimbatore, in fulfillment of the regulations of the Tamilnadu Dr.M.G.R. Medical University towards the award of M.D. Degree (Branch- lV) in Microbiology.
Professor& HOD, DEAN
ACKNOWLEDGEMENT
I extend my heartfelt gratitude to our Dean Dr.R.Vimala M.D., Coimbatore
Medical College and Hospital for permitting me to complete and submit this study.
I extend my gratitude to our former Dean I/C Dr. Kumaran, MS. MCh,
Coimbatore Medical College for allowing me to carry out this study.
I express my sincere thanks to my guide, Dr. Rajendiran MD, Professor and Head,
Department of Microbiology, Coimbatore Medical College for his timely advice,
sustained guidance and constant support throughout my studies.
I express my profound sense of gratitude to Dr. Anbu N Aravazhi. Former
Professor and Head, Department of Microbiology, Coimbatore Medical College for
offering his impeccable guidance in preparing this dissertation.
I wish to express my sincere thanks to Dr. Govindarajan, M.S., Mch., and the
Department of Surgery- Coimbatore Medical College, for their kind co-operation with me
in sample collection.
I wish to thank Dr.Shankar, Assistant Professor, Department of Microbiology,
Coimbatore Medical College, for guiding me with constant encouragement.
I am indebted to Dr N.Bharathi Santhose for his kind help and advice.
I wish to extend my special thanks to Dr.Deepa, Dr Padmini and Dr.Vasuki of the
Department of Microbiology for their constant encouragement and advice.
I sincerely thank my colleagues and the technical staff for their support.
I am extremely thankful to the patients who helped me in my study in spite of
CONTENTS.
PAGE NO.
1. INTRODUCTION………. ..…. 1
2. AIMS AND OBJECTIVES. ……… 4
3. REVIEW OF LITERATURE………... 5
4. MATERIALS AND METHODS……… 18
5. RESULTS……….. 31
6. DISCUSSION………. 52
7. SUMMARY ………. 60
8. CONCLUSION ………. 63
9. REFERENCES
10. ANNEXURE - PROFORMA.
LIST OF ABBREVIATIONS
1 ATCC American Type Culture Collection
2 E. coli Escherichia coli
3 H2S Hydrogen sulphide
4 CLSI Clinical Laboratory Standards Institute
5 MR Methyl Red
6 VP Voges Proskauer
7 HT Hypertension
8 DM Diabetes Mellitus
9 BSL Blood Sugar Level
10 HbA1C Glycosylated Hemoglobin A1C
11 CONS Coagulase Negative Staphylococci
12 MRSA Methicillin Resistant Staphylococcus aureus
13 MSSA Methicillin Sensitive Staphylococcus aureus
14 PBP Penicillin Binding Protein
15 MHA Mueller Hinton Agar
LIST OF TABLES
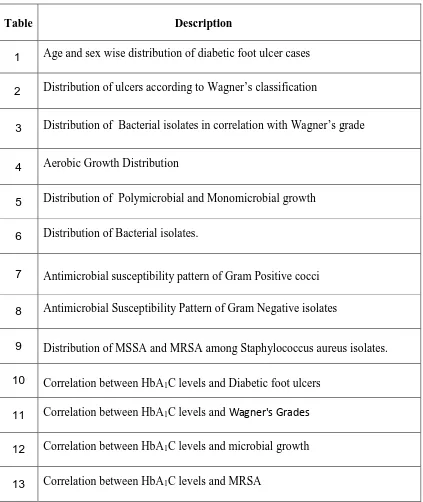
Table Description
1 Age and sex wise distribution of diabetic foot ulcer cases
2 Distribution of ulcers according to Wagner’s classification
3 Distribution of Bacterial isolates in correlation with Wagner’s grade
4 Aerobic Growth Distribution
5 Distribution of Polymicrobial and Monomicrobial growth
6 Distribution of Bacterial isolates.
7 Antimicrobial susceptibility pattern of Gram Positive cocci
8 Antimicrobial Susceptibility Pattern of Gram Negative isolates
9 Distribution of MSSA and MRSA among Staphylococcus aureus isolates.
10 Correlation between HbA1C levels and Diabetic foot ulcers
11 Correlation between HbA1C levels and Wagner's Grades
12 Correlation between HbA1C levels and microbial growth
LIST OF CHARTS
Chart Description
1 Age and sex wise distribution of diabetic foot ulcer cases 2 Distribution of ulcers according to Wagner’s Classification
3
Distribution of average no of bacterial isolates per sample in correlation
with Wagner’s grade
4 Aerobic Growth Distribution
5 Distribution of Polymicrobial and Mono microbial growth
6 Distribution of Bacterial isolates
7 Antimicrobial susceptibility pattern of gram positive cocci
8 Antimicrobial susceptibility pattern of gram negative isolates
9 Distribution of MSSA and MRSA among Staphylococcus aureus isolates. 10 Correlation between HbA1C levels and Diabetic foot ulcers
11 Correlation between HbA1
c
levels and Wagner’s grade 12 Correlation between HbA1C levels and microbial growth
LIST OF COLOUR PLATES
No.
Description
1 Diabetic foot ulcers
2 Klebsiella - Colony morphology and Biochemical reactions
3 Proteus spp. - Colony morphology and Biochemical reactions
4 Pseudomonas spp. -Colony morphology and Biochemical reactions
5 Staphlococcus aureus-Colony morphology and Biochemical reactions
6
Staphylococcus aureus with methicillin sensitivity and resistance
pattern.
1
INTRODUCTION
Diabetes mellitus is a chronic metabolic disorder affecting a large
segment of population and also a major public health problem1. Diabetes is rightly called a “disease of complications” and “Iceberg disease”. India homes 33 million
diabetics, ranking highest in the world and has a prevalence of about 8% in urban
India. Twenty percent of all diabetic complications involve feet2. Globally, the prevalence of diabetes is expected to rise from a current estimate of 150 – 220
million in 2010 to 300 million in 20253, 4. The number of people with diabetes is increasing due to population growth, ageing, urbanization, increasing prevalence of
obesity and physical inactivity. Quantifying the prevalence of diabetes now and the
number of people to be affected in future is important to allow rational planning and
allocation of resources.
Two major factors are considered important in development of the ‘diabetic foot’14, 15. 1. Peripheral neuropathy causing sensory impairment and weakness of
intrinsic muscles of the foot and joint that leads to foot deformities.
2. Macro and microangiopathy occurring frequently and leading to ischemia
of foot tissues.
Wounds become infected five times more often in diabetics than in non-diabetic
patients. Selecting appropriate antimicrobial therapy for diabetic foot infections requires
knowledge of likely etiologic agents5. The most important characteristic of diabetic foot infection is its polymicrobial nature, and frequent involvement of anaerobes
2
The common aerobic organisms encountered are S. aureus, Proteus species,
Pseudomonas, Escherichia coli, Klebsiella species, Coagulase Negative Staphylococci
etc. Pepto-streptococcus species, Bacteroides melaninogenicus and Bacteroides fragilis
are commonly isolated anaerobes 6, 16. The Incidence of aerobic infection is more in lower grades of Wagner’s classification. As the grade increases anaerobic infections are
encountered frequently17, 31.
About 10-30% of diabetic patients with foot ulcers will eventually progress to
amputation, which may be minor (foot sparing) or major (amputation)5. Conversely, an infected foot ulcer precedes ~60% of amputations, making infections perhaps important
proximate cause of this tragic outcome5,. Mild or non-limb threatening infections can be treated with oral antibiotics, surgical debridement of necrotic tissue, local wound care and
close surveillance for progression of infection thus preventing the emergence of
complications10.
In spite of a multidisciplinary foot-care team to optimize foot care, deleterious
effects of infection on soft tissue and bone continue to be a major problem in diabetic
patients61. Progress of infection is usually associated with delayed diagnosis,
underestimation of the extent of infection, and inappropriate antimicrobial therapy 11.
The rate of infection parallels blood glucose levels. Blood glucose binds to
haemoglobin in red blood cells to form glycosylated haemoglobin. (HbA1C).
HbA1C levels depend on blood glucose concentrations. HbA1C can be used as a time
average index of the blood glucose concentration to which Haemoglobin has to be
3
Glycemic control is the prime factor in controlling the development of diabetic
complications. Poor glycemic control in diabetes has serious complications. Each 2%
increase in the level of HbA1C increases the risk of lower extremity ulcer by 1.6 times
and the risk of lower extremity amputation by 1.5 times63.
The present study was undertaken to assess the role of aerobic bacteria in
causation of diabetic foot ulcers. Though anaerobic bacteria are also encountered in
diabetic infections, isolation of anaerobes was not feasible due to lack of facilities.
This study has been carried out to detect the antibiotic sensitivity pattern of the
isolates and MRSA. The antimicrobial spectrum of these isolates would assist clinicians
to select appropriate antimicrobial therapy in order to prevent the dreaded complications
of diabetic foot infections.
The study also sought to analyze the influence of patient variables on diabetic foot
ulcers. In this study we have made an attempt to correlate HbA1
c
levels with thebacteriological profile of diabetic foot infections and the antimicrobial susceptibility
4
AIMS AND OBJECTIVES
1. To study the prevalence of diabetic foot ulcers in various age groups and gender.
2. To isolate and identify the bacterial isolates causing diabetic foot infections.
3. To assess the correlation between Wagner’s grade and bacteriological profile.
4. To determine the antibiotic susceptibility pattern of bacterial isolates.
5. To analyze HbA1C levels in relation with Diabetic Foot Infections, bacteriological
5
REVIEW OF LITERATURE
Diabetes is one of the oldest metabolic disorders known to mankind. The term "diabetes"
is from Ionian Greek, meaning "to pass through".
• The knowledge of Diabetes, dates back to 1550 BC, where descriptions of a
polyuric state resembling diabetes mellitus is recorded in the Ebers Papyrus by
Georg Ebers.
• Association of polyuria with a sweet tasting substance in urine was first reported
in Sanskrit literature dating from 5th to 6th century AD at the time of two notable
Indian physicians, Susruta and Charaka.
• The term “diabetes mellitus", an allusion to honeyed taste of urine, was first used
in late 18th century by John Rollo and others, to distinguish it from other polyuric
states in which urine was tasteless.
• In 20th century, Geog Zuelzer (Germany) and Nicholas Paulesco (Romania)
isolated active but impure hypoglycaemic extracts from pancreas. (Text of
diabetes).
• Late 1970s- dry reagent test strips for self-monitoring of blood glucose were
developed.
• 1993- definitive proof was given by the Diabetes Control and Complications Trial
that strict glycemic control could slow or prevent the development of diabetic
6 TYPES OF DIABETES10, 12
Type I Diabetes: β cell destruction usually leading to absolute insulin
deficiency which may be either immune mediated or idiopathic.
Type II Diabetes: May be predominantly insulin resistance with relative insulin
deficiency or predominantly insulin secretory defect with insulin resistance.
Type III Diabetes: Includes genetic defects of B cell function and insulin action,
disease of exocrine pancreas and endocrinopathies, drug or chemical induced and
infections.
Type IV Diabetes: Gestational diabetes.
Criteria for diagnosing diabetes are
1) Symptoms of diabetes plus random blood sugar ≥11.1 mmol/lt (200mg/dl) or
2) Fasting plasma glucose ≥ 7 mmol/lt (126mg/dl) or
3) 2 hour plasma glucose ≥ 11.1mmol/lt (200mg/dl) during an oral glucose tolerance test.
Complications of Diabetes mellitus may be3
Acute metabolic complications:
Hypoglycemia, Diabetic ketoacidosis, Hyperosmolar non ketotic coma.
Late complications:
Micro vascular (Retinopathy, Neuropathy, Nephropathy),
Macrovascular(Atherosclerosis, Coronary artery disease, Cerebrovascular disease),
7 Diabetic Foot Ulcers
Patients with diabetes mellitus may have many serious sequelae. Among them,
foot ulcers are most common and may lead to severe complications50. Longstanding diabetes often results in peripheral sensory and motor neuropathy, along with foot
deformities8,9. Peripheral vascular disease and peripheral diabetic neuropathy increase the risk of Diabetic foot ulcers leading to infections and amputations 5, 15. The longer nerves are more vulnerable hence peripheral foot neuropathy is commonly seen in the foot.
These, combined with poorly understood perturbations in host defense mechanisms and
wound healing responses, set the stage for diabetic foot ulcers leading to foot infections64. Although most of the infections remain superficial, ~25% will spread contiguously from
skin to deeper subcutaneous tissues and bone5, 7.
Etiopathogenesis of diabetic foot lesions
The diabetic foot lesions have traditionally been considered to result from
combination of peripheral neuropathy, vascular disease in leg and infection25. More recently, abnormalities of pressure loading on sole of foot and resulting callus formation
have been identified as important mediators of the process7, 14, 18.
Wagner’s classification of diabetic foot lesion
Includes 6 stages of severity20, 31, 47:
Grade 0: No obvious ulcer but thick callus, prominent metatarsal head, claw toes or any
8 Grade 1: Superficial ulcer, not clinically infected.
Grade 2: Deeper ulcer, often infected, but no bone involvement.
Grade 3: Deep ulcer, abscess formation and bone involvement.
Grade 4: Localised gangrene.
Grade 5: Gangrene of whole foot.
Infections in diabetic patients are mostly polymicrobial in nature 16,19,35. In acute superficial infections of foot ulcer aerobic gram positive bacteria such as Staphylococcus
aureus and Beta Hemolytic Streptococci predominate21, 26. In deeply infected chronic ulcers a mixture of aerobic gram positive, aerobic gram negative and anaerobic organism
are seen27, 33.
Staphylococcus aureus was the most common pathogen among the gram positive
bacteria isolated among the Diabetic foot ulcers. The pathogenesis of staphylococcal
infections is multifactorial. Infection by Staphylococci usually results from a combination
of bacterial virulence factors and diminution in host defence37. Wound infection can occur following an operative incision, acute traumatic laceration, or chronic pressure
induced ulcer, during which bacteria indigenous to the patient or exogenous to the wound
overwhelm the systemic and local factors of host resistance34.
The gram negative comprise mainly of Enterobacteriaceae family such as
Escherichia coli, Klebsiella sp, Proteus sp etc. Nonfermentors such as Pseudomonas spp.
9
Staphylococci are able to develop resistance quickly and successfully to the
antibiotics. This is the consequence of the acquisition and transfer of antibiotic resistance
plasmids and the possession of intrinsic resistance mechanisms44,65. Methicillin Resistant Staphylococcus aureus (MRSA) is critical global health issue.
Methicillin was a narrow spectrum β-lactam drug developed in the 1950s to tackle
c-β-lactamase producing Staphylococcus aureus. Methicillin is no longer manufactured
because of its unstable nature and manufacture of a more stable β-lactamase resistant
penicllins such as Oxacillin, flucloxacillin and dicloxacillin which are being used.
Oxacillin is used as an alternative to Methicillin presently to determine resistance67.
Methicillin resistance is mediated by mec A gene, which encodes for an alternate
Penicillin Binding Protein (PBP) called (PBP) 2. PBPs are enzymes in the cell wall that
mediate the formation of cell wall peptidoglycan. PBP 2 exhibits a very low affinity for
methicillin and other β-lactam drugs. Thus these penicillin groups of drugs cannot
damage cell wall. Cell wall synthesis continues and the bacteria survive. The gene mec-A
is carried on a mobile genetic element, the Staphylococcal Cassetee Chromosome mec
(SCCmec)68. Accessory determinants (fewmA, B, C, fhm B etc) are required for the expression of methicillin resistance without which or alteration in any of these elements
decreases the expression of methicillin resistance in spite of the fact that PBP2 is
present44.
External factors affecting methicillin resistance are temperature, PH, osmolarity,
light, divalent cations, chelating agents and anaerobiosis, lowering the temperature and
10
conditions are routinely employed in the detection of methicillin resistance in clinical
isolates42.
Predisposing factors for MRSA43
• Prolonged hospital stay and frequent contact with health care environment
• Close proximity to an infected or colonized patient
• Contact with colonized health care workers.
The emergence of antibiotic resistance in the form of MRSA limits the treatment
options available to the clinicians. Detection of MRSA in the early stages of Diabetic foot
infections can decrease the morbidity and mortality in these patients34.
Hemoglobin is the oxygen carrying pigment in RBC. About 90% of
Hb(haemoglobin) is HbA (Adult type). 92% of Hb A is made up of major chemical
components, 8% of HbA is made up of slightly different minor chemical components.
These are Hemoglobin A1c, A1b, A1a1, and A1a2. Hemoglobin A1C (HbA1c) is a minor
component of Hemoglobin to which glucose is bound. It is called as glycosylated
hemoglobin or glycohemoglobin 61. The more glucose in the blood the more haemoglobin A1C or Hb A1C will be present in the blood. Red cells live for 3-12 weeks
before they are replaced. HbA1C level can tell us how high the blood glucose has been on
average over the 3-12 weeks period. Normal non diabetic HbA1C is 3.5-5.5%. In diabetes
about 6.5% is good 63.
The glycosylated Hb test is an important blood test to diagnose DM/Determine
control of DM. There is almost a direct relationship of Foot lesions with increasing
11 Review of studies
The mean age of the patients was, 80.3 years in Delbridge et al study 60, 58 years in Ramani et al study17, 75.02 years in NA Pathare et al study 31, 58 years in Dipali AC et al study 6 and 43 years in study conducted by C.Anandi et.al. from Tamil Nadu India 1.
D.Vijay et al in 2000 observed a preponderance of male patients showing
diabetic foot ulcers (72.5%) compared to female patients (27.5%) The ratio of males to
females was 2.6:121. In a study by Dipali AC et al in 2002, 67% of male patients with diabetic foot ulcers were reported against 32.4% of female patients with a ratio of 2.1:16. Anandi et al 2004 observed difference of 65.4% and 54.6% among male and female
patients with a ratio of 1.2:11. All the above authors have observed a preponderance of males in their study.
These are various studies done by several investigators on diabetic foot infections
and clinical isolates. Mohanty et. al. have studied the Bacterial etiology of soft tissue
infection and their Antibiotic susceptibility pattern in 2002. Of the 5,039 pus samples,
2437(48.36%) were culture positive while 1831(33.33%) were culture negative. Among
2437 bacterial isolates 1279 (45.96%) were gram positive cocci. Staphylococcus aureus
were 1059 (38.05%). Resistance to Methicillin was detected in 38.56% of
Staphylococcus aureus isolates and 31.16% of CONS. 69
Polymicrobial infection was noted in 64.4% and single etiology in 19.6% in a
study conducted by C.Anandi et.al. from Tamil Nadu India1. Among the aerobes E.coli 27.7% Pseudomonas species 11.3% and Staphylococcus aureus 13.6% were isolated
12
concluded that Bacterial culture not only helps in treating infection but also in prevention
of developing further complications like Cellulitis and Gangrene 1.
Polymicrobial Infection was found in 35% of the patients in a prospective study
of Diabetic foot ulcers conducted by Ekta Bansal Et.al. Pseudomonas aeruginosa among
the gram negative (22%) and Staphylococcus aureus among the gram positive (19%)
were the predominantly isolated organisms. While the Candida species was the most
predominantly isolated fungus in the study. An average of 1.52 isolates per case was
reported in this study. Neuropathy (76%) and peripheral vascular disease 57.28% was a
common feature among these patients. Poor glycemic control was found in 67% of
patients. 11
A multicentric clinical trial was conducted by Diane M Ceitron et al; at
R.M.Alden Research Laboratories California. Out of the 427 positive cultures 83.8%
were polymicrobial. 48% were only aerobes. 43.7% were both aerobes and anaerobes and
1.3% were only anaerobes. The predominant aerobic organisms were Oxacillin
susceptible staphylococcus aureus (14.3%), Oxacillin resistant staphylococcus aureus
(4.4%), Coagulase Negative Staphylococcus species 15.3%, Streptococcus species
15.5%, Enterococcus species 13.5%, Corynebacterium species 10.1%, and
Enterobacteriaceae 12.8%, and Pseudomonas aeruginosa 3.5%. The predominant
anaerobes were gram positive cocci 55
In 654 diabetic patients, 728 pathogens were isolated in study conducted by
Vishwanath Et al. Aerobic pathogens were isolated in 437 (66.8%) patients and anaerobic
13
family (48%), Staphylococcus species (18.2%), Streptococcus species,16.8% and
Pseudomonas species 17% were seen frequently. Among anaerobes, Peptostreptococcus
species and Clostridium species formed 69.4% 51.
Gram Negative aerobes 51.4% were most frequently isolated followed by gram
positive aerobes and anaerobes (33.3 and 15.3% respectively) in a study conducted by
Ravishekar Gadepalli et al from AIIMS New Delhi on Diabetic foot ulcers58.
In a study conducted by Varaiya et al in Mumbai, Escherichia Coli (40.29 %) and
Klebsiella pneumonia 59.70% were isolated.49
Uday Kelkar et al in 2004 carried out a comparison study of bacterial yield from
the deep tissue samples and swabs in 50 cases with diabetic foot ulcer. The swab samples
yielded a total of 150 organisms, comprising 125 aerobes and 25 anaerobes ( average 3.7
organisms per sample).The deep tissue samples yielded a total of 185 organisms
comprising of 145 aerobes and 40 anaerobes,. Among the aerobic organisms cultured,
Staphylococcus aureus was the most common, followed by Proteus mirabilis, Escherichia
coli, Pseudomonas aeruginosa, Klebsiella species and Enterococcus species.33
In a study by Ekta Bansal et al in 200911 Proteus sp exhibited 100% sensitivity to
Cefaperazone with sulbactum and Ceftriaxone, and amikacin. It showed lowest
sensitivity to Amoxicillin (33%). In a study by Vimalin Hena et al in 2010 the proteus
14
In a study by Ekta Bansal et al in 2009 Pseudomonas showed 100% sensitivity to
Imipenem, 94% to Ceftazidime, 83% to Piperacillin63% to Ciprofloxacin. For Amikacin
79% and Gentamicin 33% sensitivity was noticed11. In a study by Vimalin Hena et al in 2010 Pseudomonas sp showed 100% sensitivity to Imipenem followed by 83% to
Piperacillin, 41% to Ceftazidime and 22% to Ciprofloxacin 52.
In a study by Ekta Bansal et al in 2009 Escherichia coli showed 96% sensitivity
to Cefaperazone with sulbactum, 90% to Amikacin, 82% to Ceftazidime and 33% to
Ciprofloxacin11. In a study by Vimalin Hena et al in 2010 Escherichia coli showed 71% sensitivity to Piperacillin followed by 65% to Ceftazidime. For Amikacin, Gentamicin
and Cefotaxime 59% sensitivity was noticed 52.
Anandi et al 1 observed that all the aerobes were sensitive to amikacin and gentamicin except two Pseudomonas spp isolates. All the aerobes were susceptible to
Cefotaxime except four Pseudomonas sp isolates which were susceptible to amikacin and
gentamicin. Dipali AC et al 6 found that more than 70% of the aerobic gram negative bacilli were sensitive to amino glycosides, amikacin (95.74%) and gentamicin (70.21%).
Sensitivity to Cefotaxime was 63.50%. Nema et al found that the gram negative bacilli
were most sensitive to amino glycosides and sensitivity to Cefotaxime was 63.12%43.
Staphylococcus aureus was the most common pathogen isolated from ulcers and
almost 50% of the isolates were MRSA in a study conducted by N. Tentolouris et al in
15
Out of 2314 (37.82%) Staphylococcus aureus strains isolated from diabetic foot
ulcers , 992(42.86%) were found to be methicillin resistant in a study conducted at
Coimbatore, Tamil Nadu by Muruguan.S, Mani K.R, UmaDevi.66
Subedi and Brahmadathan tested 117 Staph aureus strains from patients attending
tertiary care centre in western Nepal for susceptibility, 18 (15.4%) were Methicillin
resistant. 14 (7 7.8%) of the Methicillin Resistant Strains were Multi Drug Resistant53.
Dang et. al. anlaysed Diabetic foot ulcers. Gram Positive bacteria were isolated in
84.2% and Staph aureus in (79%) was the commonest single isolate42.MRSA was isolated in 30.2% of the patients. They have concluded that there is a need for multi centre study
looking into the prevalence of MRSA in diabetic foot ulcer and how it can be reduced in
diabetic foot infections.
Kakru et. al. studied 1056 S. aureus from various clinical specimens, among them
312 were from pus samples. 64(35.5%) among 180 samples from outpatients and 42
(31.81%) among 132 samples from inpatients were methicillin resistant. 52% of S. aureus
isolates were sensitive to penicillin, 62% to gentamicin, 58% to erythromycin , 53% to
co-trimoxazole, 60% to ciprofloxacin, 62% to cefotaxime,6 % to cephalexin, 57% to
ampicillin, 73% to amikacin and 100% to vancomycin.68
Cerveira et al, did four year study to detect the outcome of MRSA and MSSA
infection among lower limb amputation cases. 165 patients underwent lower limb
16
In a study by Nahid Rouhipour 62.9% of patients had poor diabetic control
(HbA1C of 8% or higher)75. And in a study by M.B. Girish et. al the mean glycated hemoglobin was 7.80 ± 0.80 74. The patients who underwent amputation presented a significantly higher incidence of ischemic diabetic foot with, HbA1C > 7 74.
Among 183 diabetic individuals treated at the Johns Hopkins Wound Center.
Mean HbA1c was 8.0%, and there were 2.3 wounds per individual. Of all measures
assessed, only HbA1c was significantly associated with wound-area healing 72.
InNighat Akbaret al’s study Mean value of glycosylated haemoglobin (Hb) was
8.2% (6 - 16.6%).75% of patients showed an HbA1c level <8.0%; in 13% cases, it was
between 8.1 and 10.0%, and in 12% of cases, it was >10%. Data shows that there is
almost a direct relationship of foot lesions with increasing Glycated Hb i.e. poorer blood
sugar control. All the patients who had an HbA1c level >10% manifested with various
types of foot lesions73.
In Strhova L et al study in 2006 significant number (65%) of infected ulcers
on feet was reported in poorly controlled diabetic patients with HbA1C above 8%.
Infection and osteomyelitis together remains as significant risk factor for amputation. In
this study HbA1C appears to be significant predictor for amputation62.
17
As per Wheat et al study the majority of patients with the diabetic foot ulcers had
bad control diabetic status (HbA1C > 8.5) but there were no relationship between the bad
control diabetic status and the type of pathogen isolated from the ulcers 16.
In Shaba Tiwari et al study HbA1c was similar in polymicrobial and the
mono-microbial infections, (9.9% versus 9.5%; p = 0.1). of diabetic foot patients71. Incidence of diabetic foot lesions strongly correlates with the poor glycemic control, which in itself
18
MATERIALS AND METHODS
The present study was conducted in the Department of Microbiology at
Coimbatore Medical College Hospital over a period of 1½ years from March 2009 to Sep
2010. Pus and wound swabs were collected from around 100 diabetic patients with foot
ulcer attending the Surgery Out-Patient Department of Coimbatore Medical College
Hospital. The samples received in the Department of Microbiology were processed for
aerobic culture and antibiotic sensitivity testing during the study period. Blood samples
were collected to analyze the HbA1
c
levels.Inclusion criteria:
• Individuals with Type I and Type II Diabetes mellitus
• Age above 20 years of both sexes.
• Diabetic Foot Ulcer patients including from Grade I to V of Wagner’s Classification.
Exclusion criteria:
• Patients on antibiotic treatment.
• Foot ulcers of Grade 0.
• Individuals with non diabetic ulcers.
Patients above the age of 20 years, both genders with Diabetes Mellitus were
evaluated and the data was collected with the help of questionnaire which comprised of
relevant clinical history, clinical examination and laboratory investigations. Clinical
19
The Blood Sugar levels were noted. The ulcer type was evaluated using Wagner’s
classification of diabetic foot ulcers.
Sample collection
The surrounding area of the ulcer was cleaned with spirit or povidone iodine and
the surface of the wound was washed with sterile normal saline using a sterile cotton
swab. Superficial dead tissue and slough was removed with sterile scissors and scalpel.
Pus and wound exudates were then obtained with two sterile cotton swabs. One swab was
inoculated into Brain heart infusion broth immediately after collection at the bedside for
aerobic culture and labeled. Direct smears were made from another swab and stained with
Gram stain. The smear was screened for the presence of inflammatory cells and the type
of microbial flora.
Blood sample was collected under strict aseptic precautions from anterior cubital
vein and added to an EDTA containing vacutainer and sent for Blood HbA1C analysis.
Characterization of bacterial isolates:
Culture of aerobic bacteria
The inoculated Brain heart infusion broth was incubated overnight at 370C in an incubator. The broth was then sub cultured onto 5% Sheep blood agar, MacConkey agar
and nutrient agar plates. The inoculated plates were incubated at 370C overnight. The colonies were examined under magnifying lens for colony morphology, and the isolates
were identified using the standard microbiological procedures like Gram staining and
biochemical reactions as described in Practical Microbiology of Mackie McCartney 14th
20
Thegram positive cocci are identified as given in the flow chart below:
Identification of Staphylococci:
The presence of white opaque colonies on Blood agar plate was further confirmed
by examination of gram stained smear. Colonies showing gram positive cocci in clusters
were subjected to Catalase test and Coagulase test to identify Staphylococcus aureus.
Gram staining
A smear was prepared on a clean grease free glass side. Air dried and heat fixed. The
smear was covered with Methyl Violet and allowed to act for about 1 minute. Washed
with clean water and the smear was covered with Gram’s Iodine for 1 minute. Washed
and decolorized with acetone. Washed again immediately and diluted Carbol fuchsin was
added on to the slide for 1minute. Washed dried and the stained smear was examined
21 Catalase Test
One ml of 3% hydrogen peroxide solution is taken in a small tube. One test
colony is picked up using a sterile glass rod and introduced into the solution.
Vigorous effervescence indicates catalase activity and was taken as positive.
Positive control – Staphylococcus aureus.
Negative control – Enterococcus fecalis.
Coagulase Test
Citrated human plasma was used for the test.
Slide Coagulase test
1-2 colonies of staphylococcus were emulsified in a drop of normal saline on a
grease free glass slide to form a smooth milky suspension. Similar suspensions were
made for positive and negative controls. Then a drop of undiluted plasma was added to
all the three suspension. Coarse clumping of the organisms visible to the naked eye
within 10 seconds was taken positive. If the test was negative or showed slow reaction,
tube coagulase was done.
Tube Coagulase test
1 ml of 1:6 dilution of plasma in saline was taken in a small tube. 1-2 colonies
were emulsified in the tube of diluted plasma. Positive and Negative Coagulase controls
22 Antibiotic Susceptibility testing
Antibiotic susceptibility testing was done by Kirby Bauer disc diffusion method
as per CLSI guidelines. The isolates were grown in peptone water by incubating at 370 C till the turbidity matched that of 0.5 MacFarland standard .They were then lawn cultured
onto Mueller Hinton agar plate and commercial antibiotic discs [Penicillin(10U),
Erythromycin(15µg), Ampicillin (10µg), Amoxyclav (30µg), Gentamicin(10µg),
Amikacin(30µg), Linezolid (10µg), Cefotaxime (30µg), Cephalexin(30 µg),
Ciprofloxacin(5µg), Vancomycin(30µg), Co-trimoxazole (25µg)] procured from
Hi media, Mumbai were placed on the surface. The plates were incubated overnight
at 370C and the zones of inhibition were measured and interpreted according to the charts provided by the manufacturers.57 Staphylococcus aureus ATCC 25923 was used as a control for the susceptibility testing.
Staphylococcus aureus isolates were subjected to Methicillin susceptibility testing
by Kirby-Bauer disc diffusion method using Oxacillin (1 µg) disc. 1 to 2 Staphylococcal
colonies were suspended in 0.5 ml of sterile normal saline and the turbidity matched to
0.5 McFarland. Using sterile cotton swab the broth culture was uniformly streaked on to
Mueller Hinton agar with 2% Sodium Chloride Plate. Oxacillin (1 µg) disc was placed on
the plates were incubated at 370C aerobically for 24 hrs and the zone of inhibition was measured. Staphylococcus aureus ATCC 43300 was used as a control for methicillin
resistance.
The gram negative bacilli is identified based on the colony morphology on
23
IDENTIFICATION OF ENTEROBACTERIACEAE
Lactose and non lactose fermenting colonies present on Mac Conkey agar were subjected to gram staining & biochemical reactions as mentioned below for confirming them to be from family enterobacteriaceae.
Bacterial Isolates
Catalase Oxidase Indole MR VP Citrate Urease TSI Glu Lac Suc Malt Mann
E.Coli + - + + - NU NH A/A+- + + +/- + +
Klebsiella + - - - + U H A/A+- + + + + +
P.mirabilis + - - + _ U H K/A++ + +/_ +/_ _ +
P.vulgaris + - + + _ U H K/A++ + _ + + _
C.freundii + - - + _ U NH K/A++ + _ + + _
E.cloacae + - - - + U/NU H/NH A/A+- + + + + +
24
The Non-fermenters are identified based on the non-lactose fermenting colonies
on MacConkey agar plate and the biochemical reactions as given in the table below:
Biochemical reactions for Identification of Non-fermenters
Organism Pseudomonas spp Acinetobacter spp
Catalase P P
Oxidase P N
O/F O NF
Indole N N
MR N N
VP N N
Citrate Utilized -
Urease V -
TSI K/K K/K
MM NF/M NF/NM
MM-Mannitol motility VP- Voges Proskauer V-variable
O/F- Oxidation/Fermentative MR- Methyl red TSI- Triple Sugar Iron
25
ANTIBIOTIC SENSITIVITY TESTING
Antimicrobial susceptibility testing was performed by Kirby Bauer disk diffusion
method. Commercially available Mueller Hinton agar culture medium and antibiotic
discs (Himedia) were used.
Inoculum preparation
Using sterile wire loop 3-4 well isolated colonies of similar appearance from
primary culture plate were inoculated into 2-3 ml of normal saline and subsequently
emulsified. The turbidity was adjusted so as to correspond to the 0.5 Mcfarland
standards.
Preparation of 0.5 McFarland standard.
0.5 ml of aliquot of 0.08mol/L (1.175% w/v BaCl2 2H20) is added to 99.5 ml of
0.18 mol/l H2S
o
4 (1%V/V) with constant stirring to maintain a suspension.Inoculation of test plates
After adjusting the turbidity of the inoculum suspension, sterile cotton swab
dipped into the suspension. Excess fluid was removed by pressing and rotating the swab
against the side of the tube above the level of suspension. The surface of the Muller
Hinton agar plate was streaked with the swab evenly over in three directions. Using
sterile forceps the appropriate antimicrobial discs were placed over the inoculated plate
and not closer than about 24 mm from disc to disc. Then the plates were incubated at
26
The commercial discs used were procured from Hi media lab ltd. Ampicillin (10µg),
Gentamicin (10µg), Amikacin (30µg), Ciprofloxacin (5µg), Cotrimoxazole (25µg),
Cefotaxime (30µg). Cephalexin (30 µg), Ceftriaxone (30µg), Cefaperazone with
sulbactum (75 µg), Piperacillin with tazobactum (100 µg), Ofloxacin (5 µg),
Ceftazidime(30 µg) & Meropenem (10 µg).
Interpretation of zone sizes
The zones of inhibition were measured and interpreted according to the charts provided
27 RESULTS
The present study was carried out in the Department of Microbiology,
CMC from March 2009 to Sep 2010 to look for the pattern of growth of aerobic
organisms and their antibacterial susceptibility pattern in diabetic foot infections.
HbA1C levels are also determined in the study. The following Tables and Figures
illustrate the results in detail. The results obtained were analyzed.
TABLE 1: AGE AND SEX DISTRIBUTION OF DIABETIC FOOT ULCER
CASES
Age in years Males Females
21-30 3 1
31-40 4 1
41-50 14 4
51-60 26 11
61-70 16 12
71-80 7 1
Chart 1: AGE AND SEX
Table & Chart 1 shows the distribution of age and sex among the cases of DFI. 100 cases studied, most of the patients belonged to the 5
(37%) and (28%) respectively. Males were more affected compared to females with a ratio of 2.3:1.
21-30 31-40
3 4
1 1
28
: AGE AND SEXWISE DISTRIBUTION OF DFI
Table & Chart 1 shows the distribution of age and sex among the cases of DFI. , most of the patients belonged to the 5th and 6th
(37%) and (28%) respectively. Males were more affected compared to females with a
40 41-50 51-60 61-70 71-80
14 26 16 7 4 11 12 1
AGE IN YEARS males females
DFI CASES
Table & Chart 1 shows the distribution of age and sex among the cases of DFI. Of The
th
decades of life (37%) and (28%) respectively. Males were more affected compared to females with a
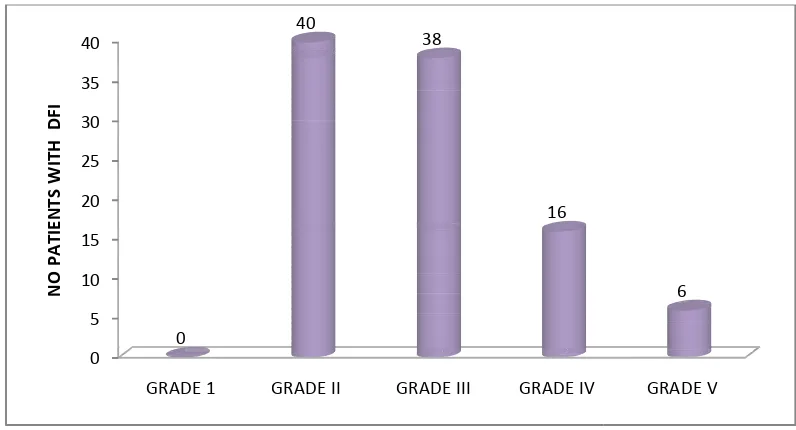
TABLE 2: DISTRIBUTION OF ULCERS ACCORDING TO WAGNER’S CLASSIFICATION
Wagner’s
Grade GRADE I
No. of
Patients with Diabetic foot ulcers
Chart2: DISTRIBUTION OF ULCERS ACCORDING TO WAGNER’S CLASSIFICATION
Distribution of Ulcers According
Chart 2. Maximum number of pat
Wagner’s Grade II (40 nos), followed by 38 DFI patients in 0 5 10 15 20 25 30 35 40 GRADE 1 0 N O P A TI E N TS W ITH D F I 29
DISTRIBUTION OF ULCERS ACCORDING TO WAGNER’S CLASSIFICATION
GRADE I GRADE II GRADE III GRADE IV
0 40 38
: DISTRIBUTION OF ULCERS ACCORDING TO WAGNER’S CLASSIFICATION
f Ulcers According to Wagner’s Classification are listed in Table and
ximum number of patients with Diabetic Foot Ulcers were seen in
Grade II (40 nos), followed by 38 DFI patients in Wagner’s GRADE 1 GRADE II GRADE III GRADE IV
0
40
38
16
DISTRIBUTION OF ULCERS ACCORDING TO WAGNER’S CLASSIFICATION
GRADE IV GRADE V
16 6
: DISTRIBUTION OF ULCERS ACCORDING TO WAGNER’S CLASSIFICATION
o Wagner’s Classification are listed in Table and
ients with Diabetic Foot Ulcers were seen in
Wagner’s Grade III. GRADE V
30
TABLE 3: DISTRIBUTION OF BACTERIAL ISOLATES IN CORRELATION WITH
WAGNER’S GRADE
GRADE I GRADE II GRADE III GRADE IV GRADE V
No of patients with
Diabetic foot ulcers 0 40 38 16 6
No of organisms isolated (Aerobes)
0 40 40 35 10
Average number of micro organisms /sample
0 1 1.05 2.18 1.66
CHART 3: DISTRIBUTION OF AVERAGE NO. OF BACTERIAL ISOLATES PER SAMPLE IN
• Average no of aerobes per sample w
• The average number of microorganism Decreases.
*The number of isolates are more than the number of samples and the average number
of microorganism /sample GRADE I
0
31
CHART 3: DISTRIBUTION OF AVERAGE NO. OF BACTERIAL ISOLATES PER SAMPLE IN
CORRELATION WITH WAGNER’S GRADE
aerobes per sample was found to be maximum in Grade
number of microorganism /sample is decreasing as the Wagner’s
The number of isolates are more than the number of samples and the average number
/sample is more than one because of poly microbial growth yield. GRADE II GRADE III GRADE IV GRADE V
1 1.05
2.18 AVERAGE NO. OF MICRO ORGANISM /SAMPLE
CHART 3: DISTRIBUTION OF AVERAGE NO. OF BACTERIAL ISOLATES PER SAMPLE IN
in Grade 4 ulcers (2.18).
as the Wagner’s grade
The number of isolates are more than the number of samples and the average number
crobial growth yield.
TABLE
Aerobic Growth
No Growth
CHART 4 :
Hundred pus samples were collected from foot ulcers of diabetic patients and assessed
for the growth of aerob
samples 90 yielded aerobic bacterial growth and10 samples did not yield any growth.
[image:45.595.113.515.131.243.2]32
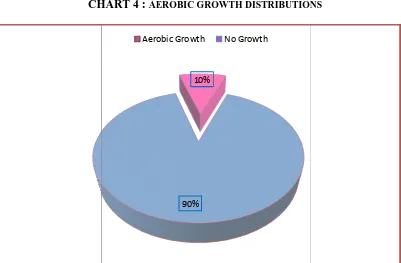
TABLE 4 : AEROBIC GROWTH DISTRIBUTION
Aerobic Growth 90
No Growth 10
CHART 4 : AEROBIC GROWTH DISTRIBUTIONS
Hundred pus samples were collected from foot ulcers of diabetic patients and assessed
for the growth of aerobic organisms and listed in Table 4 & Chart 4. Out of the hundred
samples 90 yielded aerobic bacterial growth and10 samples did not yield any growth. 90%
10%
Aerobic Growth No Growth
AEROBIC GROWTH DISTRIBUTION
90
10
AEROBIC GROWTH DISTRIBUTIONS
Hundred pus samples were collected from foot ulcers of diabetic patients and assessed
ic organisms and listed in Table 4 & Chart 4. Out of the hundred
[image:45.595.108.509.271.534.2]33
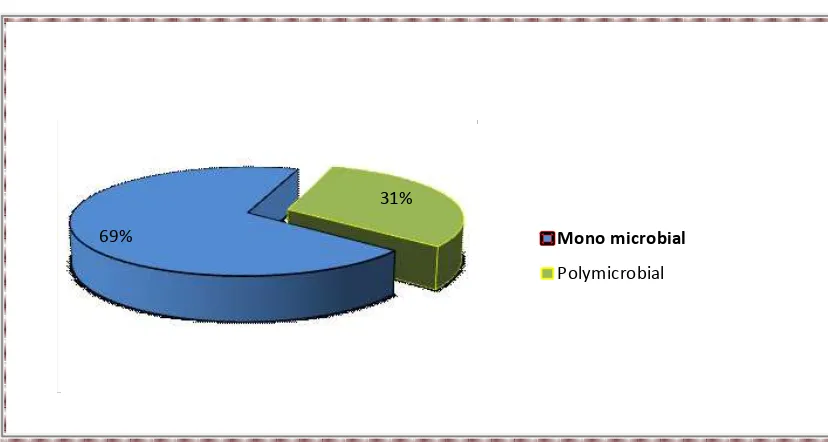
Table-5: POLYMICROBIAL AND MONO-MICROBIAL GROWTH DISTRIBUTION
Growth pattern Number Percentage
Mono microbial 62 69%
Polymicrobial 28 31%
CHART-5: POLYMICROBIAL AND MONO-MICROBIAL GROWTH DISTRIBUTION
The pattern of growth is listed in Table5 & Chart 5 .Out of the 90 culture positive
samples mono microbial growth was found in 62 samples and 28 samples yielded
polymicrobial growth with a percentage of 69 and 31 respectively. 69%
31%
Mono microbial
34
TABLE 6: DISTRIBUTION OF BACTERIAL ISOLATES.
GRAM POSITIVE ISOLATES
No. of aerobes(n=125) Percentage (%)
Staphylococcus aureus
23 18.4
Coagulase negative Staphylococcus( CONS)
8
6.4
Enterococcus fecalis
1 0.8
GRAM NEGATIVE ISOLATES
Proteus sp 29 23.2
Pseudomonas aeruginosa 20 16
E.coli 21 16.8
Klebsiella sp 11 8.8
Enterobacter spp 5 4
Citrobacter freundii 4 3.2
Acinetobacter spp 3 2.4
Chart6
Distribution of aerobic
• Among Gram positive aerobes, Staphylococcus aureus w
Isolate (18.4%).
• Among Gram negative aerobes, Proteus
(23.2%) followed by E.Coli 16.8% and Pseudomonas 16%.
species was the least common isolate Staphylococcus aureus 18% CONS 7% Enterococcus Citrobacter freundii 3% Acinetobacter 2% 35
Chart6: DISTRIBUTION OF BACTERIAL ISOLATES
aerobic bacterial isolates are listed as per Table 6 & Chart 6.
Among Gram positive aerobes, Staphylococcus aureus was the predominant
%).
Among Gram negative aerobes, Proteus spp was the most common isolate
followed by E.Coli 16.8% and Pseudomonas 16%. Acineto
pecies was the least common isolate (2.4%). Staphylococcus
CONS 7% Enterococcus
fecalis
1% Proteus sp
23% Pseudomonas aeruginosa 16% E.coli 17% Klebsiella sp 9% Enterobacter 4% Citrobacter
DISTRIBUTION OF BACTERIAL ISOLATES.
are listed as per Table 6 & Chart 6.
as the predominant
was the most common isolate
36
TABLE 7
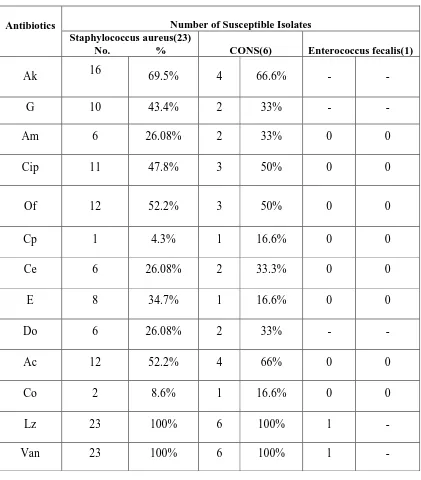
: ANTIMICROBIAL SUSCEPTIBILITY PATTERN OF GRAM POSITIVE COCCIPTO
Antibiotics Number of Susceptible Isolates
Staphylococcus aureus(23)
No. % CONS(6) Enterococcus fecalis(1)
Ak 16 69.5% 4 66.6% - -
G 10 43.4% 2 33% - -
Am 6 26.08% 2 33% 0 0
Cip 11 47.8% 3 50% 0 0
Of 12 52.2% 3 50% 0 0
Cp 1 4.3% 1 16.6% 0 0
Ce 6 26.08% 2 33.3% 0 0
E 8 34.7% 1 16.6% 0 0
Do 6 26.08% 2 33% - -
Ac 12 52.2% 4 66% 0 0
Co 2 8.6% 1 16.6% 0 0
Lz 23 100% 6 100% 1 -
CHART 7
: ANTIMICROBIAL SUSCEPTIBILITY PATTERN OF GRAM POSITIVE COCCITable & Chart 7 shows the
Staphylococcus aureus show
and Amoxyclav & 47.8% to Ciprofloxacin. CONS isolates are
Amikacin. And all these isolates show 100% 0 5 10 15 20 25 Ak G Am Enterococcus 37
ANTIMICROBIAL SUSCEPTIBILITY PATTERN OF GRAM POSITIVE COCCI
Table & Chart 7 shows the Antimicrobial Susceptibility Pattern of Gram Positive Cocci
Staphylococcus aureus showing sensitivity of 26% to Cefotaxime,
clav & 47.8% to Ciprofloxacin. CONS isolates are 66% sensitiv
ll these isolates show 100% sensitivity to Vancomycin Am Cip
Of Cp
Ce E
Do Ac
Co
Enterococcus CONS S.aureus
ANTIMICROBIAL SUSCEPTIBILITY PATTERN OF GRAM POSITIVE COCCI
Antimicrobial Susceptibility Pattern of Gram Positive Cocci.
52% to Ofloxacin
66% sensitive to
ancomycin and Linezolid.
Co Lz
38
TABLE 8: ANTIMICROBIAL SUSCEPTIBILITY PATTERN OF GRAM NEGATIVE ISOLATES
AEROBES
Cot Amp Ak G Cip Of Caz Ctx Ci Ac Cfs Pit Mrp
Proteus(29) 10 4 13 11 15 20 13 22 24 8.4 24 29 -
34% 15% 46% 34% 53% 69% 46% 76% 84% 26% 84% 100%
Pseudomonas spp (20)
- 0 2 2 9 9 10 9 8 11 14 19 19
10.5% 10.5% 47% 47% 52% 47% 42% 57% 68% 94% 100%
E.coli (21) 2 11 17 12 10 7 9 16 15 6 21 21 --
11% 52% 82% 58% 47% 42% 47% 76% 70% 29% 100% 100%
Klebsiella Pneumonia(11)
1 3 6 6 11 10 7 7 7 4 4 11 -
12.50% 25% 50% 50% 100% 87.5% 62.5% 62.5% 62.5% 37.5% 87.5% 100%
Enterobacter Species(5)
2 2 3 2 5 5 3 4 4 3 5 5 -
40% 40% 60% 40% 100% 100% 60% 80% 80% 60% 100% 100%
Citrobacter freundii(4)
2 3 3 3 3 3 3 4 4 3 4 4 -
50% 75% 75% 75% 75% 75% 75% 100% 100% 75% 100% 100%
Acinetobacter sp.(3)
1 1 3 2 3 3 2 2 2 2 3 3 -
33.30% 33.30% 100% 50% 100% 100% 66% 66% 66% 66% 100% 100%
• Proteus sp showed 100% sensitivity to Piperacillin with tazobactum, 84% to Cefaperazone with sulbactum and
Ceftriaxone,
76%. sensitivity to Cefotaxime, 53% to Ciprofloxacin and 46% to amikacin.
• Pseudomonas sp showed 100% sensitivity to Meropenum followed by 94% to Piperacillin with tazobactum,
68% to Cefaperazone with sulbactum, 52% to Ceftazidime, and 47% to Ciprofloxacin. Amikacin and Gentamicin showed 10.5% sensitivity.
• Escherichia coli showed highest sensitivity to Piperacillin with tazobactum and Cefaperazone with sulbactum,
CHART 8: ANTIMICROBIAL SUSCEPTIBILITY PATTERN OF GRAM NEGATIVE ISOLATES
0 5 10 15 20 25 30
Cot
Ctx
39
8: ANTIMICROBIAL SUSCEPTIBILITY PATTERN OF GRAM NEGATIVE ISOLATES
Amp Ak G Cip Of Caz
Ci Ac Cfs Pit Mrp
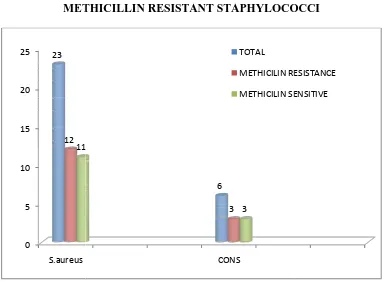
Table 9: DISTRIBUTION OF METHICILLIN
METHICILLIN RESISTANT STAPHYLOCOCCI
Staphylococcus aureus
CONS
CHART 9: DISTRIBUTION OF METHICILLIN SENSITIVE & METHICILLIN RESIST
As evident from Table & chart 9,
methicillin resistance.
resistant (55%) and 11 were
Methicillin resistance. 0 5 10 15 20 25 S.aureus 23 12 11 40
Table 9: DISTRIBUTION OF METHICILLIN SENSITIVE & METHICILLIN RESISTANT STAPHYLOCOCCI
Total No Isolated Methicillin Resistant Staphylococci Methicillin Sensitive Staphylococci
aureus 23 12
6 3
9: DISTRIBUTION OF METHICILLIN SENSITIVE & METHICILLIN RESISTANT STAPHYLOCOCCI
As evident from Table & chart 9, antimicrobial susceptibility testing revealed the
methicillin resistance. Among 23 Staphylococcus aureus isolates 12 were Methicillin
resistant (55%) and 11 were methicillin sensitive. CONS isolate CONS 6 3 11 3 TOTAL METHICILIN RESISTANCE METHICILIN SENSITIVE SENSITIVE & METHICILLIN RESISTANT STAPHYLOCOCCI
Methicillin Sensitive Staphylococci
11
3
9: DISTRIBUTION OF METHICILLIN SENSITIVE & ANT STAPHYLOCOCCI
antimicrobial susceptibility testing revealed the
isolates 12 were Methicillin
isolates exhibited 50% METHICILIN RESISTANCE
41
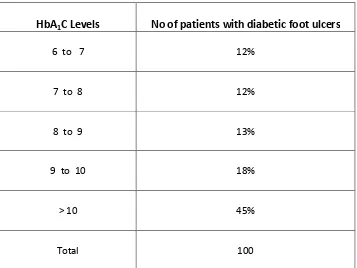
TABLE 10: CORRELATION BETWEEN HBA1C LEVELS AND
DIABETIC FOOT ULCERS
HbA1C Levels No of patients with diabetic foot ulcers
6 to 7 12%
7 to 8 12%
8 to 9 13%
9 to 10 18%
> 10 45%
42
CHART 10: CORRELATION BETWEEN HBA1C LEVELS AND
DIABETIC FOOT ULCERS
• Maximum No. of DFI patientshad HbA1C levels more than 10.
• The number of patients having HbA1C levels above 8 was 76%.
0 10 20 30 40 50 60 70 80 90 100
6 to 7
7 to 8
8 to 9
9 to 10
> 10 Total
12 12 13 18
43
Table`11: CORRELATION BETWEEN HBA
1C LEVELS AND WAGNER'SGRADES
Wagner's Grade I
Wagner's Grade II
Wagner's Grade III
Wagner's Grade IV
Wagner's Grade V
Total
6 to 7 0 6 6 0 0 12
7 to 8 0 6 3 1 2 12
8 to 9 0 6 4 2 1 13
9 to 10 0 4 8 4 2 18
> 10 0 18 17 9 1 45
44
Chart`11: CORRELATION BETWEEN HBA
1C LEVELS AND WAGNER'SGRADES
Table 11 & Chart 11 Shows The Correlation Between HbA1c Levels And Wagner's
Grades.
Maximum no of cases (45) were recorded with HbA1C levels of >10
0
5
10
15
20
25
30
35
40
6 t o 7 7 t o 8 8 t o 9 9 t o 1 0 > 1 0 T o t a l N o o f p a t ie n t sHbA1C levels
Wagner's Grade I
Wagner's Grade II
Wagner's Grade III
Wagner's Grade IV
[image:57.595.137.496.186.550.2]45
TABLE12:
CORRELATION BETWEEN HbA
1C LEVELS AND MICROBIAL GROWTH.HbA1C Levels No of
Mono microbial
No of Polymicrobial
6 to 7 7 2
7 to 8 10 5
8 to 9 8 4
9 to 10 9 4
> 10 28 13
Total 62 28
[image:58.595.146.484.184.441.2]46
CHART12: CORRELATION BETWEEN HbA1C LEVELS AND MICROBIAL
GROWTH
The total distribution of Mono microbial and polymicrobial growth was 62 and 28
respectively with the maximum number of growth recorded in HbA1C levels of
more than 10. 0
10 20 30 40 50 60 70 80 90
6 to 7 7 to 8 8 to 9 9 to
10
>10 Total
7 10 8 9
28
62
2 5 4 4
13
28
HbA1C levels
47
TABLE 13: CORRELATION BETWEEN HBA1C LEVELS AND MRSA
HbA1C Levels MRSA MSSA
<8 3 3
8 to 10 3 3
> 10 6 5
CHART 13: CORRELATION BETWEEN HBA1C LEVELS AND MRSA
The Table 13 & Chart 13 reveals the correlation between HbA1C levels and MRSA. Of the
23 Staphylococcal isolates MRSA constitutes 50% in HbA1C Levels of <8 and 8 to 10 and
55% in HbA1C Levels of > 10
0 2 4 6 8 10 12
<8 8 to 10 > 10 HbA1C Levels
3 3
6
3 3
5
MSSA
Staphylococcus aureus on Blood agar
Staphylococcus aureus on Nutrient agar
Pseudomonas on Blood agar
Pseudomonas on Nutrient agar
Biochemical Reactions of Pseudomonas
Proteus on Blood agar
Proteus on Nutrient Agar
BioChemical Reactions of Proteus
Klebsiella on MacConkey agar
Klebsiella on Blood agar
Biochemical Reactions of Klebsiella
Staphylococcus aureus with Methicillin Resistance
Staphylococcus aureus with Methicillin Sensitivity Staphylococcus aureus with Methicillin Resistance
Staphylococcus aureus with Methicillin Sensitivity Staphylococcus aureus with Methicillin Resistance
HbA1C Analyser BIO RAD
48 DISCUSSION
Worldwide, Diabetic foot lesions are causing major medical, social and economic
problems and the leading cause of hospitalization for patients with diabetes54. Diabetic foot infection is considered as one of the most threatening and disabling complication for
a diabetic patient as the lesions of the extremities can become so severe that the patient
may risk the amputation of the toe, foot or leg6,46.
Because of serious or recurrent infections and impaired healing processes,
initially trivial lesion may progress to chronic non healing wounds, gangrene, or
untreatable infections that can lead to limb amputation55. Many Diabetic foot ulcers are neglected because they may produce few symptoms and their importance is not
appreciated by the patients28. Patients who develop foot lesions have significantly less knowledge of diabetes including foot care56.
Hundred pus and wound samples were collected from patients above 20 years of
age with known history of Diabetes mellitus, most of the patients belonged to the 5th and 6th decades of life (37% ) and (28%) respectively .This coincides with the studies listed below by other authors. The mean age of the patients was 59.5 years in Kahn et al study
59
49
In our study the males were more affected compared to females with a ratio of
2.3:1. This was in concordance with the following studies, D.Vijay et al21 in 2000 observed a preponderance of male patients showing diabetic foot ulcers (72.5%)
compared to female patients (27.5%) The ratio of male to female was 2.6:1. In a study by
Dipali AC et al 6 in 2002, 67% of male patients with diabetic foot ulcers were reported against 32.4% of female patients with a ratio of 2.1:1. Prevalence of 58.5% of male
patients and 41.2% of female patients with a ratio of 1.41:1 was noted in a study by Fiaz
Ur Rehman et al in 2002. Anandi et al1 2004 observed a difference of 65.4% and 54.6% among male and female patients with a ratio of 1.2:1. All the above authors have
observed a preponderance of males in their study.
In our study most of the ulcers belonged to grade II of Wagner’s classification
(40) followed by Grade III. The above data correlates with the results published by
V.Vijay et al showing 50% grade II ulcers followed by 26.5% grade III Ulcers21.
Out of the hundred samples 90 yielded aerobic bacterial growth and 10 samples
did not yield any growth in our study. In a study by Mohanty et al in 2002, out of the
5,039 pus samples, 2437(48.36%) were culture positive while 1831(33.33%) was culture
negative69.
In the present study the highest average no of isolates per sample was found in
Grade 4 ulcers (2.18). In a prospective study of Diabetic foot ulcers conducted by Ekta
50
200433 an average of 3.7 organisms were yielded per sample. The yield from the deep tissue samples was significantly higher than the yield from surface swab samples.
Our study showed 31% of polymicrobial infections similar to Ekta Bansal et al
study11 showing 35% polymicrobial infection. In Contrast polymicrobial growth was noted as 64.4% in a study conducted by C.Aanandi et.al, from Tamil Nadu India1. Out of the 427 positive cultures 83.8% were polymicrobial, in a clinical trial conducted by Diane
M Ceitron et al, at R.M.Alden Research Laboratories California 55. It’s because the maximum number of patients in these two studies belonged to Wagner’s Grade III, but in
our study the maximum number of patients with polymicrobial growth were in the
Wagner’s Grade II.
In our study among the enterobacteriaceae isolates, Proteus mirabilis was the most
common isolate (23.2%) followed by E.Coli(16.87%) & Klebsiella8.8% . Citrobacter
freundii was the least common isolates belonging to the enterobacteriaceae family which
is similar to the study by Uday Kelkar et al(2004)33 Proteus mirabilis, Escherichia coli, Pseudomonas aeruginosa, Klebsiella species and Enterococcus species were organisms
isolated in decreasing order .
But in Ami Variyae et al study Klebsiella pneumonia (59.7%) was the most
common isolate followed by E.coli 40.29% 49 . Similar results were shown in a study conducted by Emily . S. Bomasang et al. with 45.8% of E. coli45.
In a study by Ashwin N Anantha Krishnan Et al. 21 % of E. coli were isolated 38 . This difference in common isolate in different studies might be due to different grade of
51
the highest isolate, Acinetobacter species was the least common isolate (2.4%). In a
study conducted by Vishwanath et al51 Pseudomonas species was accounting for 17% of the isolates which is similar to our study. Pseudomonas aeruginosa was the most common
isolate accounting for 21.7% in Ekta banzal et al study11.
Staphylococcus aureus showing sensitivity of 26% to Cefotaxime, 47.8% to
Ciprofloxacin and 52% to Ofloxacin and Amoxyclav. CONS isolates are 66% sensitive
to Amikacin and 100% sensitive to Vancomycin. And all these isolates show 100%
sensitivity to Vancomycin and Linezolid. Out of the 23 Staphylococcus aureus isolates
12 isolates were methicillin resistant (55%) and 11 isolates were found to be MSSA
(45%).In a study by C.N. Dang et al 42 MRSA was 30.2 %. 42.86 % of MRSA was seen in a study conducted by Murugan S. et al 66 while assessing the prevalence of MRSA among diabetic Ulcer patients which correlates with our study .
In our study MRSA were 100 % resistant to Ampicillin, 65% to Erythromycin &
70% to Cephalexin .100% sensitivity was noted to Vancomycin and Linezolid. In a study
by Sivaram Uma Devi Et al. 65% of the 29 Staphylococcus aureus isolates were found to
be methicillin resistant 66. Resistance to Penicillin was 100%, Erythromycin was 31 %. and Gentamicin was 59%. Sensitivity was higher to Vancomycin. They were of the
opinion that combination of Vancomycin and Linezolid for coverage of Gram Positive
Cocci could be used empirically and then tailored to the needs of the individual once
Figure


Outline
Related documents
Muram cahaya, lampu-lampu di dalam salon ‘La Perla’ (Mutiara), berkurang cahayanya, tetapi cahaya paling jernih hanya bersinar melalui pintu terbuka salon; di atasnya ada lengkungan,
Make a list of topics that you want to research and write about. If your teacher has assigned you a specifi c subject area, generate ideas and questions based on that. If
Provides an analytical synopsis of five books on race and power by Cornel West (1993a, 1993b, 2001, 2004, 2014) that seek to add to and deepen multicultural foundations
ex: Can measure your body’s temp with thermometer but can’t measure temp of drop of water with it, since contact between the thermometer and drop can change the drop’s temp.... Cup
That free pentoses actually exist in these alcoholic extracts is also borne out by the following facts. When portions of the aqueous solution A of our scheme are fermented as
In view of the fact that all these molecules were newly synthesized and that no biological test was done with them, we thought that molecular-dynamic calculations and simulations
Conclusions: The findings of this study suggest that, adiponectin concentrations independent on BMI as a measure of adiposity, were mostly linked to insulin sensitivity and not
Tang J, Liu Y, Qi D, Yao G, Deng C, Zhang X: On ‐ plate ‐ selective enrichment of glycopeptides using boronic acid ‐ modified gold nanoparticles for direct MALDI ‐ QIT ‐ TOF
