DIASTOLIC DYSFUNCTION IN TYPE 2
DIABETES AND ITS CORRELATION WITH
MICROVASCULAR COMPLICATIONS
Dissertation submitted in partial fulfillment of requirements for
M.D. DEGREE IN GENERAL MEDICINE
BRANCH I
of
THE TAMILNADU Dr. M.G.R. MEDICAL UNIVERSITY,
CHENNAI, INDIA.
MADRAS MEDICAL COLLEGE,
CHENNAI 600003
CERTIFICATE
This is to certify that the dissertation entitled “DIASTOLIC DYSFUNCTION IN TYPE 2 DIABETES AND ITS CORRELATION WITH MICROVASCULAR COMPLICATIONS” is a bonafide work done by Dr.VIJAY SHEKAR P, at Madras Medical College, Chennai in partial fulfillment of the university rules and regulations for award of M.D., Degree in
General Medicine (Branch-I) under my guidance and supervision during the
academic year 2010 -2013.
Prof.K.SIVASUBRAMANIAN M.D., Professor,
Guide & Research Supervisor, Institute of Internal Medicine, Madras Medical College &
Rajiv Gandhi Govt. General Hospital, Chennai – 3.
Prof.V.KANAGASABAI M.D., The Dean
Madras Medical College & Rajiv Gandhi Govt. General Hospital,
Chennai – 3.
Prof.N.RAGHU M.D.,
Director and Professor, Institute of Internal Medicine, Madras Medical College &
DECLARATION
I solemnly declare that this dissertation entitled “DIASTOLIC DYSFUNCTION IN TYPE 2 DIABETES AND ITS CORRELATION WITH MICROVASCULAR COMPLICATIONS” was done by me at Madras Medical College and Rajiv Gandhi Government General Hospital,
during 2010-2013 under the guidance and supervision of, Prof.K.SIVASUBRAMANIAN, M.D. This dissertation is submitted to the Tamil Nadu Dr.M.G.R. Medical University towards the partial fulfillment of
requirements for the award of M.D. Degree in General Medicine (Branch-I).
Place: Chennai
Date:
Dr. P. VIJAY SHEKAR, MD GENERAL MEDICINE,
Postgraduate Student,
Institute of Internal Medicine,
Madras Medical College,
ACKNOWLEDGEMENT
At the outset, I thank Prof.V.KANAGASABAI M.D., Dean, Madras Medical College and Rajiv Gandhi Government General Hospital, Chennai-3 for having
permitted me to use hospital resources for the study.
I am grateful to Prof.N.RAGHU, M.D., Director and Professor, Institute of Internal Medicine, Madras Medical College and Rajiv Gandhi Government
General Hospital, Chennai-3.
I am indebted to Prof.K.SIVASUBRAMANIAN, M.D., Professor of Medicine, Institute of Internal Medicine, Madras Medical College and Rajiv
Gandhi Government General Hospital, Chennai-3 for his valuable guidance.
I would like to thank Dr. S. APARNA M.D., Dr.A.MURUGESAN M.D., Dr.G.RAJAN M.D., Dr.S.GOPALAKRISHNAN M.D., Assistant Professors, Madras Medical College and Rajiv Gandhi Government General Hospital,
Chennai-3 for their scrutiny.
I would also like to thank all the professors and assistant professors of the
Department of Cardiology, Institute of Diabetology and the Department of
Biochemistry for their continuous support and expert guidance.
I express my sincere gratitude to all the patients who participated in the study.
Lastly, I thank all my professional colleagues for their support and valuable
TABLE OF CONTENTS
S.NO
TITLE
PAGE NO
1
INTRODUCTION
1
2
AIM OF THE STUDY
3
3
REVIEW OF LITERATURE
4
4
MATERIALS AND METHODS
46
5
OBSERVATIONS AND RESULTS
53
6
DISCUSSION
73
7
CONCLUSION
80
BIBLIOGRAPHY
ANNEXURES
ABBREVIATIONS
PROFORMA
MASTER CHART
ETHICAL COMMITTEE APPROVAL ORDER
TURNITIN-PLAGIARISM SCREEN SHOT
1
INTRODUCTION
Type 2 diabetes mellitus is an established risk factor for cardiovascular
events and the development of congestive cardiac failure, through its
association with hypertension and coronary artery disease. The existence of
myocardial dysfunction in diabetic subjects even in the absence of ischemic,
valvular and hypertensive heart disease was proposed by Rubler et al. in
1972 and subsequently abnormalities in both systolic and diastolic functions
have been demonstrated.
Diastolic dysfunction has been described as an early sign of diabetic heart
muscle disease preceding the systolic damage. Diastolic abnormalities in
normotensive type 2 diabetic patients without coronary artery disease and
clinical evidence of heart failure was demonstrated by Regan et al. using
cardiac catheterization and subsequently by noninvasive techniques such as
Doppler echocardiography.
Diastolic dysfunction is independently associated with increased all-cause
mortality as well as cardiovascular mortality in a population based sample
of middle aged and elderly adults. The impact of isolated diastolic
dysfunction in diabetes concerns exercise tolerability. It influences
maximal treadmill performance and explains lower maximal performance
2
Diabetic complications can be classified broadly as microvascular and
macrovascular complications. The influence of diabetic complications on
diastolic dysfunction has been investigated in several studies.
Abnormalities have been observed especially in population of diabetic
patients with severe microvascular complications as evidenced by marked
proteinuria and proliferative retinopathy.
Studies (Takenakaet al.(1988), Hiramatsuet al.(1992),Annonuet al(2001))
performed in diabetic patients free of coronary artery disease, have
demonstrated that patients with mild to severe retinopathy exhibited LV
diastolic dysfunction. This relation with retinopathy, was however
constantly not found.
Sampson et al(1990) found a significantly higher proportion of abnormal
diastolic dysfunction in the group of diabetes with proteinuria. Watschinger
et al.(1993) and Guglielmi et al.(1995) demonstrated LV diastolic
dysfunction, whereas controls without microalbuminuria showed no
diastolic impairment.
The pathogenesis of diastolic dysfunction in type 2 diabetic patients is not
completely elucidated. The relation of microvascular complications with
diastolic dysfunction in type 2 diabetics suggests that diabetic
3
AIM OF THE STUDY
Primary Objectives
To assess the diastolic dysfunction in type 2 diabetic patients using Doppler
echocardiography.
Secondary Objectives
To find out the correlation between diastolic dysfunction and microvascular
4
REVIEW OF LITERATURE
Diabetes mellitus has been a disease known to the society from time
immemorial. Descriptions of patients presenting with folliculitis, weight
loss, polyuria and urine that attracted ants have been found in writings from
earliest civilizations of Asian and Indian origin1. Since then, descriptions
and our understanding of this disorder have kept growing as evidenced from
reports all across the globe.
What started in 17th century as tasting human urine to detect blood sugar
levels has now grown into sophisticated laboratory diagnostic testing. And it
does not stop here. With growing technology, our insight into the disease, its
complications and the possible pathogenesis keeps growing. This
development is essential, as supported by the growing pandemic of diabetes.
It has been estimated that nearly 285 million people are affected by diabetes
mellitus by the year 2010 and it shows no signs of regression in the near
future. The estimates continue to increase with atleast 438 million people to
be affected by the year 20302. Diabetes mellitus being the most common
cause of end stage renal disease (ESRD), non-traumatic lower limb
amputations and blindness in the United States, is an indication of how
much health burden the disorder can cause. It lays emphasis on treating the
complications aggressively but more important would be to detect the
5
UNDERSTANDING DIABETES MELLITUS:
Diabetes mellitus is a group of metabolic disorders resulting in
hyperglycemia with disturbances in carbohydrate, fat and protein
metabolism. Hyperglycemia may result from a defect in insulin secretion,
insulin action or both. Hyperglycemia when present for a long period of
time leads to a host of metabolic abnormalities and also results in end organ
damage.
With previous classifications of diabetes being based upon the age of onset
and requirement for insulin, presently the emphasis is on the underlying
pathogenic process. Diabetes mellitus is classified broadly as Type 1 and
Type 2 although other subtypes do exist. Type 1 diabetes mellitus results
from complete or near total insulin deficiency whereas type 2 diabetes
mellitus is a result of combination of insulin resistance, impaired insulin
secretion and increased glucose production.
The etiologic classification of diabetes as recommended by the WHO and
6
Type 1 diabetes mellitus
Type 2 diabetes mellitus
Other specific types of diabetes:
1. Genetic defects of beta cell function
2. Genetic defects of insulin secretion
3. Diseases of exocrine pancreas
4. Endocrinopathies
5. Drugs/chemical induced
6. Infections
Gestational diabetes
Since our study is limited to the population of type 2 diabetes, further
discussion is restricted to type 2 diabetes, its pathogenesis and
7
TYPE 2 DIABETES MELLITUS
EPIDEMIOLOGY AND RISK FACTORS:
Type 2 diabetes is the most common form of diabetes. Previously termed as
non-insulin dependent diabetes, type 2 diabetes occurs as a result of a
combination of insulin resistance, impaired insulin secretion and increased
glucose production.
Although the incidence of both type 1 and type 2 diabetes is increasing,
type 2 diabetes has become a rapidly growing pandemic attributed to factors
like increased prevalence of obesity and increased aging. Type 2 diabetes
though present worldwide, the highest prevalence is in the Pacific islands
and Middle East. Not only does the prevalence rate vary in different
geographic regions, but the pattern of presentation also varies. Patients from
Asian ethnicity have an intermediate prevalence pattern (7-9% of the total
population) and phenotypically differ from the rest of the world by having a
lower BMI, younger age at onset, presence of greater visceral adiposity and
a decreased insulin secretory capacity.
These patients may not require insulin at the time of diagnosis, but may
require insulin later in the disease course for glycemic control. Type 2
diabetes patients usually have a gradual onset of hyperglycemia and hence
8
polyphagia. Although type 2 diabetes is undiagnosed in many due to lack of
symptoms, the risk of developing complications remain the same. So there
is a need to screen people at a higher risk of developing diabetes.
Risk factors for developing type 2 diabetes include
1. Family history of diabetes (i.e., parent or sibling with type 2
diabetes)
2. Obesity (BMI >25 kg/m2)
3. Physical inactivity
4. Race/ethnicity (e.g., African American, Latino, Native American,
Asian American, Pacific Islander)
5. Previously identified with IFG, IGT, or an HbA1C of 5.7–6.4%
6. History of GDM or delivery of baby >4 kg (9 lb)
7. Hypertension (blood pressure 140/90 mmHg)
8. HDL cholesterol level <35 mg/dL (0.90 mmol/L) and/or a
triglyceride level >250 mg/dL (2.82 mmol/L)
9. Polycystic ovary syndrome or acanthosis nigricans
10. History of cardiovascular disease3
PATHOGENESIS
The two important pathogenic mechanisms implicated in type 2 diabetes are
9
factors, environmental factors and obesity either in single or in
combination.Insulin resistance may result from mutations in the insulin
receptor or polymorphisms of insulin signaling pathways. The genetic basis
for type 2 diabetes is supported by the fact that the concordance of type 2
diabetes among identical twins is more than 70%. Individuals with both
parents having diabetes carry a risk of 40% of developing diabetes.
Variation of transcriptor factor 7 gene has been associated with impaired
glucose tolerance and diabetes mellitus.
Data suggest that inflammation and diabetes are closely related. Adipose
tissue besides being a principal storage site of energy, also acts as an
endocrine organ. Obesity mediates insulin resistance by elaborating
inflammatory cytokines (adipokines). Adipocyte cell size highly correlates
with insulin resistance and the risk of developing type 2 diabetes4. Visceral
obesity, which includes both mesenteric and omental fat deposits correlates
better than overall obesity5. Proposed mechanisms include an unrestrained
lipolysis with an increased delivery of free fatty acids (FFA) to the portal
circulation.
Another contributory pathogenic mechanism is the decrease in insulin
secretion due to a beta cell dysfunction. During the early phase, beta cells
increase insulin release in an attempt to compensate for insulin resistance.
10
function. To start with, the insulin secretory defect is limited to the glucose
stimulated insulin secretion. Eventually, there is decrease in overall insulin
secretory capacity. There is also a reduction in the mass of the beta cells.
Type 2 diabetes is also associated with amyloid deposition in the islet cells.
Whether amyloid deposition is a cause or effect remains a controversy.
Any given patient with type 2 diabetes, at the time of diagnosis, will have
both insulin resistance and beta cell dysfunction in varying degrees.
COMPLICATIONS
Chronic
complications of
diabetes
Vascular
Microvascular
(retinopathy,
neuropathy,
nephropathy)
Macrovascular
(Stroke, CAD,
PAD)
Non vascular
Gastoparesis,
skin disease,
11
The complications of type 2 diabetes can be acute or chronic. Chronic
complications are primarily responsible for morbidity and mortality of
diabetes. Chronic complications may be vascular or nonvascular in nature.
Vascular complications of diabetes can be classified into microvascular and
macrovascular complications.
Macrovascular complications include coronary artery disease, peripheral
arterial disease and cerebrovascular accidents (stroke).Traditionally
microvascular complications have been described under the headings of
neuropathy, nephropathy and retinopathy.
PATHOGENESIS OF MICROVASCULAR COMPLICATIONS:
There is a need to understand the molecular and cellular mechanisms of
microvascular complications in order to device strategies that will aim at
treatment and prevention of these complications. Chronic hyperglycemia
and associated metabolic abnormalities due to a insulin secretory defect or
insulin resistance have profound influences on the cellular function,
extracellular matrix and organ function. The important mechanisms that
contribute to microvascular complications are
a) Sympathetic nervous system: Overactivity of sympathetic nervous
12
stages of diabetes, sympathetic denervation occur leading to altered
vascular responses.7
b) Renin angiotensin aldosterone system (RAAS): RAAS plays an
important role in the development of hypertension, cardiovascular
disease and diabetic nephropathy. Various studies have demonstrated
the role of angiotensin II (AT II) in the pathology of vascular
complications of diabetes. Both the tissue RAAS and local RAAS
play an important role. Local RAAS present in the pancreas and
adipocytes also contributes to the pathogenesis.
c) Advanced glycation end(AGE) products: AGE products are formed
by nonenzymatic reactions between glucose and proteins. The most
common AGE product is carboxymethyl lysine.8 These compounds
react with specific receptors (RAGE) and interfere with vascular
signaling, alters the properties of extracellular matrix and alters
matrix cell interactions of the endothelial cells. AGEs also induce the
elaboration of growth factors and increase the production of reactive
oxygen species.9
d) Oxidative stress: It is an imbalance between reactive oxygen species
and cellular antioxidant mechanisms. Patients with diabetes have a
decreased levels of intracellular glutathione, which correlates with the
13
oxidative stress through inhibition of pentose phosphate
pathway(primary source of NADPH), generation of super oxides
from mitochondria, increasing the activity of vascular NADPH
oxidase and inhibiting NO mediated endothelial function.
e) Hexosamine pathway and O-linked glycosylation: Diabetes increases
the activity of hexosamine pathway and post translational
glycosylation of proteins resulting in elaboration of growth factors.11
f) Activation of protein kinase C (PKC) pathway: Although 12 different
isoforms of PKC exist, beta 2 isoform of PKC is activated in
particular especially in the retina and renal glomeruli. Activation of
vascular PKC results in an impaired endothelium mediated
vasodilation thus contributing to a pathological microvascular
change.12
g) Growth factors: The following growth factors may act separately or in
concert to produce microvascular changes. The important growth
factors implicated are vascular endothelial growth factor (VEGF),
platelet derived growth factor (PDGF), transforming growth factor
beta (TGF beta), connective tissue growth factors and growth
hormone/insulin like growth factor.
h) Endothelium derived factors: There occurs an imbalance between the
14
endothelium. In diabetes there is an increased production of
endothelin (a powerful vasoconstrictor) and decreased production of
nitric oxide and prostacyclins.13 A widespread endothelial
dysfunction is a prominent feature of diabetes.
Although our knowledge on the sequence of these pathways is incomplete,
drugs that target these signaling pathways can reduce microvascular
complications, in addition to glycemic control which is of prime
importance.
DIABETIC NEPHROPATHY
Diabetic nephropathy occurs in 30- 50% of patients with type 2 diabetes.14
Although the natural history of diabetic nephropathy is less well understood
in type 2 diabetes, it is estimated that nephropathy develops only after 5 -10
years of the disease. The incidence of diabetic nephropathy is increasing
rapidly due to growing pandemic of diabetes. And more patients with
diabetic nephropathy reach ESRD because the longevity of diabetic patients
is increased due to availability of better drugs for control of cardiovascular
risk factors.
Risk factors for nephropathy
1. Genetic factors: Familial clustering of diabetic nephropathy and ACE
15
2. Duration of diabetes
3. Hypertension
4. Hyperglycemia
5. Smoking: Smoking causes vasoconstriction, platelet dysfunction and
coagulation abnormalities which accelerates vascular damage.
Though the cellular and molecular mechanism of nephropathy has already
been briefed, two factors which are responsible for progression of a diabetic
nephropathy require special mention- hypertension and proteinuria.
Hypertension is not only a consequence of renal damage, but it plays an
important role in the genesis and progression of nephropathy. There is a
significant correlation between blood pressure levels and drop in glomerular
filtration rate. Proteinuria is an independent and strong predictor of decline
in renal function. Excessive protein load leads to tubulointerstitial damage
and contribute to disease progression. A model of how hypertension and
16
The natural history of type 2 diabetes has a predictable course of events. In
the initial stages of diabetes, there is glomerular hyperfiltration stage
characterized by an increase in GFR.
After a period of 5-10 years, patient starts excreting small amounts of
protein termed as microalbuminuria. This stage is known as the stage of
incipient nephropathy.16 Microalbuminuria is defined as excretion of 30-
Glomerular capillary hypertension
Increased glomerular permeability to proteins
Increased filtration of plasma protein
Increased reabsorption of protein and accumulation in proximal tubular cells
Release of fibrogenic cytokines
17
299 mg/24 hour urine sample or 30-299 µg/mg of creatinine in a spot
sample. Microalbuminuria is the earliest marker of diabetic nephropathy.
Once microalbuminuria sets in, the patient develops hypertension and
progresses over a period of 5- 10 years to macroalbuminuria. 50% of
individuals with microalbuminuria progress to macroalbuminuria. This
stage is the stage of overt nephropathy Macroalbuminuria is defined by
albumin excretion of >300 mg/day or > 300 µg/mg of creatinine.
Patients who develop macroalbuminuria develop ESRD over a period of 5-7
years. Although a variety of genetic and physiological markers are available
to determine which group of patient will progress to overt nephropathy and
ESRD, till date there is no standard to ascertain this.
Microalbuminuria in diabetes
Microalbuminuria is defined as excretion of 30 – 299 mg albumin per 24
hour in atleast two out of three consecutive non ketotic sterile samples. It
refers to the amount of albumin which cannot be detected by the
conventional dipstick methods.43 Under normal circumstances the amount of
albumin excreted in 24 hours is less than 30 mg.
The pathogenic mechanism of microalbuminuria in diabetes needs to be
revisited here. Albumin is a negatively charged particle and has a physical
18
of 4 nm, but the negative charge of the glomerular basement membrane
repels the albumin.
During the early stages of diabetes, the negative charge in the glomerular
basement membrane is lost due to a loss of heparin sulphate. As a
consequence, albumin is freely filtered across the basement membrane
which appears in the urine. As the disease progresses the basement
membrane architecture is distorted resulting in loss of large molecular
weight proteins as well.43
The presence of microalbuminuria not only is an early marker of diabetic
nephropathy but also carries much more significance. Microalbuminuria is
also a marker of cardiovascular disease and is a predictor of mortality in
diabetic nephropathy patients.44 What is more important is that
microalbuminuria identifies nephropathy at a stage when it is potentially
treatable and reversible. Hence estimation of microalbuminuria is of prime
19
NATURAL HISTORY OF DIABETIC NEPHROPATHY43
Stage of nephropathy Glomerular filtration rate(GFR) Urine protein excretion Histopathological changes in the
kidney
Stage of
hyperfiltration Increases Normal
Hypertrophy/increased
kidney volume
Incipient
nephropathy Normal/increased
30- 299
mg/day
Basement membrane
thickening
Overt
nephropathy Decreased
>300
mg/day
Glomerular occlusion
and mesangial
expansion
End stage renal
disease(ESRD) GFR<15 ml/min Present Scarring and fibrosis
It is important to understand the natural history to device treatment
strategies and prevent the progression of the disease. Once
macroalbuminuria develops the pathological changes are irreversible.
Hence, it is important to identify nephropathy at an earlier stage i.e. the
stage of incipient nephropathy. Once microalbuminuria is identified, it
20
DIABETIC RETINOPATHY
Diabetic retinopathy is a highly specific vascular complication of type 2
diabetes. Diabetes is the leading cause of blindness. The duration of diabetes
is an important risk factor for the development of retinopathy. More than 60
% of diabetic patients will have some changes of retinopathy after a period
of 20 years.17
Diabetic retinopathy is classified into two stages: non proliferative diabetic
retinopathy and proliferative retinopathy. Clinically significant macular
edema and vitreous hemorrhage are important causes of blindness in a
patient with diabetic retinopathy.
The various retinal lesions that are found in a case of diabetic retinopathy
are:
a) Micro aneurysms: Micro aneurysms are one of the earliest findings in
diabetic retinopathy. They are saccular outpouchings of the retinal
vasculature and occur as a result of endothelial dysfunction. Ruptured
micro aneurysms lead to intra retinal haemorrhages18
b) Hemorrhages: Hemorrhages may differ in their appearance depending
on the retinal layer involved. The “dot/blot” hemorrhages are small
intraretinal hemorrhages which are characteristic of diabetic
21
retina. Hemorrhages in the nerve fibre layer result in flame shaped
hemorrhage.
c) Intra retinal microvascular abnormalities(IRMA): IRMA s are pre
existing vessels with new endothelial cell proliferation that act as
“shunts” through areas of non perfusion. Presence of IRMAs usually
indicate a severe form of non proliferative retinopathy and carries an
increased risk of neovascularization.
d) Venous caliber abnormalities: These include venous beading,
dilatation and loop formation and indicate early stage of diabetic
retinopathy.
e) Retinal neovascularization: Development of new and abnormal
vessels is a feature of proliferative retinopathy. Neovascularization
may occur at the disc (NVD) or elsewhere at the retina (NVE).
Diabetic retinopathy may present as non proliferative retinopathy,
proliferative retinopathy or macular edema.
Non proliferative diabetic retinopathy is classified according to the severity
as:45
a) Mild NPDR: Presence of micro aneurysm
b) Moderate NPDR: Presence of micro aneurysm or hemorrhage,
22
c) Severe NPDR: Hemorrhages or microaneurysms in all 4 quadrants
or venous beading in atleast 2 quadrants or IRMA in atleast in one
quadrant.
d) Very severe NPDR: Presence of 2 or more of the lesions
categorized as severe NPDR.
As the severity of the NPDR increases, risk of patient developing
proliferative retinopathy increases.
Proliferative diabetic retinopathy (PDR) includes neovascularization (NVD
or NVE), preretinal or vitreous hemorrhage. Presence of high risk PDR is an
immediate indication for laser photocoagulation and hence identifying these
lesions is crucial in saving vision of the patient.
Clinically significant macular edema (CSME) which is defined as retinal
thickening within two disc diameters from the centre of macula is a
potentially treatable lesion. Presence of macular edema indicates there is a
25% chance of moderate visual loss in the next 3 years.
DIABETIC NEUROPATHY
Diabetic neuropathy occurs in about 50% of patients with type 2 diabetes.
The classification of diabetic neuropathy is primarily based on the clinical
23
simplest and widely used classification divides diabetic neuropathy into
diffuse or symmetric neuropathies and focal neuropathies.46
Diffuse or symmetric neuropathies include
1. Distal symmetric sensorimotor polyneuropathy
2. Autonomic neuropathy
3. Acute painful neuropathy
4. Hyperglycemia induced neuropathy
5. Treatment induced neuropathy
6. Symmetric proximal lower extremity neuropathy
7. Chronic inflammatory demyelinating polyneuropathy(CIDP)
Of these, distal symmetric sensorimotor polyneuropathy is the most
common type. Foot ulcers and diabetic arthopathy are dreaded
complications of diabetic neuropathy and hence remain as issues of prime
interest.
Autonomic neuropathy can affect cardiovascular system resulting in resting
tachycardia, orthostatic hypotension and arrhythmias, gastrointestinal
system resulting in gastroparesis and genitourinary system resulting in
24
Focal/multifocal neuropathies include:
1. Cranial neuropathy
2. Thoracoabdominal neuropathy
3. Focal limb neuropathy
4. Diabetic amyotrophy
Mononeuropathy represents symptoms along the distribution of a single
nerve. Mononeuritis multiplex is common among diabetics and refers to
simultaneous involvement of multiple peripheral nerves. Cranial
mononeuropathy occurs in diabetic patients with the most commonly
involved nerve being the third cranial nerve. Diabetic amyotrophy occurs as
a result of involvement of the lumbar plexus or the femoral nerve and
presents as severe pain in the hip and thigh associated with weakness of hip
flexors and extensors
Having discussed the macrovascular and microvascular complications with
special emphasis on the pathogenic mechanism of microvascular
complications, the relationship between the cardiovascular system and
25
DIABETES AND CARDIOVASCULAR SYSTEM
The prevalence of cardiovascular disease is higher among type 2 diabetes
patients. There is a marked increase in the occurrence of myocardial
infarctions, coronary artery disease, congestive heart failure and peripheral
arterial disease, which is attributed to the increase in atherosclerosis. The
incidence of sudden cardiac death is increased by two to three fold in
diabetic patients. Such is the strength of association between cardiovascular
disease and diabetes, that American Heart Association has designated
diabetes as “coronary artery disease equivalent”.
Diabetes is the seventh leading cause of mortality, with majority of
mortality occurring due to cardiovascular complications.19Overall
cardiovascular disease which include both coronary artery disease and
cerebrovascular accidents account for about 65% of the mortality in diabetic
patients.20 Although there has been a decline in the deaths due to
cardiovascular disease in the past three decades, the effect of cardiovascular
mortality in diabetics lags well behind the general population. Identification
and treating of cardiovascular risk factors gains top priority in improving the
26
CARDIOVASCULAR RISK FACTORS IN TYPE 2 DIABETES
The traditional risk factors which promote atherosclerosis and are associated
with type 2 diabetes include:
1. Female sex
2. Smoking
3. Reduced physical activity
4. Hypertension
5. Abdominal obesity
6. Dyslipidemia
Although the traditional risk factors play an important role in the
development of atherosclerosis in diabetic patients, the cardiovascular
mortality rate exceeds by 50% the rate predicted by these factors. This
suggests that nontraditional risk factors such as hyperglycemia, insulin
resistance and insulin play a pivotal role in contribution to cardiovascular
disease.47
A few risk factors of prime importance are discussed below
Hypertension:
Hypertension is a common comorbid condition and accounts for nearly 85%
of excess cardiac risk. Hypertension increases the risk of coronary artery
27
with diabetes, the risk of stroke or CVD is increased two fold and the risk
for developing ESRD is increased five fold21. Hypertension in individuals
with diabetes has characteristic features which include volume expansion,
increased salt sensitivity, isolated systolic hypertension, loss of the
nocturnal dipping of blood pressure and pulse, and increased propensity
towards orthostatic hypotension.22
Dyslipidemia:
Dyslipidemia is an important risk factor for development of atherosclerosis
in diabetic patients. The important lipid abnormalities in diabetic patients
are as follows:
1. Increased levels of VLDL due to increased hepatic production
2. Increase in triglycerides due to increased VLDL production and
decreased catabolism. Lipoprotein lipase activity is reduced in
diabetics which plays an important role in metabolism of
triglycerides.
3. Decreased HDL levels23
4. LDL levels remain unchanged. But diabetes patients have a
tendency to form smaller, denser LDL particles, which undergo
28
The growing pandemic of obesity has led to the development of a new entity
“metabolic syndrome”, which includes dyslipidemia, hypertension, diabetes
and obesity and threatens to increase the cardiovascular mortality.
Insulin resistance and hyperglycemia
Insulin resistance is associated with atherogenic factors and procoagulant
state and thus promotes atherosclerosis even before overt hyperglycemia
develops.25 Insulin resistance is associated with an increase in plasminogen
activator inhibitor 1(PAI 1) and fibrinogen, both of which favour thrombus
formation. The duration of insulin resistance is also a critical factor in
promoting atherosclerosis. Thus insulin sensitivity and atherosclerosis are
inversely related.
Serum glucose level is another important risk factor for cardiovascular
events. The level of chronic hyperglycemia as measured by glycosylated
hemoglobin (HbA1C) is an independent risk factor for coronary artery
disease. A 1% increase in HbA1C levels doubles the risk of cardiovascular
29
Risk factors for cardiovascular disease in type 2 diabetes
DIABETES AND CARDIAC DISEASE
With enough evidence suggesting an increased number of cardiovascular
events and their risk factors, we take a closer look of how diabetes
specifically affects the heart. Diabetes contributes to the following events in
heart, which are responsible for the increased cardiovascular morbidity and
mortality.
1. Coronary artery disease
2. Congestive cardiac failure
3. Diabetic cardiomyopathy
30
CORONARY ARTERY DISEASE AND DIABETES
As already mentioned the risk of coronary artery disease is increased two to
three fold in diabetic patients. Multivessel disease is more common among
diabetic population than in the general population. Angiographic studies
performed in diabetic patients either in a setting of acute myocardial
infarction or an elective angioplasty have confirmed a higher proportion of
diabetic patients to have a multivessel disease i.e. involvement of two or
more vessels with more than 75% stenosis27. Not only is the number of
vessels involved in diabetes increased, the distribution of atherosclerotic
plaques is diffuse and more severe. Various autopsy studies also confirm the
same.28
Acute coronary syndromes represent a major cause of death in diabetic
patients. Diabetic patients who develop myocardial infarction have a higher
mortality both in the acute phase as well as during the long term follow up.
In hospital mortality rates are two fold higher in diabetic patients, the
predominant factor being development of cardiogenic shock and congestive
cardiac failure.29,30 The mechanisms that result in a higher incidence of
cardiogenic shock following an acute coronary event will be discussed later.
31
incidence of re-infarction, infarct extension, and recurrent ischemia.
Diabetic patients tend to have a decreased propensity to form collaterals and
so re-infarctions and recurrent ischemia are common.31 Long term outcome
following myocardial infarction is also poor in diabetes patients and is
related to recurrent MI and development of new onset congestive cardiac
failure.
Diabetes may also influence treatment outcomes in patients with coronary
artery disease. Although it is widely believed that thrombolysis may
increase the risk of ocular bleeding in a diabetic patient with proliferative
retinopathy, many studies have failed to show an association. Hence,
thrombolysis should not be deferred even in a setting of proliferative
retinopathy. Although coronary artery by pass graft (CABG) offers no
difference in treatment outcomes between diabetics and non diabetics, the
scenario is not the same with stenting procedures. There is an increased risk
of restenosis following placement of coronary stents in diabetic population.
The major mechanism of restenosis is the increased proliferation of smooth
muscle cells in diabetic population.32
Another important feature of coronary artery disease in diabetic patients is
its propensity to cause an unrecognized myocardial infarction often referred
to as “silent ischemia”. Patients may present without any symptoms or may
32
ischemia is presence of autonomic neuropathy in diabetics which involves
sensory supply to the heart.33 The hypothesis is supported by the fact that
angina perceptual threshold i.e. the time interval between onset of ischemic
changes to onset of pain during exercise testing is prolonged in diabetic
patients.34
CONGESTIVE CARDIAC FAILURE AND DIABETES
It is well established that the prevalence of heart failure is higher among
diabetic patients. Observations from the Framingham Study suggest that
diabetes increases the risk of developing heart failure by 2 fold in men and 5
fold in women. This increase in the prevalence usually parallels the
prevalence of coronary artery disease. Coronary artery disease remains the
most common cause of heart failure in the general population and also in
diabetics. Hypertension remains a major contributor to heart failure second
only to CAD. It accounts for 24% of cases.35
CARDIAC AUTONOMIC NEUROPATHY (CAN)
Cardiac autonomic neuropathy refers to the dysfunction of the autonomic
system related to the heart.48 Cardiac autonomic neuropathy can manifest as
orthostatic hypotension, resting tachycardia or painless myocardial
33
Initially the parasympathetic fibres are affected, resulting in an increased
sympathetic tone resulting in resting tachycardia. There is also blunting of
hemodynamic responses to exercise. As a result of the decreased
parasympathetic tone, coronary vasoconstriction occurs, which results in
ischemia.
CAN significantly contributes to cardiovascular morbidity and mortality.
The possible mechanisms are
1. Increased risk of ventricular arrhythmias due to perturbations in
the rhythm. As a consequence, diabetic patients with CAN are at
an increased risk of sudden cardiac death.
2. Increased resting heart which increases the myocardial oxygen
demand.
3. Silent myocardial ischemia.
4. Impaired vasomotor regulation.
Presence of CAN indicates a poor prognosis to the underlying cardiac
disorder. CAN is detected by measuring the heart rate variability over a 24
34
DIABETIC CARDIOMYOPATHY
Whether factors other than coronary artery disease and hypertension can
result in heart failure in diabetics remain a controversial subject and an area
of potential research.
Diabetic cardiomyopathy refers to presence of dilated cardiomyopathy in
diabetic patients in the absence of coronary artery disease, hypertension and
valvular heart disease.44
The concept of diabetic cardiomyopathy was first proposed by Rubler et al
in 197249. Later Regan et al50 demonstrated increased left ventricular filling
pressures in normotensive diabetic patients free of symptoms of heart
failure. Abnormalities in diastolic function with an intact systolic function
were demonstrated by Raev et al. Various studies on clinical subjects and
postmortem studies suggested the possibility of existence of idiopathic
cardiomyopathy associated with diabetes.
Diabetic cardiomyopathy may not present with florid symptoms of failure
but its presence can be assessed by subtle changes in imaging. Although
most studies were performed on type 1 diabetics, data is available for type 2
diabetes patients also.
The existence of diabetic cardiomyopathy remains controversial. To confirm
35
diabetic patients, a thorough understanding of heart failure, methods of
detection and underlying pathogenic mechanisms is needed.
HEART FAILURE AND ITS TYPES
Heart failure, in simple terms, is the inability of the heart to meet with the
metabolic needs of the tissues. Although there are several ways to classify
heart failure, the most scientific classification relevant to this topic would be
to divide it into systolic heart failure and diastolic heart failure. This
classification is purely based on echocardiographic parameters.
An important parameter is assessment of heart failure while performing an
echocardiography is ejection fraction. Ejection fraction is defined as fraction
of blood pumped out of the ventricle during each cardiac cycle.
Ejection fraction = (End diastolic volume – end systolic volume)/end
diastolic volume
Normal ejection fraction ranges between 55-70%.
Systolic failure is defined as heart failure with reduced ejection fraction (<
40%) i.e. failure of contraction of ventricles, in which case there is
decreased amount of blood available to carry adequate oxygen and nutrients
to the tissues. Diastolic heart failure is defined as heart failure with
36
DIASTOLIC HEART FAILURE51
Diastole or the relaxation phase of the ventricle, begins with the aortic
closure and ends with mitral closure.
The diastole, like the systole is an active process and comprises of four
phases:52
1. Isovolumetric relaxation time: In this phase, both aortic and mitral
valves remain closed and there is no flow of blood from atrium to
ventricle in this phase.
2. Early filling period: The mitral valve opens and the left atrium
empties into the left ventricle, which represents about 80% of the
diastolic flow. The early filling period velocity is denoted by E.
3. Diastasis: The pressures on the left atrium and ventricle are
equilibrated and there is very little flow during this phase.
4. Atrial contraction: The atrium contracts resulting in flow of blood
into the ventricle representing 15% of diastolic flow. The velocity
in this phase is denoted by A.
Under normal conditions, E velocity is larger than A velocity and hence E/A
ratio is more than 1. In pathological states associated with abnormal
relaxation of the ventricle, there is an increase of flow during the atrial
37
Diastolic heart failure is a clinical syndrome, whereas diastolic dysfunction
is a mechanical abnormality of diastole of the heart with or without clinical
symptoms. Diastolic dysfunction can occur is isolation or in combination
with systolic dysfunction.
Any abnormality in the left ventricular relaxation or its compliance alters
the onset, rate and extent of left ventricular pressure decline. These
abnormalities disrupt the normal relationship between left ventricular
pressure and volume. As a consequence, the filling pressures increase in
order to maintain a normal left ventricular end diastolic volume.51
During exercise and tachycardia, these filling pressures are increased further
resulting in exertional dyspnea and fatigue.
The various causes of diastolic dysfunction are:
1. Cardiac conditions: Cardiomyopathies of restrictive and
hypertrophic type result in diastolic dysfunction. Constrictive
pericarditis also results in diastolic failure
2. Hypertension: Hypertension results in a left ventricular
hypertrophy which interferes with normal relaxation.
3. Ischemic heart disease: It is usually associated with systolic
38
4. Old age: As the age increases, the myocardium loses its elastic
properties and results in impaired relaxation
5. Obesity
6. Diabetes
Assessment of diastolic function and grading
As the symptoms produced by systolic and diastolic do not differ much
except for the frequency of occurrence, it is difficult to differentiate between
them on clinical grounds. Hence, invasive or non invasive methods are
employed to assess the diastolic function.
Cardiac catheterization is the gold standard for assessing diastolic
dysfunction. Because of its invasive nature, it cannot be performed in all
individuals and hence its utility is limited in terms of assessing diastolic
dysfunction.
Echocardiography is the most widely used imaging modality to assess the
diastolic function. It is a non invasive technique and easily available tool.
Doppler echocardiography is commonly employed to assess and grade the
39
Various parameters like:
1. E wave velocity (velocity of flow during early filling phase),
2. A wave velocity (velocity of flow during atrial contraction),
3. E wave deceleration time (EDT)( time interval between the peak
of E wave to zero)
4. Isovolumetric relaxation time (IVRT) are measured
Doppler study of the pulmonary vasculature yields additional paramaters
like S wave velocity, D wave velocity, S/D ratio and atrial reversal (AR).
These parameters are used either in single or in combination to assess and
grade diastolic dysfunction.53
40
Diastolic dysfunction presents in four patterns:52
Grade I: (Abnormal relaxation pattern)
Characterized by a decreased E wave velocity and increased A wave
velocity. E/A ratio < 1; Increased IVRT (>100ms); Increased EDT (>240
ms); S/D ratio>1; AR < 35 cm/s. Patients with grade I diastolic dysfunction
have no symptoms at rest but have mild exercise limitation.
Grade II (Pseudonormal pattern):
The normal LV filling pattern is maintained i.e. E/A ratio >1. But LV filling
pressures are increased, evidenced by increased AR velocity. Abnormal
relaxation pattern is observed during Valsalva maneuver. Patients have
exertional dyspnea and moderate functional impairment
Grade III (Reversible restriction):
Characterized by E/A ratio>2.5; decreased EDT (< 150 ms); decreased
IVRT (<70 ms); S/D ratio < 1; AR >35 cm/s. These findings are reversible
with Valsalva. Patients have dyspnea with mild exertion and marked
41
Grade IV (Irreversible restriction):
Features of restrictive pattern which are not reversed by Valsalva are
present.
Other techniques like ventriculography and cardiac catheterization may be
used to assess the diastolic dysfunction.
Schematic diagram of diastolic dysfunction(in echocardiography)
Grade of diastolic
dysfunction Pathological abnormality
Echocardiographic parameters
Grade I Impaired relaxation E/A ratio < 1
Grade II Impaired relaxation and
compliance
E/A ratio>1 with increased left atrial
pressures
Grade III Restrictive
filling(reversible)
E/A ratio > 2.5 and elevated ventricular
filling pressures
Grade IV Restrictive filling
(irreversible)
42
DIASTOLIC DYSFUNCTION IN DIABETES
Diastolic dysfunction is a pre runner of heart failure in diabetic patients.54 It
is also an independent risk factor for all-cause mortality. The cardiovascular
outcome worsens with increasing severity of diastolic dysfunction. Diastolic
dysfunction can occur in isolation without co existent systolic function.
The importance of diastolic dysfunction is emphasized by the fact that
diabetic patients are associated with increased risk of heart failure and
cardiogenic shock following a myocardial infarction. Observations from
various studies highlight the following facts:
1. Studies using serial estimations of cardiac enzymes and
echocardiography have found no evidence that patients with
diabetes sustain more extensive infarctions than their nondiabetic
counterparts.37
2. Cardiogenic shock and heart failure are out of proportion to the
index infarct size in diabetic patients.
3. Clinical manifestations of heart failure occur in patients with
diabetes despite a modest drop in the ejection fraction (EF).38
These observations suggest the possibility of preexisting diastolic
43
diabetic cardiomyopathy, which is characterized by diastolic dysfunction, is
a likely possibility.39
Diastolic dysfunction in diabetic patients may also influence exercise
capacity as evidenced by a reduced maximal capacity during treadmill.63,64
The presence of diastolic dysfunction was confirmed later by variety of
observations. Framingham study reported increased incidence of heart
failure among diabetic patients even after adjustment for confounding
variables.40 Washington cardiomyopathy study also confirmed the
association between diabetes and idiopathic cardiomyopathy.
Echocardiographic studies performed later also confirmed the existence of
diastolic filling abnormalities in diabetic patients.41,42 All these data suggest
that diabetes could be a cause for diastolic dysfunction even in the absence
of systolic dysfunction.
Studies (Takenaka et al.(1988), Hiramatsu et al.(1992),Annonu et al(2001))
performed in diabetic patients free of coronary artery disease and
hypertension, have demonstrated that patients exhibited LV diastolic
44
Mechanisms of diastolic dysfunction in diabetes:43
Although the exact pathogenesis of diastolic dysfunction remains unknown,
various molecular mechanisms have been proposed. The most important
mechanisms being:
1) Metabolic disturbances: Diabetic hearts have a blunted response to
the uptake of insulin mediated uptake of glucose. There is an
increased utilization of free fatty acids, which can result in cardiac
dysfunction. Ketoacids, the production of which is increased in
diabetes is taken by the cardiac myocytes, which in turn reduces
coenzyme A and citric acid cycle and produces myocardial
dysfunction. Abnormalities in calcium homeostasis results in
activation of the PKC signaling pathways and result in cardiac
dysfunction. Insulin resistance may also mediate cardiac
dysfunction.
2) Myocardial fibrosis: Diabetic hearts have demonstrated myocyte
hypertrophy, perivascular fibrosis and increased quantities of
matrix collagen. It is attributed to the accumulation of advance
glycation end products (AGE).
3) Small vessel disease: Endothelial dysfunction, oxidative stress and
impaired coronary reserve contribute to a small vessel disease.
45
Factors contributing to diastolic dysfunction
When observed carefully, there is a considerable overlap between the
mechanisms proposed for microvascular complications and diastolic
dysfunction. It is also postulated that the severity of diastolic dysfunction
parallels the severity of microvascular complications.
Heart disease in diabetes is primarily due to macrovascular disease, but
growing evidence from different observations suggesting the possibility of a
microvascular diabetic heart is gaining more importance. With diabetic
therapies being targeted at molecular and cellular levels, cardiac dysfunction
in diabetics can be curtailed if not prevented.
Diastolic
dysfunction
Oxidativestress
Endothelial dysfunction
Advanced glycation end
products
Hyperglycemia
Increased free fatty acids
46
MATERIALS AND METHODS: STUDY DESIGN
Cross sectional study
SAMPLE
Diabetic patients from Institute of Internal Medicine and Institute of
Diabetology, Rajiv Gandhi Government General Hospital were enrolled in
the study. Around 60 patients were enrolled for the study after informed
consent from all patients. Institutional ethical clearance was obtained.
Patients were selected based upon the following inclusion and exclusion
criteria.
INCLUSION CRITERIA:
• Known case of type 2 diabetes mellitus patients
• Newly diagnosed type 2 diabetes mellitus patients
• Age group >30 years.
Patients who were already on drugs for diabetes either in the form of insulin
or OHAs were included. Newly diagnosed patients (patients who had
symptoms of diabetes along with a random blood sugar >200mg/dl or
fasting plasma glucose >126 mg/dl) were also included in the study. Age
group of more than 30 years was used to avoid overlap of type 1 and other
47
EXCLUSION CRITERIA: • Pregnant women
• Hypertensive patients
• Known coronary artery disease patients
• Known valvular heart disease, arrhythmias
• Other co morbidities(COPD, pre-existing renal disease, thyroid
disorders)
METHODOLOGY
After informed consent from the enrolled patients, a questionnaire was
prepared to obtain details of the patient’s address, sex, age, occupation and
symptoms if any. History of diabetes, its duration, drug history and potential
complications were given special importance. The patient’s vital parameters
were recorded. Patient’s height and weight were measured to estimate the
body mass index (BMI). The body mass index was calculated using the
formula.
Body mass index (BMI) = Weight of the patient (in kg)/ (height)2 (in m2)
Routine examination of the patient was done. Ophthalmoscopic evaluation
was done using the direct ophthalmoscope. Diabetic retinopathy if present
was identified and classified non proliferative retinopathy (NPDR) and
48
Patients were subject to laboratory investigations like complete blood
counts, renal function tests, fasting and postprandial blood sugar levels and
fasting lipid profile.
Diabetic nephropathy was assessed in the patient by measuring the renal
parameters (blood urea and serum creatinine). Urine routine and cultures
were done to exclude a urinary tract infection. Proteinuria was assessed in
all patients. Ultrasonogram of kidneys was done when required.
MEASUREMENT OF MICROALBUMINURIA:45
Microalbuminuria is estimated by a 24 hour urine collection or a spot urine
sample. While collecting the sample, following precautions are taken: the
patient should be at rest; patient should be free of ketosis; and glycemic
status should be fairly under control.
When 24 hour urine samples are used for estimation, excretion of 30- 299
mg/day is considered as microalbuminuria.
Alternatively, estimation of urine albumin excretion rate(AER) or spot urine
estimation of albumin to creatinine ratio(ACR) is used. The spot sample is
preferred as it is the convenient method in clinical practice. Urine albumin
excretion rate (AER) of 20- 200 micro g/min signifies microalbuminuria.
Normal values are less than 20 micro g/min. Urine albumin to creatinine
49
30 – 299 micro g/ mg signifies microalbuminuria. Values more than 300
indicate overt nephropathy or macroalbuminuria.
The various methods by which microalbuminuria can be estimated are:
1. Microalbumin urine test strips: Employs immunochemical strips
which are specific for albumin.
2. Radio immunoassay: This technique is highly sensitive and has
good accuracy but carries the disadvantage of radioactivity.
3. Radio immunodiffusion: This method requires long incubation
period and hence is not widely accepted.
4. ELISA: Competitive and sandwich ELISA techniques are
employed for quantification of albumin.
5. Immunoturbidometry: Quantifies the amount of albumin based on
spectrophotometric analysis and is suitable for analyzing large
number of samples at a faster rate.
Causes for false positive tests:
Transient increases in urine albumin excretion may occur in a setting of
1. Short term hyperglycemia
2. Fever
3. Urinary tract infections
4. Marked hypertension
50
6. Contamination with seminal or menstrual fluid
7. Following exercise
In our patients, microalbuminuria was estimated in a spot urine sample
using photometric techniques by the method of fully automated
immunoturbidometry. The above mentioned causes were excluded in the
patient before estimating urine albumin excretion. Urine creatinine was also
estimated and urine albumin to creatinine ratio was calculated to reduce
errors due to intraindividual variability in albumin excretion
The following reference values were used:
Urine creatinine : In males: 39-259 mg/dl
In females: 28-217 mg/dl
Normal ACR : < 30 microgram /mg of creatinine.
ASSESSMENT OF DIASTOLIC DYSFUNCTION:
All the patients enrolled in the study were subjected to Echocardiography.
Transthoracic echocardiography was done after clinical evaluation.
2D echocardiography was done to assess the ventricular dimensions,
presence of regional wall motion abnormalities and left ventricular ejection
fraction. The parasternal long axis and short axis views were used. The
51
Doppler echocardiography was done and using the apical four chamber
view. The transmitral velocities were obtained by positioning the sample
volume at the level of the tips of mitral leaflets. The early mitral inflow
velocity (E) and late inflow velocity (A) was obtained and E/A ratio was
calculated.
Doppler ECHO: Measurement of E velocity and A velocity
E/A ratio of less than 1 was considered grade 1 diastolic dysfunction. When
E/A ratio was more than 1, additional parameters like the velocity
propagation, E wave deceleration time were considered to differentiate
52
propagation of the early mitral inflow was assessed using a colour M mode
echocardiography.
Data obtained by above methods was analysed statistically using
1. SPSS 15
53
OBSERVATIONS AND RESULTS
PATIENT CHARACTERISTICS:
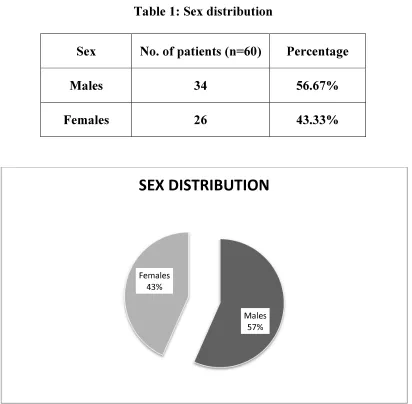
Sex Distribution:
Among the 60 patients enrolled in the study, 34 were male patients and 26
[image:58.612.106.518.218.622.2]were female patients.
Table 1: Sex distribution
Sex No. of patients (n=60) Percentage
Males 34 56.67%
Females 26 43.33%
Males 57% Females
43%
54
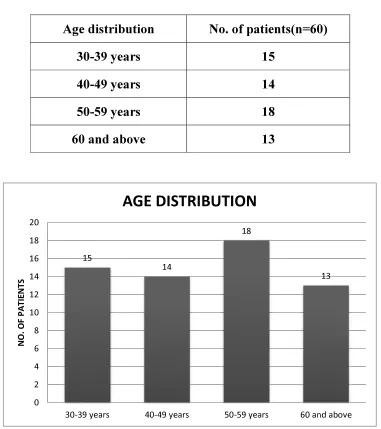
Age distribution
Only patients above the age of 30 years were included in the study. Patients
were evenly distributed with respect to age characteristics. Maximum
number of patients was in the age group 50 -59 years (18 patients). 13
patients were above the age of 60 years. The mean age in our study was
[image:59.612.119.500.265.694.2]49.3±10.4.
Table 2: Age distribution
Age distribution No. of patients(n=60)
30-39 years 15
40-49 years 14
50-59 years 18
60 and above 13
15 14 18 13 0 2 4 6 8 10 12 14 16 18 20
30-39 years 40-49 years 50-59 years 60 and above
55
Duration of diabetes
With respect to duration of diabetes, patients were evenly distributed.
Maximum number of patients was in the subcategory of 0-4 years duration
(23 patients out of 60). Mean duration of diabetes in our study was 6.07
[image:60.612.159.458.238.361.2]years ±4.9.
Table 3: Duration of diabetes
Duration of diabetes No. of patients (n=60)
0-4 years 23
5-9 years 20
10 years and above 17
Treatment modality of diabetes
Among the 60 patients, 34 were on oral hypoglycemic agents, 11were
receiving insulin and 6 of them received both forms of therapy. 9 patients
were newly diagnosed and yet to be started on treatment.
Table 4: Treatment of diabetes
Treatment modality No of patients (n=60) Oral hypoglycemic agents(OHA) 34
Insulin 11
[image:60.612.129.493.571.682.2]56
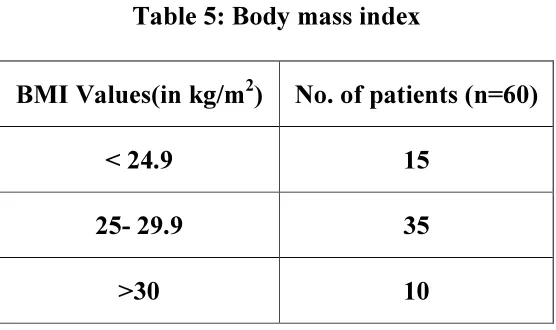
Distribution of BMI (body mass index)
Patients were stratified on the basis of their BMI. Most patients (35 patients
out of 60) had a BMI value between 25 and 29.9. 10 patients were obese
(BMI > 30 kg/m2). None of the patients in our study had morbid obesity.
[image:61.612.171.449.219.384.2]The mean BMI value in our study was 26.58±2.78.
Table 5: Body mass index
BMI Values(in kg/m2) No. of patients (n=60)
< 24.9 15
25- 29.9 35
>30 10
Triglyceride levels
54 out of 60 patients had triglyceride levels more than 150 mg/dl, out of
which 13 of them had values above 250mg/dl. The mean triglyceride level
value in our study was 210.43±60.09.
Table 6: Triglyceride level distribution
Triglyceride level (mg/dl) No. of patients (n=60)
<150 6
150- 200 27
200-249 14
[image:61.612.150.473.563.709.2]57
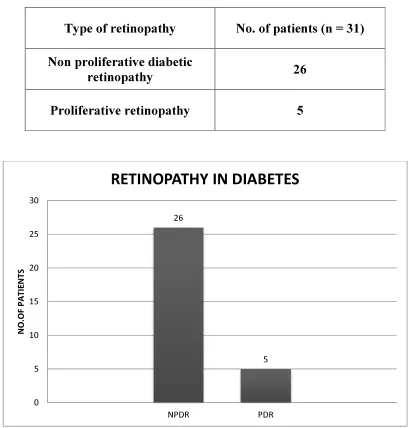
Retinopathy in diabetes
Among the 60 patients, 31 patients (51.67%) had retinopathy of which 26 of
them had non proliferative retinopathy and 5 patients had proliferative
[image:62.612.104.517.212.640.2]retinopathy.
Table 7: Retinopathy in diabetes
Type of retinopathy No. of patients (n = 31)
Non proliferative diabetic
retinopathy 26
Proliferative retinopathy 5
26
5
0 5 10 15 20 25 30
NPDR PDR
N
O
.O
F
P
A
T
IE
N
T
S
58
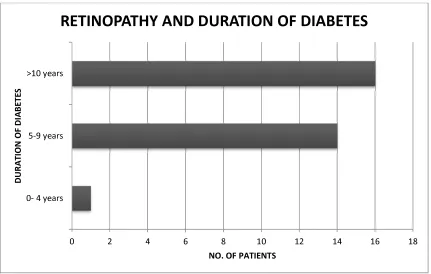
Table 8: Retinopathy distribution with respect to duration
Duration of diabetes
No. of patients with retinopathy (n=31)
NPDR PDR
0-4 years 1 0
5-9 years 13 1
10 years and above 12 4
Out of the 31 patients with retinopathy, 16 patients had diabetes for 10 years
or more. The prevalence was very low when the duration of diabetes was
less than 5 years.
Out of 5 patients with proliferative retinopathy, 4 of them had diabetes for
10 years or longer.
0 2 4 6 8 10 12 14 16 18
0- 4 years 5-9 years >10 years
NO. OF PATIENTS
D
U
RA
T
IO
N
O
F
D
IA
BE
T
E
S
59
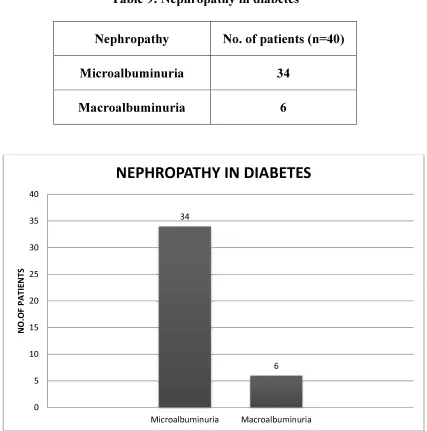
Nephropathy in diabetes
40 patients out of 60 had evidence of nephropathy in the form of
proteinuria. Microalbuminuria was present in 34 patients and overt
[image:64.612.104.531.198.629.2]nephropathy (macroalbuminuria) was present in 6 patients.
Table 9: Nephropathy in diabetes
Nephropathy No. of patients (n=40)
Microalbuminuria 34
Macroalbuminuria 6
34
6
0 5 10 15 20 25 30 35 40
Microalbuminuria Macroalbuminuria
N
O
.O
F
P
A
T
IE
N
T
S
60
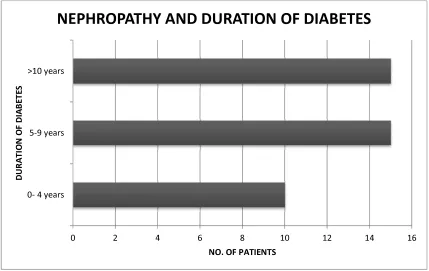
Table 10: Diabetes duration and nephropathy
Duration of diabetes
No. of patients with nephropathy (n=40)
Microalbuminuria Macroalbuminuria
0-4 years 10 0
5-9 years 13 2
10 years and above 11 4
The prevalence of nephropathy was considerably higher when the duration
of diabetes was more than 5 years. Nearly 62.5% of patients with
proteinuria had diabetes for more than 5 years.
0 2 4 6 8 10 12 14 16
0- 4 years 5-9 years >10 years
NO. OF PATIENTS
D
U
RA
T
IO
N
O
F
D
IA
B
E
T
E
S
61
Microvascular complications
The overall prevalence of retinopathy in our study was 51.6% and that of
nephropathy was 66.67%.
Microalbuminuria was present in 56.6% of cases.
0% 10% 20% 30% 40% 50%