STUDY ON SERUM HOMOCYSTEINE LEVEL
AS A PROGNOSTIC MARKER FOR ALCOHOLIC
LIVER CIRRHOSIS AND VIRAL
CIRRHOSIS PATIENTS
DISSERTATION
Submitted for
DM BRANCH- 1V
(MEDICAL
GASTROENTEROLOGY)
AUGUST 2011
T
T
H
H
E
E
T
T
A
A
M
M
I
I
L
L
N
N
A
A
D
D
U
U
D
D
r
r
.
.
M
M
G
G
R
R
M
M
E
E
D
D
I
I
C
C
A
A
L
L
U
U
N
N
I
I
V
V
E
E
R
R
S
S
I
I
T
T
Y
Y
,
,
C
C
C
e
e
r
r
t
t
i
i
f
f
i
i
c
c
a
a
t
t
e
e
This is to certify that this dissertation entitled “STUDY ON SERUM “
HOMOCYSTEINE LEVEL AS A PROGNOSTIC MARKER FOR
ALCOHOLIC LIVER CIRRHOSIS AND VIRAL CIRRHOSIS
PATIENTS””, submitted by Drr..PP..SSuubbrraamamaniniaan n to the faculty of Medical Gastroenterology, The Tamilnadu Dr.MGR Medical University, Guindy,
Chennai-600032, in partial fulfillment of the requirement for the award of
DM Degree, Branch IV (Medical Gastroenterology) is a bonafide work
carried out by him under my direct supervision and guidance.
P
Prroof.f. DDrr.. SS..JJeeeevvaann KKuummaarr,, MM..DD.., , DD..M M DrDr..SS..GGeeetethhaallaaxmxmi i MMDD..,,
Professor and HOD, Dean,
A
A
c
c
k
k
n
n
o
o
w
w
l
l
e
e
d
d
g
g
e
e
m
m
e
e
n
n
t
t
s
s
I am greatly indebted to my guide DrDr..SS..JJeeeevavann KKuummaar,r, M.M.D.D.,D.M., Professor
of Medical Gastroenterology, Department of Digestive Health and Diseases, Govt. Kilpauk Medical College, Chennai, for giving a chance to undertake this dissertation work under his guidance. Also I express my deep sense of gratitude for his encouragement, directions, periodical discussions, rigorous reviews and precious suggestions for shaping my dissertation. I also thank him for giving me the permission to do this dissertation in Govt. Peripheral Hospital, Anna nagar, Chennai-102.
I express my gratitude to DDrr..TT..PPuuggaazhzheennddhhii,, MM..DD..,D.M., Associate
Professor, Department of Digestive Health and Diseases, Govt. Kilpauk Medical College, for his kind encouragement and review of my work, besides providing me with all the required facilities.
I am extremely grateful to DrDr..SS..GGeeeetthhaallaaxmxmii,, M.M.DD..,, Dean, Govt. Kilpauk
I am very much thankful to DrDr..JJ..ReRevvaaththyy, ,M.M.DD..,, Prof & HOD, Department of
Biochemistry, who has guided me a lot in doing this dissertation.
I am extremely thankful to DrDr..RR..BBaalalammururaallii,, M.M.DD..,, D.D.M.M., Dr.G.Ramkumar, , M
M..DD.., , D.D.M.M., Dr.S.Chitra, , M.M.DD.., , D.D.M.M.,, and Dr.K.Muthukumaran, MM..DD..,, D
D..MM.., Assistant Professors in the Department of Digestive Health and ,
Diseases, who have guided me a lot.
I am thankful to my colleagues DDrr.. AA..CChheezzhhiiaann,, MM..DD..,, DDrr.. SS..BBaabbuukkuummaarr M
M..DD..,, DDrr.. DD..SSaassii AAnnaanndd MM..DD..,, DDrr.. TT..AArruunn MM..DD..,, DDrr.. PP..JJaaggaaddeessaann MM..DD..,,DDrr.. B
B..PPrraakkaasshh SShhaannkkaarr MM..DD..,, DDrr.. RR..SSeenntthhiill kkuummaarr MM..DD..,, DDrr.. AA..RR..AAkkiillaannddeesswwaarrii M
M..DD..,, DDrr..JJ..JJaayyaakkuummaarrMM..DD..,, DDrr..RR..PPooppppyyRReejjooiicceeMM..DD..,, DDrr..GG..SSaatthhyyaa MM..DD..,, D
Drr..AA..SSeenntthhiill vvaaddiivvuu MM..DD..,, and DDrr..RR..VViinnootthh KKuummaarr,, MM..DD.., who have helped ,
me a lot in this dissertation.
I am extremely thankful to Dr.P.Venkatesan Ph.D., Deputy Director, Tuberculosis Research Center, Chetpet, Chennai, and Mr.C.Ponnuraja, Research officer, Tuberculosis Research Center for their help in the statistical analysis of my dissertation work.
I thank all the referring institutions and doctors for their trust and timely referral of needy patients to our department. I thank all the patients who have ungrudgingly lent themselves to undergo this study, without which this study would not have seen the light of the day.
C
C
o
o
n
n
t
t
e
e
n
n
t
t
s
s
Chapter 1: Introduction……… 1
Chapter 2: Review of Literature ……..……….…….. 3
Chapter 3: Aim of the study..……….……….35
Chapter 4: Materials and methods……….……… 36
Chapter 5: Results and statistical analysis………. 42
Chapter 6: Discussion……… 50
Chapter 7: Conclusion ……….………. 54
References……… i
Appendix A: Proforma ––SSttuuddyyoonnSSeerruummhhoommooccyysstteeiinneelleevveelliinnaallccoohhoolliicc c ciirrrrhhoossiissaannddvviirraallcciirrrrhhoossiissppaattiieennttss ………ix
A
A
b
b
s
s
t
t
r
r
a
a
c
c
t
t
Study Objective: To study fasting serum Homocysteine level as a prognostic
marker in patients with alcoholic liver cirrhosis and viral cirrhosis, comparing
the homocysteine level with MELD score and Child-Turcotte-Pugh scores.
Design and Setting: Prospective study, Govt. Peripheral Hospital, Anna
nagar, Chennai.
Patients: Fifty alcoholic cirrhosis and 15 viral cirrhosis patients.
Study period: Between December 2009 and April 2011.
Results: Serum homocysteine levels are seen elevated in 41 out of 50 (82%)
alcoholic cirrhosis patients compared to 1 out of 15 (6.67%) viral cirrhosis
patients. The serum homocysteine level in alcoholic group is 23.4 + 7.91
μmol/L compared to 10.05 + 2.75 μmol/L in viral cirrhosis group. The ‘p’
value for variation in serum homocysteine level corresponding to both CTP
and MELD scores is < 0.0001, in both alcoholic and viral cirrhosis patients.
Conclusion: Serum homocysteine levels are elevated in alcoholic cirrhosis
than in viral cirrhosis and correlate well with CTP and MELD scores in
alcoholic cirrhosis patients.
RESULTS AND STATISTICAL
I
I
N
N
T
T
R
R
O
O
D
D
U
U
C
C
T
T
I
I
O
O
N
N
Liver plays a central role in the synthesis and metabolism of homocysteine,
given the fact that dietary methionine is predominantly metabolized in the
liver. It is well known that serum homocysteine level increases in non
alcoholic fatty liver disease (NAFLD) and non alcoholic steatohepatitis
(NASH) patients. Recent studies have shown that serum homocysteine levels
are elevated in chronic alcoholism and liver cirrhosis patients also.
Homocysteine is a well known nerve and vascular endothelial toxin,
promoting mortality, coronary atherosclerosis, myocardial infarction, stroke,
and dementia.. Recently it is found that homocysteine can induce liver
diseases also, by promoting hepatic fibrogenesis.
Homocysteine metabolism requires cofactors of vitamins folate, B12 and
pyridoxine, but the metabolism of these vitamins is impaired in cirrhotic
patients. Homocysteine regulators called methyl donors are required to reduce
serum homocysteine level. Methylation is a vital part of many biochemical
processes in the body involving DNA, proteins and lipids. As improper
methylation affects the brain and nervous system, correcting
Though several studies have proved hyperhomocysteinemia in alcoholic liver
disease and stressed the importance of reducing the serum homocysteine
level, there are only very few studies which compared the serum level of
homocysteine with the severity of liver disease. This study is undertaken to
compare the degree of elevation of serum homocysteine level with severity of
liver disease in alcoholic and viral cirrhotics and to know whether serum
homocysteine level can be used as a prognostic marker to assess the severity
REVIEW OF LITERATURE
Homocysteine
Homocysteine is a homologue of the amino acid cysteine, with the formula
HSCH2CH2CH(NH2)CO2H, not obtained from the diet, instead,
bio-synthesized from the essential amino acid methionine (Selhub 1999), that
inflicts damage to the inner arterial lining (endothelium) by degrading the
structural proteins of arteries and other cells of the body. Methionine is found
abundantly in meat, seafood, dairy products and egg. Vegetables with few
exceptions (sesame seeds and Brazil nuts) are low in methionine. Even such
protein rich legumes as beans, peas and lentils contain relatively small
amount of methionine compared to animal derived foods. Homocysteine
exists in several forms and the sum of all homocysteine forms is called total
homocysteine. It is biosynthesized from methionine by the removal of its
terminal C8 methyl group. First, methionine receives an adenosine group
from ATP, a reaction catalyzed by S-adenosyl-methionine synthetase, to give
S-adenosyl methionine (SAM). SAM then transfers the methyl group to an
acceptor molecule, (i.e., norepinephrine as an acceptor during epinephrine
synthesis, DNA methyltransferase as an intermediate acceptor in the process
L-homocysteine. L-Homocysteine has two primary fates: conversion via
tetrahydrofolate (THF) back into L-methionine or conversion to L-cysteine
(Champe et al., 2008). Homocysteine can be recycled into methionine or
converted into cysteine with the aid of B-vitamins. Hyperhomocysteinemia
irrespective of its cause is an independent risk factor for stroke, coronary and
peripheral arterial diseases (Russo et al., 2004). The effects of Homocysteine
on collagen also impact the protein matrix of bone. It is converted to either
L-methionine or L-cysteine. This occurs in a multi step process requiring certain
B-vitamins. The B-vitamins (N5-methyl tetrahydrofolate, and B12) and the
enzyme 5,10-methylene tetrahydrofolate reductase are needed to complete
this process. When the B-vitamins folic acid, pyridoxine and
cyanocobalamine are lacking in the system, the homocysteine cannot be
converted properly, which causes high homocysteine levels to build up in the
body (Millet et al., 1994).
Many clinical testing laboratories consider a homocysteine value between 5
and 15 micromol / litre as healthy (Ueland PM, et al; 1993). However, studies
indicate that adults with homocysteine values more than 6.3 micromol per
litre are at increased risk of atherosclerosis, heart attack and stroke. After age
extension foundation also recommends the target values for homocysteine as
7 to 8 micromol per litre.
Raised homocysteine levels have also been linked to
• Stroke
• Vascular Disease
• Liver Disease
• Kidney Disease
• Thyroid diseases
• Alzheimer’s disease and dementia
• Depression
• Erectile dysfunction
• Eye disease
• Hearing loss
Causes of hyperhomocysteinemia
• Increasing age
• Consuming a lot of coffee or alcohol
• Smoking
• Gene expression – MTHFR Gene or “poor methylation gene”
• Levadopa - medication for Parkinson’s Disease
• Antiepileptic medications - used for preventing seizures
• Niacin (B-vitamin) - used for lowering cholesterol
• Methotrexate - used for treating inflammatory diseases
• Fenofibrate - used for lowering cholesterol
• Metformin - used for treating diabetes ((Desouza, et al; 2002)
• Nitrous oxide – used in anaesthesia
• Pyrimethamine – antihelminthic
• Sulfasalazine – used in inflammatory bowel disease
• Intense prolonged physical exercise (Van Meurs et al., 2004)
• Diabetes
• Renal failure
• Hypothyroidism
• Malabsorptive conditions
• Inflammatory bowel disease
Methods of lowering homocysteine level
Dietary intake of folate, vitamin B12 and vitamin B6 are the chief nutritional
predominant vitamin. N5-formyl tetrahydrofolate is the important methyl
donor in our body. Methylation is a vital part of many biochemical processes
in the body. Methylation becomes impaired, as we get older. Supplementation
with B- vitamins folic acid, pyridoxine and cyanocobalamine will reduce the
serum homocysteine level (Van Guldener and Stehouwer 2001: Melinda
2006). Following are the methods to be adopted for lowering serum
homocysteine level:
• Reduce homocysteine accumulation
• Increase homocysteine “re-methylation”
• Routine blood tests to check homocysteine levels
• Screening to test for genetic defects that cause high levels
• Addressing symptoms associated with elevated homocysteine such as:
o High blood pressure
o Diabetes
o Coronary artery disease
o Low thyroid function
Serum homocysteine level can be reduced by avoiding methionine rich diet,
particularly the non vegetarian food items, avoiding smoking, coffee intake
Alternatively homocysteine reduction can be achieved by intake of 5-methyl
tetrahydrofolate, natural folate or folic acid tablets, N-Acetyl cysteine 600 to
1800 mg daily, SAMe (S-Adenosyl methionine) 400 mg two to four times
daily, taurine 1000 to 3000 mg daily, trimethyl glycine 2000 to 6000 mg
daily, vitamin B12 (Cobalamin) 1 to 2 mg daily, vitamin B2 (Riboflavin) 10
to 100 mg daily, vitamin B6 (as pyridoxal phosphate) 100 to 200 mg daily,
zinc 30 to 60 mg daily, micronized creatine 500 mg four to eight times daily,
omega-3- polyunsaturated fatty acid rich fish oil or Choline 250 to 500 mg
daily.
Methionine metabolism
Nearly one half of the daily intake of methionine is metabolized in the liver.
Methionine is first metabolized to S-Adenosyl methionine (SAM) catalysed
by the enzyme methionine adenosyl transferase MAT1A in the liver and in
other tissues by MAT2A. S-Adenosyl methionine (SAM) functions as the
principal biological methyl donor through several transmethylation pathways,
as the precursor of aminopropyl groups used in polyamine biosynthesis and as
a precursor of glutathione through its conversion to cysteine along the
SAM is used in transmethylations reactions through methyl transferases, in
which methyl groups are donated to al large number of molecules including
DNA, RNA, biogenic amines, phospholipids, histones and other proteins.
Methylation of these compounds may modulate cellular functions and
integrity. In this process, the Adenosyl methionine is converted to
S-Adenosyl homocysteine (SAH), which is a potent competitive inhibitor of
most methyl transferases. Both an increase in SAH and a decrease in SAM /
SAH ratio are known to inhibit transmethylation reactions(Purohit et al.,
2007).
S-Adenosyl methionine also decreased lipopolysaccharide(LPS) stimulated
tumor necrosis factor (TNF) release and increases interleukin-10 (IL-10)
release in a monocyte cell line, supporting the concept that SAM may have
direct hepatoprotective function and may modify LPS stimulated cytokine
production.
In the kidney and liver, homocysteine is remethylated by the enzyme betaine
homocysteine methyltransferase which transfers a methyl group to
homocysteine via the demethylation of betaine to dimethylglycine. Folic acid
can also play a critical role in the regeneration of homocysteine to methionine
that lack the gene for MTHF reductase supporting the role of this critical
pathway in the development of hepatic steatosis and steatohepatitis. The
transulfuration pathway requires the enzyme cystathionine synthase and
vitamin B6. Once formed from cystathionine, cysteine can be utilized in
protein synthesis and glutathione production. Alterations in plasma
homocysteine and liver SAM and SAH contents in precirrhotic stages and in
secondary biliary cirrhosis have been demonstrated in experimental animals
(Mohammed R et al., 2005).
NAFLD
The prevalence of NAFLD varies from 10 to 24% in the general population,
thus making it the most common liver disease in the world. Fatty liver has
been documented in 8 to 10% of normal population and 70 to 80% of obese
individuals. More than 20% of potential liver donors have NAFLD.
Correspondingly NASH occurs in 3% of general population and 20% of
morbidly obese individuals. Non alcoholic fatty liver disease which was
characterized by the association of fatty liver and lobular hepatitis and
chronically elevated plasma levels of alanine aminotransferase (ALT) in
Ludwig et al in 1980. Insulin sensitivity of adipocytes depends on profile of
adipokines- TNF-ά, leptin, adipokinin, plasminogen activator inhibitor-1, sex
hormone, fatty acids, resistin and cortisol. Fundamental defect in NAFLD
seem to be the insulin resistance that leads to impairment in insulin mediated
suppression of lipolysis. Net result is increased release of free fatty acids from
the adipose tissue. Increased uptake of fatty acids by hepatocytes leads to
mitochondrial β oxidation overload, with consequent accumulation of fatty
acids within hepatocytes. If degree of free fatty acid delivery and
reesterification to triglyceride overwhelms ability to form and export VLDL,
triglycerides accumulate in the liver. FFA decreases insulin mediated glucose
disposal in skeletal muscle and also in liver, it induces gluconeogenesis
pathways and inhibits glucose utilization. This leads to increased peripheral
glucose level, which in turn leads to hyperinsulinemia. Hyperinsulinemia
increases the synthesis of fatty acids in hepatocytes by increasing glycolysis
and increases accumulation of triglyceride by decreasing hepatic production
of apolipoprotein B-100. Thus insulin resistance leads to accumulation of fat
in hepatocytes by two mechanisms: peripheral lipolysis and hyperinsulinemia.
Related to this hypothesis, obesity which gives rise to insulin resistance,
hypertriglyceridemia and leptin resistance are thought to play an important
steatohepatitis is oxidative stress within hepatocytes. The redox state is
determined by balance between pro-oxidant and antioxidant processes.
Oxidative stress results from generation of reactive oxygen species and
deficiency of antioxidant defenses. Multiple metabolic pathways like
mitochondrial, peroxisomal, cytochrome P-450, NADPH oxidase,
cyclooxygenase and lipooxygenase pathways, lead to oxidative stress.
Mitochondrial reactive oxygen species deplete hepatic antioxidants and allow
accumulation of more reactive oxygen species. Depletion of antioxidants like
paraoxonase – 1 may enhance hepatic damage in steatosis. The Kupffer cell
dysfunction induced by insulin resistance leads to increased phagocytic
activity, decreased anti-inflammatory IL-10, thus leading to increased
necroinflammatory activity. Also liver regeneration is impaired in fatty
hepatocytes. Stellate cell activation occurs via noncytokine pathways or via
cytokine pathways (TNF-ά). TNF-ά stimulates secretion of profibrogenic
cytokines like IL-6, TGF-β and PDGF. Leptin secreted by activated stellate
cells further leads to TGF-β production. NAFLD has the potential to progress
to fibrosis, cirrhosis, terminal liver failure and hepatocellular carcinoma
Hyperhomocysteinemia has been found in patients with type 1 and type 2
diabetes mellitus associated with premature atherosclerosis (Hoffmann MA,
Hoogeveen EK, et al., 1998). Several observations suggest that there might be
some links between insulin resistance and hyperhomocysteinemia
(Sanchez-Margalet V, Meigs JB, et al., 2002). Homocysteine is an atherogenic and
thrombogenic risk factor and may be involved in hepatic fibrosis (Torres L, et
al., 1999). In a large study conducted at Turkey in 2007, serum homocysteine
levels were significantly elevated (13.44 + 3.1 μmol/L) in NAFLD patients
when compared to healthy controls (8.62 + 1.34 μmol/L) with p value of
0.015 (Ali cetinkaya, et al., 2007).
Cirrhosis of liver
The word "cirrhosis" derives from Greek κιρρός [kirrhós] meaning yellowish,
tawny (the orange-yellow colour of the diseased liver) + English medical
suffix -osis. While the clinical entity was known before, it was René Laennec
who gave it the name "cirrhosis" in his 1819. Cirrhosis is a consequence of
chronic liver disease characterized by replacement of liver tissue by fibrosis,
scar tissue and regenerative nodules leading to loss of liver function. Cirrhosis
diseases and fatty liver disease, but has many other possible causes. Cirrhosis
of liver is associated with several metabolic disturbances in our body. Ascites
is the most common complication of cirrhosis, and is associated with a poor
quality of life, increased risk of infection, and a poor long-term outcome.
Other potentially life-threatening complications are portal hypertension,
bleeding from esophageal varices, hepatic encephalopathy, hepatorenal
syndrome, hepatopulmonary syndrome and hepatocellular carcinoma.
Cirrhosis is generally irreversible, and treatment usually focuses on
preventing progression and complications. In advanced stages of cirrhosis the
only option is a liver transplant.
Pathogenesis of alcoholic liver disease
One of the early targets of ethanol toxicity is mitochondrial fatty acid
oxidation. Alcohol metabolism alters the NADH/NAD redox potential in the
liver, which in turn impairs the β-oxidation and tricarboxylic acid cycle
activity. Chronic alcohol consumption can increase fatty acid synthesis in
humans. Gut derived endotoxin, including toxic lipopolysaccharide may
trigger both cytokine release and oxidative stress. In the liver, endotoxin
releasing reactive oxygen species and cytokines. Patients with alcoholic liver
disease have increased levels of proinflammatory cytokines IL-1, IL-6 and
TNF-ά as well as the chemokinesIL-8 and other cytokines.
Alcohol induces oxidative stress in the liver by either enhancing the
production of reactive oxygen species and / or decreasing the level of
endogenous antioxidants. The sources of reactive oxygen species include
mitochondria, cytochrome P-450 2E1 in hepatocytes, NADPH oxidase in
inflammatory cells and activated Kupffer cells.
Acetaldehyde is the most important metabolite of ethanol leading to liver
damage. The toxicity of acetaldehyde is due to its capacity to form adducts
with intracellular proteins which can trigger an abnormal immune response
characterized by the production of antibodies directed against acetaldehyde
epitopes. Adiponectin and TNF-ά suppress each other’s action in their target
tissues. Chronic ethanol intake decreases circulating concentrations of
adiponectin and reduced adiponectin expression. Transforming growth factor-
β is a key profibrotic cytokine. Acetaldehyde stimulates the production of
several extracellular matrix proteins including type 1 collagen and enhances
Pathogenesis of viral cirrhosis in HBV
Hepatitis B virus is generally not a cytopathic virus, and the severity of HBV
associated liver disease is considered to be related to the intensity of the host
immunologic response to the virus. The cellular immune response appears to
be the arm principally involved in the pathogenesis of disease. The
immunologic response to HBV encompasses both an innate or nonspecific
response (for example, natural killer cells and interferons) and an adaptive
immune response, including antibodies to viral antigens, human leukocyte
antigen (HLA) class II restricted CD4+ T cells, and HLA class I restricted
CD8+ CTLs. Induction of the antigen specific T cell response is thought to
occur in lymphoid organs and results in the maturation and expansion of T
cells that are specific for these viral epitopes and is followed by their
migration to the liver, where they perform their effector function.
During acute HBV infection, most HBV DNA molecules are cleared rapidly
from the liver via noncytopathic mechanisms mediated by cytokines that are
released initially by cells of the innate immune system and later by liver
infiltrating HBV specific CD8+ cells. Cell mediated immune responses are
efficient in self limited infection because the responses are vigorous,
chronic HBV infection, by contrast, exhibit infrequent, narrowly focused and
weak HBV specific T cell responses. In chronic hepatitis B, the mononuclear
cells in liver infiltrates of patients with chronic hepatitis B at any given time
are non antigen specific.
CD8+ CTLs are thought to contribute to the disease process in the liver and
result in apoptosis of infected hepatocytes. To be recognized by the CD8+
CTLs, targeted hepatocytes must present viral epitopes as short peptides that
have been endogenously processed and fit within the peptide-binding groove
of the class I major histocompatiblity complex (MHC) molecules. The
binding of the CTL T cell receptor (TCR) to the peptide-MHC complex on
the hepatocyte surface can then result in the direct killing of the infected cell
and release of potent antiviral cytokines by the activated CTL. Recognition by
MHC class II restricted CD4+ helper T cells requires the appropriate
presentation of viral peptides in the context of class II MHC molecules. The
CD4+ cells produce antiviral cytokines and provide help in neutralizing
Pathogenesis of viral cirrhosis in HCV
In chronically infected patients, the pathogenesis of liver damage is largely
immune mediated. In a small subset of immunocompromised HCV infected
patients among both HIV infected patients and organ transplant recipients,
however, a syndrome termed fibrosing cholestatic hepatitis develops. Such
cases are thought to result from direct viral hepatotoxicity of infected cells,
because viral levels are typically greater than 30 million copies / mL and
hepatocytes contain enormous concentrations of virus and viral proteins.
HCV infection elicits an immune response in the host that involves both an
initial innate response as well as a subsequent adaptive response. The innate
response is the first line of defense against the virus and includes several arms
such as natural killer cell activation and cellular antiviral mechanisms
triggered by pathogen associated molecular patterns (PAMPs) recognized by
the cell. These processes can lead to apoptosis of infected cells within the first
few hours of infection. Natural killer cells, as the effector cells of the innate
immune system, also produce tumor necrosis factor (TNF-β) and interferon-ά,
cytokines that are critical for dendritic cell maturation and subsequent
number of mechanisms that undermine the ability of the host to control the
infection.
Virus related disruption of the innate and later adaptive immune responses
occur at several levels. NK cell function is slowed possibly because NK-cell
mediated cytotoxicity and production of cytokines are interrupted when the
HCV E2 protein binds its cellular receptor CD81. HCV - NS5A and E2 both
can disrupt protein kinase R (PKR) function to suppress translation, thereby
allowing viral replication to continue. In addition, NS5A inhibits
2’-5’-oligoadenylate synthetase. The ability of HCV to impair the innate immune
response prevents development of a vigorous adaptive immune response to
the infection. NK cells do not adequately activate dentritic cells, and as a
result, the priming of CD8+ and CD4+ T cells in HCV infected patients is
inadequate.
HCV specific T cells are enriched at the site of viral replication, with an
increased number in the liver when compared with the peripheral blood.
CD8+ lymphocytes predominate, suggesting that cytotoxic T lymphocytes are
the main perpetrators of hepato cellular injury. The T cell immune response in
replication by secreted antiviral cytokines. Antibodies to viral proteins are
produced in low levels and do not appear to correlate with the stage of
infection or immune reactivity. In summary, viral products play an integral
role in the immune regulation that leads to chronic infection instead of viral
clearance. Both the virus and the immune response probably play a role in the
development of hepatocellular injury.
Methionine metabolism in alcoholic liver disease
Chronic administration of ethanol in experimental animals increases levels of
plasma homocysteine, reduces liver Adenosyl methionine and increases
S-Adenosyl homocysteine. Acetaldehyde induced inhibition of methionine
synthase activity is associated with increased activity of betaine homocysteine
methyl transferase, which uses betaine as a substrate to methylate
homocysteine to methionine and dimethyl glycine. Reactive oxygen species
generated by ethanol metabolism impair the expression of methionine
adenosyl transferase with consequent reduced levels of S-Adenosyl
methionine (Purohit et al., 2007). Since SAM is a precursor of glutathione,
deficiency of SAM will result in glutathione deficiency which is observed in
part by glutathione deficiency as glutathione is required for optimal
expression of MAT activity in liver. Also hepatic MAT is sensitive to
oxidative stress, and the subnormal hepatic MAT activity in patients with
alcoholic liver disease could result from oxidation of MAT. Depletion of
mitochondrial glutathione is thought to be one pathogenic factor in the
development of alcoholic liver disease and S-Adenosyl methionine prevents
depletion of glutathione in mitochondriae in experimental alcoholic liver
disease. In alcoholic liver disease, serum SAM, the universal substrate for
methyl transferase reactions is decreased, while levels of S-Adenosyl
homocysteine (SAH), an inhibitor of methylation are decreased, and serum
homocysteine are elevated. SAH is also a substrate for the bidirectional
enzyme SAH hydrolase that can both regenerate homocysteine or can
enhance levels of S-Adenosyl homocysteine when homocysteine level is
elevated (Kharbanda KK, et al; 2009). Homocysteine is mainly reduced
through the transsulfuration pathway that includes two vitamin B6 dependant
enzymes, cystathionine-β-synthase and γ- cystathionase, ultimately producing
the antioxidant glutathione. Since S-Adenosyl methionine facilitates the
cystathionine-β-synthase reaction, reduced liver SAM levels are associated
with decreased production of glutathione. Reduced SAM and elevated SAH
contributing to the activation of many genes relevant to liver injury
(Esfandiari F, et al; 2010). Ethanol-induced increases in hepatic SAH also
potentiate pro-inflammatory cytokine TNF-ά and cell death in ethanol-fed
mice (Song Z, et al; 2004). Homocysteine is postulated to play a role in the
pathogenesis of fatty liver and in experimental animals the reduction of
homocysteine level by administration of betaine results in attenuating the
severity of alcoholic liver disease. Deficiency of B vitamins B6, B12 and folic
acid in alcoholics also lead to impaired metabolism of methionine and
impaired regeneration of homocysteine and finally fatty changes in the liver.
The correlation between serum cystathionine level with the severity of liver
fibrosis point to the importance of the homocysteine transsulfuration pathway
in alcoholic liver disease and may have important diagnostic and therapeutic
implications (Valentina Medici, et al; 2010). In ethanol-fed micro pigs, folate
deficiency amplified abnormal hepatic methionine metabolism, increased
oxidative stress and DNA damage and promoted early development of
alcoholic liver damage. In smooth muscle cells and in liver stellate cells,
homocysteine impairs extra cellular matrix breakdown, by inducing the
expression and synthesis of the tissue inhibitor of metalloproteinases-1
(TIMP-1) and alpha 1-procollagen (Garcia-Tevijano ER, et al; 2001).
endoplasmic reticulum stress, leading to the activation of apoptotic and fat
synthetic gene expression in the liver, that contribute to some of the
pathologic features of alcoholic liver disease. The correction of
hyperhomocysteinemia by betaine reverts these changes (Ji C, et al; 2003).
Effect of folate level on Homocysteine
Folate deficiency disturbs hepatic methionine metabolism and causes
impaired catabolism of homocysteine in the liver and other tissues, decreasing
cystathionine, glutathione and SAM synthesis, inhibiting homocysteine
remethylation, increasing SAH and reducing hepatic choline and its
precursors that could lead to liver damage (Pajares, et al; 1992). Requirements
of folate are increased in obese NAFLD patients in whom the methionine
cycle fails even in early stages of liver injury. Serum folate increases in these
patients as a protective mechanism. Serum folate levels are inversely
proportional to the body mass index in NAFLD patients and there is a positive
correlation between serum total homocysteine levels and fat mass (Sandra
Hirsch, et al; 2002). Folate supplementation in pharmacological doses (5mg
daily) reduce the level of serum homocysteine significantly and increases the
diseases in adults with hypercholesterolemia than when compared with
lovastatin (Shidfar F, et al; 2002).
Homocysteine in liver transplant recipients
Liver transplant recipients have an increased risk for cardiovascular disease
because of a high incidence of obesity, arterial hypertension, diabetes
mellitus, hyperlipidemia and hyperhomocysteinemia. Hyperhomocystinemia
is associated with increased serum creatinine levels and renal dysfunction,
and it is a frequent finding in liver transplant recipients. Treatment with folic
acid 10 mg/day in liver transplant recipients, may reduce fasting serum total
homocysteine levels (Herroro JI, et al; 2000). Treatment with the folic acid
metabolite L-5-methyl tetrahydrofolate in a dose of 1 mg per day, effectively
reduces the serum total homocysteine level in orthoptic liver transplantation
recipients (Akoglu B, et al; 2008).
Homocysteine in cirrhosis
In cirrhosis patients multiple metabolic abnormalities have been detected,
including higher level of serum homocysteine, lower level of serum folate,
levels. A significant increase in endothelial markers are also seen in chronic
liver disease, like thrombomodulin, fibrinogen and von Willibrand factor,
while a fall in the level of vitamin K dependant factors (as prothrombin
complex, protein C, protein S) and factors synthesized in liver antithrombin
are seen in cirrhosis. Hyperhomocysteinemia, a known atherogenic and
thrombogenic risk factor not only increases cardiovascular morbidity and
mortality, but also induces hepatic fibrosis and cirrhosis (Halifeoglu I, et al;
2004). It has been suggested that the major metabolic block in the methionine
catabolic pathway in cirrhotics exists at the level of the enzyme
S-adenosylmethionine synthetase because in previous studies using
conventional amino-acid analyzers, no intermediates of
transmethylation/transsulfuration were found to accumulate in plasma
downstream of S-adenosylmethionine synthesis. Recent studies provide
indirect evidence for two hitherto unrecognized alterations of methionine
metabolism in cirrhotics, i.e. impairment of the transsulfuration of
homocysteine at the level of cystathionine degradation and a shift in
remethylation of homocysteine towards the
betaine-homocysteine-methyltransferase reaction. The serum levels of methionine,
N,N-dimethylglycine, N-methylglycine, cystathionine, and homocysteine were
2000). Higher levels of serum homocysteine are more prominently seen in
alcoholic cirrhosis patients, while increase in serum homocysteine levels is
also present in non alcoholic cirrhosis patients (Bosy-Westphal A, et al.,
2003).
A
Asssseessssiinngg sseevvereriittyy ooff cciirrrrhhoosisiss
To understand the expected lifespan, perioperative mortality and fitness for
liver transplantation, scoring systems have been developed to assess the
severity of cirrhosis. Child-Turcotte-Pugh score, MELD score and MELD-Na
score are the most commonly accepted scores to asses the severity of
cirrhosis.
Child-Turcotte-Pugh score
The Child-Turcotte-Pugh (CTP) score, originally developed for the
assessment of the outcome of patients with cirrhosis and portal hypertension,
was extended for general prognosis, and to stratify patients on the waiting list
for liver transplantation. Five variables serum bilirubin, serum albumin,
considered, and a score of between 1 and 3 is accordingly assigned to each of
these factors depending on the severity as given in the table below.
Measure 1 Point 2 Points 3 Points
Total bilirubin, μmol/l, (mg/dl) <34, (<2) 34-50, (2-3) >50, (>3) Serum albumin, g% >3.5 2.8-3.5 <2.8
INR <1.7 1.71-2.20 > 2.20
Ascites None Mild Severe
Hepatic encephalopathy None Grade I-II Grade III-IV
Some older reference works substitute PT prolongation for INR. The sum of
the scores provides the Child-Turcotte-Pugh score, which corresponds to a
Child-Turcotte-Pugh grade of A, B or C (Child CG, et al; 1964). CTP grade A
includes patients with scores of 5 and 6, CTP grade B includes patients with
scores 7,8 and 9 while CTP grade C comprises patients with scores of 10 to
15. This grading is used as a general means to verify the prognosis of the
patient. For example, it can be used to determine the risk to a patient with
regard to possible surgery, and also, to suggest the perceived survival of the
patient over a period of time. Pharmaceutical manufacturers may use the
Child-Pugh grade to suggest dose reductions, or to contraindicate the use of
the drug, dependent on the degree of dysfunction of the cirrhotic liver. The
several factors: the variables, ascites and encephalopathy, are all subjective
and are influenced by medical therapy. The lack of an assessment of renal
function, which is a reliable prognostic marker in cirrhosis, is an additional
limiting factor.
In primary sclerosing cholangitis (PSC) and primary biliary cirrhosis (PBC),
the bilirubin references are changed to reflect the fact that these diseases
feature high conjugated bilirubin levels. The upper limit for 1 point is 68
μmol/l (4 mg/dl) and the upper limit for 2 points is 170 μmol/l (10 mg/dl).
The survival rates in each CTP grades without liver transplantation are as
follows.
Points Grade One year survival Two year survival 5-6 A 100% 85%
7-9 B 81% 57% 10-15 C 45% 35%
MELD Score
MELD was originally developed at the Mayo Clinic, and at that point was
called the "Mayo End-stage Liver Disease" score. It was derived in a series of
variable based on the underlying etiology of the liver disease (Wiesner RH,
Malinchoc M, et al; 2000). A modification of this score was developed to
predict mortality in patients with cirrhosis of different etiologies and
severities of liver disease (Kamath PS, et al; 2001). This MELD score was
found to be superior to the CTP score in predicting 3-months mortality and
therefore the MELD score was implemented in 2002 in the United States for
the prioritization of liver transplantation recipients.
The MELD score has the advantage that it is based on a multivariable analysis
of objective tests for serum bilirubin, INR and serum creatinine. Compared to
CTP score, it also includes assessment of renal function, another major
marker of the severity of the disease. Though serum bilirubin, creatinine, and
INR are usually considered objective and therefore highly reliable, they may
also be influenced by therapeutic manipulations, not only by disease
progression. So, one important advantage of MELD, namely the
independence of the subjective judgment by a clinician, is counterbalanced in
part by arbitrary laboratory values.
MELD uses the patient's values for serum bilirubin, serum creatinine, and the
international normalized ratio for prothrombin time (INR) to predict survival.
MELD = 3.78[Loge serum bilirubin (mg/dL)] + 11.2[Loge INR] +
9.57[Loge serum creatinine (mg/dL)] + 6.43
If the patient has been dialyzed twice within the last 7 days, then the value for
serum creatinine used should be 4.0. Any value less than one is given a value
of 1 (i.e. if bilirubin is 0.8, a value of 1.0 is used) to prevent the occurrence of
scores below 0 (the natural logarithm of 1 is 0, and any value below 1 would
yield a negative result). MELD score represents a continuous variable ranging
from 6 to 40.
MELD score also proved to be a reliable marker of 1-year and 5-year survival
across a broad spectrum of liver diseases including alcoholic cirrhosis and
alcoholic hepatitis. In addition, MELD score has been shown to be a good
prognostic marker in cases of variceal bleeding, spontaneous bacterial
peritonitis, and hepatorenal syndrome (Chalasani N, et al; 2002). Independent
of the cause of cirrhosis, high MELD score was shown to be associated with a
decrease in residual liver function as measured by monoethylglycinexylidine
In interpreting the MELD Score in hospitalized patients, the three month
mortality is as follows:
• MELD score > 40 — 71.3% mortality
• MELD score 30–39 — 52.6% mortality
• MELD score 20–29 — 19.6% mortality
• MELD score 10–19 — 6.0% mortality
• MELD score <9 — 1.9% mortality
Lab Test Frequency
MELD score greater than or equal to 25; Lab testing needed every 7 days.
MELD score 24-19; Lab testing needed every 30 days.
MELD score 18-11; Lab testing needed every 90 days.
MELD score less than or equal to 10; Lab testing needed every year.
There are four Special Case Exceptions that will be assigned a higher MELD
score than that assigned by the patient’s laboratory test results -
Hepatocellular Carcinoma, Hepatopulmonary Syndrome, Primary Oxaluria
MELD – Na
It was felt that patients with refractory ascites, normal creatinine, and
preserved hepatic function could be under-scored with MELD. In particular, it
was shown that persistent ascites and low serum sodium identified a subset of
patients with relatively low MELD score (below 21) and a high risk of early
death. During cirrhosis, hyponatremia results from solute-free water retention.
Systemic arterial vasodilation leads to the release of antidiuretic hormone
which, in turn, induces dilution hyponatremia. The activation of these
mechanisms correlates with the degree of portal hypertension.
Several studies have shown that hyponatremia is a strong predictor of early
mortality, independent of MELD score. Changes in survival are especially
pronounced for sodium concentrations ranging from 120 to 135 mEq/L.
Within this range, a decrease in serum sodium of 1 mEq/L corresponds to a
12% decrease in 3-month probability of survival. A modified score including
serum sodium, termed MELD-Na, has been proposed as an alternative to
MELD score.
MELD Na = MELD – Na – (0.0025 x MELD x (140 - Na) + 140 (where the
al; 2008). The accuracy of MELD-Na was shown to be slightly superior to
that of MELD in candidates for transplantation. The effect of hyponatremia is
higher in patients with low MELD score compared with those with high
MELD score.
A limitation to the incorporation of serum sodium into MELD is that during
cirrhosis, marked changes in serum sodium concentration can result from
several factors, including the administration of diuretics and intravenous
hypotonic fluids. For example, the administration of diuretics leads to a 4
mEq/L decrease in serum sodium, on average. In some patients the decrease
may reach 10 mEq/L. In contrast, the use of V2-receptor antagonists for
treating refractory ascites is encouraging. These agents induce a significant
increase in serum sodium.
In patients receiving anticoagulation therapy, like Budd-Chiary syndrome and
cirrhosis with portal vein thrombosis, the INR is hardly interpretable to use in
the calculation of MELD score. In these cases MELD-XI (MELD excluding
INR) is a good scoring method.
Patients with a rapid increase in MELD over time might be expected to have a
MELD is defined as the difference between current MELD and the lowest
MELD measured within 30 days prior to current MELD, and was shown to be
predictive of early mortality in patients with cirrhosis on univariate analysis
A
A
I
I
M
M
O
O
F
F
T
T
H
H
E
E
S
S
T
T
U
U
D
D
Y
Y
To study fasting serum homocysteine level in patients with alcoholic cirrhosis
and viral cirrhosis and to assess the serum homocysteine level as a prognostic
marker by comparing the homocysteine level with MELD score and
M
M
A
A
T
T
E
E
R
R
I
I
A
A
L
L
S
S
A
A
N
N
D
D
M
M
E
E
T
T
H
H
O
O
D
D
S
S
Place of study : Department of Digestive Health and Diseases,
Government peripheral hospital, Anna nagar,
Chennai.
Type of study : Prospective study.
Period of study : December 2009 to April 2011.
Collaborating Department : Department of Biochemistry,
Kilpauk medical college,Kilpauk, Chennai.
Ethical committee : Approval obtained.
Selection of patients
Fifty patients with alcoholic liver cirrhosis and fifteen cases of viral cirrhosis
who satisfied the following inclusion criteria and not having any of the
exclusion criteria were selected for the study.
Inclusion criteria
1) All cases of viral markers negative alcoholic cirrhosis of liver
with portal hypertension and ascites, were included in the study.
2) All cases of liver cirrhosis with portal hypertension and ascites
due to chronic Hepatitis B or chronic Hepatitis C, of both sexes,
without any history of alcohol intake were included in the study.
Exclusion criteria
1) Patients with both alcohol intake and viral marker positivity were
excluded from the study.
2) Alcoholic hepatitis or viral chronic hepatitis patients without any
clinical signs of cirrhosis were not included.
4) Adult patients above 60 years of age were excluded to minimize
the effect of old age on serum homocysteine level.
5) Patients with diabetes mellitus, chronic renal failure,
hypothyroidism, inflammatory bower disease and malabsorptive
conditions were excluded from the study to avoid confounding
effect on homocysteine level.
6) Patients taking drugs like phenytoin, methotrexate, levodopa,
fenofibrate, metformin, sulfasalazine and pyrimethamine were
also excluded from the study.
S
S
t
t
u
u
d
d
y
y
m
m
e
e
t
t
h
h
o
o
d
d
Patient characteristics like age, sex and body mass index were noted. Detailed
history from the patients regarding abdominal pain, abdominal distension,
swelling of legs, reduced urine out put, yellowish discolouration of urine or
eyes, fatigue, vomiting, vomiting of blood, passing black tarry stools, altered
sleep pattern, altered sensorium, breathlessness and chestpain were taken.
Any similar problem in the past and whether he is a known case of diabetes,
hypertension, coronary heart disease, hypercholesterolemia, epilepsy,
and details of the drugs he was taking so far, were asked in detail and noted.
Detailed history regarding alcohol intake like brand of alcohol, quantity per
day and duration of intake were asked. Similarly history regarding his
smoking habits was recorded. Detailed history regarding his dietary pattern
including vegetarian, non vegetarian food items and coffee intake waass asked.
History regarding the patients day to day physical exercise activities was also
asked and recorded.
Clinical examination
Detailed general examination of the patient was done with regard to
orientation to place, person and time, fever, pallor, icterus, pedal edema,
clubbing, cyanosis, nutritional status, and lymphadenopathy. Vital signs were
recorded for all patients. Clinical examination for cardiorespiratory status,
flapping tremor and any neurological deficit were looked for. Thorough
clinical examination of abdominal system was made out, particularly for the
clinical signs of chronic liver disease, signs of portal hypertension, signs of
hepatic encephalopathy and other complications of chronic liver disease, and
Investigations
Urine examination for albumin, sugar, deposits, bile salts and bile pigments
was done. Complete blood count including hemoglobin, total count,
differential count, platelet count and PCV were recorded. Patient’s blood
group was noted. Routine investigations like erythrocyte sedimentation rate,
blood sugar, urea, creatinine, electrolytes - Na+, K+, Cl and HCO3- , were
taken. Liver function tests total bilirubin, direct and indirect bilirubin, SGOT,
SGPT, Alkaline Phosphatase, GGT, Total protein, Albumin, Globulin and
Albumin / Globulin ratio were recorded. Prothrombin time (test & control)
and INR value were noted. X-ray Chest and ECG were taken for all patients.
Ultrasound abdomen was done for assessing liver size, echotexture, liver
nodules, portal vein diameter, collaterals of portal hypertension, spleen size,
splenic vein diameter and ascites. UGI endoscopy was done for all patients to
look for esophageal or gastric varices, portal hypertensive gastropathy, gastric
antral vascular ectasia, gastric or duodenal ulcers or any UGI bleed. Ascitic
fluid analysis was done for protein, albumin, sugar, cell count and cytology.
SAAG was calculated. Serum Homocysteine level in the morning fasting
sample on the next day of admission, was estimated. Child-Turcotte-Pugh
MELD score available in internet, MELD score was calculated for all
patients.
Study approach
Patients with clinical signs of cirrhosis and portal hypertension of specific
etiology either alcohol or viral, were selected for estimation of fasting serum
homocysteine level. Fifty alcoholic cirrhosis and fifteen viral cirrhosis
patients were enrolled for the study. Severity of cirrhosis was assessed for all
the patients using Child-Turcotte-Pugh score and MELD score. The fasting
serum homocysteine level was compared with both Child-Turcotte-Pugh and
RESULTS
Demography
All patients in alcoholic cirrhosis group are males (50 out of 50).
Male : Female ratio in viral cirrhosis patients is 6 : 9
Age group for alcoholic cirrhosis patients ranged from 29 to 60 years of
age, and the mean age is 47.45 years.
Age group for viral cirrhosis patients ranged from 39 to 60 years of age
and the mean age is 47.8 years.
Serum Homocysteine
Mean serum homocysteine level in alcoholic cirrhosis patients is 23.4
μmol/L.
Maximum value for serum homocysteine is 45.39 μmol/L and the
minimum value is 12.41 μmol/L in alcoholic cirrhosis patients.
Number of alcoholic cirrhosis patients with serum homocysteine level
more than the upper limit of normal value of 15 μmol/L is 41 out of 50
Mean serum homocysteine level in viral cirrhosis patients is 10.05
μmol/L.
Maximum value for serum homocysteine is 15.21 μmol/L and
minimum value is 7.24 μmol/L in viral cirrhosis patients.
Number of viral cirrhosis patients with serum homocysteine level more
than the upper limit of normal value of 15 μmol/L is 1 out of 15 patients
(6.67%).
Child – Turcotte – Pugh score
Mean CTP score for alcoholic cirrhosis patients is 8.36, maximum CTP
score is 14 and minimum score is 6.
Mean CTP score for viral cirrhosis patients is 9.2, maximum CTP score
is 13 and minimum score is 6.
MELD score
Mean MELD score for alcoholic cirrhosis patients is 12.22, maximum
MELD score is 28 and minimum MELD score is 6.
Mean MELD score for viral cirrhosis patients is 14.93, maximum
Correlation of CTP and MELD scores
In alcoholic cirrhosis and viral cirrhosis patients, using Pearson correlation,
the significance of CTP and MELD scores is calculated and the p value for
this correlation is highly significant, p = 0.0001.
Correlation of serum homocysteine with CTP and MELD scores
The serum homocysteine levels correlate well with CTP and MELD scores
when computed using the Pearson calculation, in both alcoholic and viral
cirrhosis patients, and the p value for the significance is 0.0001, in both the
STATISTICAL ANALYSIS
[image:61.612.88.517.208.540.2]All analyses are performed using SPSS 16.0 (SPSS Inc. Chicago, IL).
Table: Descriptive Statistics
Group N Minimum Maximum Mean Standard
Deviation
Alcoholic group
Homocysteine
50 12.41 45.39 23.3996 7.91171
CTP score 50 6 14 8.3600 2.43914
MELD score 50 6 28 12.2200 5.96004
Viral group
Homocysteine
15 7.24 15.21 10.0527 2.75191
CTP score 15 6 13 9.2000 2.42605
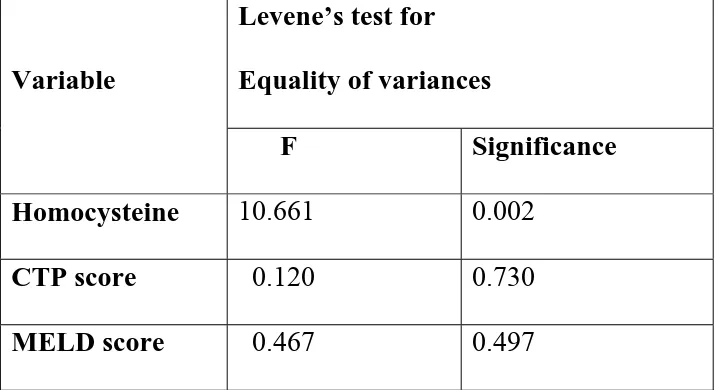
Independent samples test
Table: Levene’s test for Equality of variances
Variable
Levene’s test for
Equality of variances
F Significance
Homocysteine 10.661 0.002
CTP score 0.120 0.730
Table: t – test for Equality of Means
Variable
t – test for Equality of Means
t df Sig
Table: Correlation of serum homocysteine with CTP and MELD scores
Group Variable Method CTP
score
MELD score Alcohol Homocysteine
(N=50)
Pearson Correlation
Significance (p)
(2tailed)
0.878*
0.0001
0.845*
0.0001
Viral Homocysteine (N=15)
Pearson Correlation
Significance (p)
(2tailed)
0.903*
0.0001
0.882*
0.0001
* correlation is significant at the 0.01 level (2 tailed).
The ‘p’ value for serum homocysteine level compared with CTP score and
MELD scores in both alcoholic cirrhosis and viral cirrhosis patients is 0.0001.
Table: Correlation of CTP score with MELD score
Group Variable Method MELD
score Alcohol CTP score
(N=50)
Pearson Correlation
Significance (p)
(2tailed)
0.921 *
0.0001
Viral CTP score (N=15)
Pearson Correlation
Significance (p)
(2tailed)
0.966*
0.0001
The ‘p’ value for CTP score compared with MELD score in both alcoholic
cirrhosis and viral cirrhosis patients is 0.0001.
Hence, the serum homocysteine level highly correlates with both CTP score
and MELD score in both alcoholic cirrhosis and viral cirrhosis patients and
DISCUSSION
Studies in cultured hepatocytes suggest a role of the liver in metabolism of
homocysteine. In fact, hyperhomocysteinaemia has been reported in several
experimental models of liver damage (Garcia-Tevijano ER, Ferre N, et al;
2002). Chronic treatment with ethanol or CCl4 in experimental animals is
associated with hyperho-mocysteinaemia, and the hepatoprotective effect of
S-adenosyl-methionine on experimental cirrhosis is accompanied by a
normalization of methionine metabolism and a decrease in homocysteine
concentration (Ferre N, et al; 2002). However, the presence and degree of
hyperhomocysteinaemia in patients with liver disease is, as yet, not well
defined.
In a study at King George’s medical university, Lucknow, India, in 2005,
comprising of 30 patients with cirrhosis of liver, including 12 alcoholic and
18 non alcoholic cirrhosis, serum homocysteine levels were found to be
elevated in 68% cases. The serum homocysteine levels were significantly
elevated in chronic liver disease cases compared to controls, to 13.44 + 8.09
μmol/L (p < 0.001). The levels were significantly elevated in alcoholic
cirrhosis patients to 23.04 + 10.67 μmol/L, compared to non alcoholics (10.78
In Portugal study, the serum homocysteine levels in chronic alcoholics were
found to be 21.2 + 8.0 μmol/L, twice as high as controls with a p value of
0.05 (Marilia L Cravo, et al; 1996).
In another study at England, hyperhomocysteinemia (concentration > 12
mmol//l) was stated in 70% of the alcoholic cirrhosis patients and mean
homocysteine concentration was statistically significantly higher if compared
to the controls (13.29 + 8.16 vs 8.03 + 1.6 μmol/L, p < 0.05) (Kazimierska E,
et al; 2003).
In one study at Slovak republic, a statistically significant increase of serum
homocysteine was seen in all groups of patients with chronic liver diseases:
steatosis 12.1 + 7.3, (p < 0.01), mild fibrosis/cirrhosis, 14.1 + 10.8, (p < 0.01),
up to severe cirrhosis, 16.9 + 10.9, (p < 0.001), (Anna Remkova, Milan
Remko, et al; 2009).
Forty three biopsy proven cirrhosis patients of different etiology were studied
at France in 2001 and the results were: 74% of the patients had elevated
plasma homocysteine levels defined as >13.4 μmol/L (mean+2SD of healthy
seen in alcoholic as well as in non-alcoholic cirrhotics (Anja Bosy-Westphal,
et al; 2001). But in the present study, serum homocysteine levels were
significantly elevated in alcoholic cirrhosis patients (82%) than in non
alcoholic viral cirrhosis patients (6.67%).
In a study at United States of America, including 40 alcoholic cirrhosis
patients, 26 active alcohol drinkers without clinical evidence of liver disease
and 28 healthy controls, the median homocysteine level in alcoholic cirrhosis
patients was 10.2 μmol/L, with a range of 5.4 to 58.3 μmol/L. The median
homocysteine level in active alcohol drinkers was 8.8 μmol/L, with a range of
5.8 to 23 μmol/L, and in the healthy controls the median value was 6.4
μmol/L, with a range of 4.1 to 10 μmol/L, in the same study. The p value for
increase in homocysteine level was < 0.0001 in both alcoholic cirrhosis and
active alcohol drinkers when compared with healthy controls (Valentina
Medici, et al; 2010). In the same study, the elevation in homocysteine level
when compared with CTP and MELD scores, the p values were 0.041 and
0.02 respectively.
In the present study, serum homocysteine levels are elevated more than the
patients compared to only one patient out of 15 (6.67%) viral cirrhosis
patients. The average serum homocysteine level in alcoholic group is 23.4 +
7.91 μmol/L compared to 10.05 + 2.75 μmol/L in viral cirrhosis group. The
‘p’ value for variation in serum homocysteine level corresponding to CTP and
MELD scores is < 0.0001 in both alcoholic and viral cirrhosis patients. But
the ‘p’ value can be taken as significant, only in alcoholic cirrhosis patients,
as there is only one patient with elevated homocysteine level in the viral
C
C
O
O
N
N
C
C
L
L
U
U
S
S
I
I
O
O
N
N
1
1)) SSeerruumm hhoommooccyysstteeiinnee lleevveellss aarree ssiiggnniiffiiccaannttllyy eelleevvaatteedd iinn aallccoohhoolliicc
c
ciirrrrhhoossiissppaattiieennttss((8822%%))..
2
2)) SSeerruumm hhoommooccyysstteeiinnee lleevveellss aarree nnoott ssiiggnniiffiiccaannttllyy eelleevvaatteedd iinn vviirraall
c
ciirrrrhhoossiissppaattiieennttss((66..6677%%))..
3
3)) SSeerruumm hhoommooccyysstteeiinnee lleevveellss ccoorrrreellaatteedd ssiiggnniiffiiccaannttllyy wwiitthh CCTTPP aanndd
M
MEELLDDssccoorreessiinnbbootthhaallccoohhoolliicccciirrrrhhoossiissaannddvviirraallcciirrrrhhoossiissppaattiieennttss..
4
4)) FFaassttiinngg sseerruummhhoommooccyysstteeiinnee lleevveell mmaayy bbee uusseedd aass aa pprrooggnnoossttiicc mmaarrkkeerr
i
APPENDIX B
MASTER CHART FOR ALCOHOLIC CIRRHOSIS PATIENTS S.No Name of the
patient Age/ Sex Serum Biliru bin Serum Albumin Serum Creatinine
INR Ascites Ence
phalo pathy CTP score MELD score Serum Homo cysteine
1 Mohammed 48/M 2.1 3.3 0.8 1.54 Mild Nil 8 12 30.08
2 Parthiban 38/M 17.6 2.2 1.1 2.01 Severe Gr3 14 26 27.91
3 Devaraj 50/M 2.3 3.4 1.0 1.48 Mild Nil 8 14 14.97
4 Suresh 36/M 17.8 3.4 1.2 2.14 Severe Gr3 13 28 45.39
5 Kannappan 55/M 1.4 3.7 0.8 1.23 Mild Nil 6 8 14.65
6 Kumaresan 49/M 7.8 2.5 1.2 1.58 Severe Gr3 13 21 32.43
7 Kuppan 44/M 3.2 2.7 1.2 1.48 Mild Nil 10 17 29.31
8 Rajagopal 56/M 11.7 3.3 1.0 1.33 Mild Nil 9 19 28.32
9 Panneerselvam 54/M 4.3 3.6 0.9 1.26 Mild Nil 8 14 27.61
10 Ramkumar 39/M 2.3 3.7 0.8 1.23 Mild Nil 7 10 23.56
11 Munusamy 43/M 3.4 3.2 0.9 1.28 Mild Gr1 10 13 27.10
12 Kumarimuthu 29/M 0.8 3.9 0.6 1.20 Mild Nil 6 6 16.92
13 Anandhan 33/M 2.7 3.4 0.8 1.26 Mild Nil 8 11 19.73
14 Venkatesan 45/M 4.2 2.9 0.9 1.54 Severe Gr1 11 16 33.57
15 Gurujikannappan 60/M 5.4 2.7 1.3 1.64 Severe Gr1 12 21 38.12
16 Rajkumar 49/M 2.2 3.2 0.7 1.26 Mild Nil 8 9 22.83
17 Balan 56/M 1.2 3.7 0.8 1.30 Mild Nil 6 8 14.24
18 Govindhan 50/M 0.9 3.3 0.7 1.17 Mild Nil 7 6 18.47
19 Ramadoss 42/M 1.3 2.6 0.8 1.08 Mild Nil 8 6 17.40
20 Devadoss 47/M 0.9 2.7 0.8 1.13 Mild Nil 8 6 20.83
21 Jayakumar 55/M 1.1 3.1 0.7 1.30 Mild Nil 7 6 22.61
22 Sivakumar 50/M 2.2 3.4 1.0 1.43 Mild Gr1 9 13 20.32
23 Ramanathan 40/M 1.4 3.7 0.7 1.32 Mild Nil 6 7 16.94
24 Saravanan 38/M 5.9 2.5 1.3 1.83 Severe Gr3 14 22 42.16
S.No Name of the patient Age/ Sex Serum Biliru bin Serum Albumin Serum Creatinine
INR Ascites Ence
phalo pathy CTP score MELD score Serum Homo cysteine
26 Kanniappan 43/M 1.5 2.2 0.9 1.41 Mild Nil 8 11 18.71
27 Vijayakumar 38/M 0.6 3.6 0.6 1.10 Mild Nil 6 6 12.41
28 Pachiappan 60/M 0.8 3.7 0.9 1.16 Mild Nil 6 6 13.90
29 Raja 55/M 1.8 3.2 0.9 1.31 Mild Nil 7 11 18.12
30 Kuppan 44/M 3.2 2.7 1.2 1.46 Mild Nil 10 17 29.31
31 Rajagopal 56/M 1.7 3.3 1.0 1.32 Mild Nil 7 12 18.32
32 Panneerselvam 54/M 1.3 3.6 0.9 1.26 Mild Nil 6 9 17.61
33 Kumaresan 49/M 7.8 2.5 1.2 1.71 Severe Gr2 13 22 32.43
34 Vellaiappan 45/M 1.2 3.5 0.9 1.23 Mild Nil 7 8 19.22
35 Muthukumar 39/M 1.4 3.7 0.8 1.35 Mild Nil 6 9 14.57
36 Gopinath 44/M 3.9 3.1 1.2 1.49 Mild Gr1 10 18 25.31
37 Raghuram 54/M 1.8 3.5 1.0 1.26 Mild Nil 7 11 22.10
38 Sathyaseelan 45/M 1.3 3.7 0.8 1.24 Mild Nil 6 8 14.57
39 Kandhasamy 40/M 0.9 3.6 0.7 1.16 Mild Nil 6 6 13.28
40 Kumaravel 58/M 1.1 3.4 0.8 1.20 Mild Nil 7 7 19.57
41 Anandhm 60/M 7.7 2.5 1.4 1.76 Severe Gr1 13 24 37.18
42 Thirumaran 52/M 1.3 3.6 0.9 1.10 Mild Nil 6 7 14.75
43 Arokiyasamy 60/M 2.4 3.2 0.9 1.17 Mild Nil 8 10 21.33
44 Selvam 47/M 6.6 2.7 1.3 1.35 Severe Gr1 12 19 36.84
45 Anbuselvan 39/M 1.4 3.8 0.7 1.13 Mild Nil 6 6 21.13
46 Kumarimuthu 55/M 2.4 3.3 0.8 1.16 Mild Nil 8 9 24.58
47 Sundaram 52/M 1.5 3.5 0.7 1.22 Mild Nil 7 7 23.12
48 Loganathan 47/M 1.3 3.6 0.9 1.31 Mild Nil 6 9 19.87
49 Sava