RP-HPLC AND HPTLC METHOD Dissertation work submitted to
The Tamil Nadu Dr. M.G.R. Medical University, Chennai in partial fulfillment for the award of degree of
MASTER OF PHARMACY (PHARMACEUTICAL ANALYSIS)
Submitted by
R.RAJESWARI Reg No. 26106427
Under the Guidance of
Institutional Guide Industrial Guide
Dr. W.D. Sam Solomon M.Pharm., Ph.D Mr. Shaik Mohamed Noor Professor & Head Senior Manager
Department of Pharmaceutical Analysis Shasun Pharmaceuticals Ltd RVS College of Pharmaceutical Sciences Puducherry.
Sulur, Coimbatore.
May 2012
DEPARTMENT OF PHARMACEUTICAL ANALYSIS R.V.S. COLLEGE OF PHARMACEUTICAL SCIENCES
CERTIFICATE
This is to certify that the research project work entitled “Analytical Method development and Validation for Estimation of Dexibuprofen in bulk and tablet dosage form by RP-HPLC and HPTLC method” is a bonafide work of Ms.RAJESWARI.R (Reg.No.26106427) carried out in Shasun Pharmaceuticals Limited, Puducherry under my guidance and has completed to my fullest satisfaction for partial fulfillment of the award
of degree of Master of Pharmacy in Pharmaceutical Analysis, RVS College of Pharmaceutical Sciences, Sulur, Coimbatore, which is affiliated to The Tamilnadu Dr.M.G.R.Medical University, Chennai. This work is original and contributory.
Place : Coimbatore Dr. W.D. SAM SOLOMON M.Pharm.,Ph.D
Date : Professor & Head
Department of Pharmaceutical Analysis
R.V.S. College of Pharmaceutical Sciences
Sulur, Coimbatore.
CERTIFICATE
This is to certify that the research project work entitled “Analytical Method development and Validation for Estimation of Dexibuprofen in bulk and tablet dosage form by RP-HPLC and HPTLC method” is a bonafide work of Ms.RAJESWARI.R (Reg.No.26106427) carried out in Shasun Pharmaceuticals Limited, Puducherry under the guidance, of Dr.W.D.SamSolomon (Institutional Guide)and Mr. Sheik Mohammed Noor
(Industrial Guide) for partial fulfillment of the award of degree of Master of Pharmacyin Pharmaceutical Analysis, RVS College of Pharmaceutical Sciences, Sulur, Coimbatore,
which is affiliated to The Tamilnadu Dr.M.G.R.Medical University, Chennai. This work is original and contributory.
Place : Coimbatore Dr. R. VENKATANARAYANAN M.Pharm.,Ph.D
Date : Principal
R.V.S. College of Pharmaceutical Sciences Sulur, Coimbatore.
This is to certify that the research project work entitled “Analytical Method development and Validation for Estimation of Dexibuprofen in bulk and tablet dosage form by RP-HPLC and HPTLC method” is a bonafide work of Ms. R. RAJESWARI (Reg.No.26106427) carried out in Shasun Pharmaceuticals Limited, Puducherry, under
the guidance of Dr.W.D.SamSolomon (Institutional Guide) and Mr. Sheik Mohammed Noor (Industrial Guide) for partial fulfillment of the award of
degree of Master of Pharmacy in Pharmaceutical Analysis, RVS College of Pharmaceutical Sciences, Sulur, Coimbatore, which is affiliated to The Tamilnadu Dr.M.G.R.Medical University, Chennai. This work is original and contributory.
INTERNAL EXAMINER EXTERNAL EXAMINER
First and foremost I thank my Lord, for my successful completion of this work. I am extremely thankful to God for being with me and leading me on the correct path today and always.
It gives me immense pleasure to convey my deep sense of gratitude and heartfelt thanks to my guide Dr. W.D. Sam Solomon, Professor and Head, Department of Pharmaceutical Analysis, RVS college of Pharmaceutical Sciences, Sulur, Coimbatore for his help, motivation, suggestions, guidance, encouragement and the confidence that he has shown in me throughout the course of my work.
I sincerely thank Dr. R. Venkatanarayanan, Professor and Principal, RVS college of Pharmaceutical Sciences, Sulur, Coimbatore, for his inspirations and for being a great facilitator.
I am extremely grateful to Mr. Sheik Mohammed Noor (Senior Manager-QC), Mr. Bala (Asst.Manager- QC) Shasun Pharmaceutical limited Puducherry,for his invigorate
guidance, felicitous advice, valuable hints with energizing criticism throughout the course of this dissertation work.
I would like to acknowledge the help rendered by the team of method development and validation group under Mr. K. Rajagopal , J.N. Satheesh, and Mr. G. Ratha Krishna Reddy. Analytical research and Development, shasun pharmaceutical for providing the timely suggestions.
I express my sincere gratitude to my teachers Mr. Sivakumar, Mr. Kumar Nallasivam, Mr. Vijayanand for their meticulous guidance and encouragement provided to me for the completion of my dissertation work.
My precious thanks to my shasun precious seniors Ms. Saiprabha, Mr. Prabhu, Mr. Purusothaman, Mr. Karthick, Mr. Gunasekaran, Mr. Venkateshan are also and
entitled to my profuse gratitude.
Asst.Librarian, RVS college of Pharmaceutical Sciences, Sulur, Coimbatore for providing me library facilities.
My heartfelt thanks to my friends Dibin, Deepika, Nisha, Parimaleshwari, Pulla Reddy, Muthuvadivel, Suresh Kumar for their support, honest opinions and diligence kept me lively.
The most overwhelming enthusiasm, goodwill, love and affection have generously come from my Parents, M. Ramar and R. Mary and Brothers, R. Prabhu and R. Ramesh who have been supportive and ever loving, because of whom I am able to reach this position.
Finally I thank all, who have directly or indirectly helped in the successful completion of my dissertation.
Date: R.RAJESWARI
1. INTRODUCTION
A drug may be defined as a substance meant for diagnosis, cure, prevention, or treatment of diseases in human beings or animals or for alternating any structure or function of the body of human being or animals.
Analytical method development and validation play important roles in the drug discovery, development, and manufacture of pharmaceuticals.
This presentation will discuss the development and validation of analytical method (High performance liquid chromatography (HPLC), High performance thin layer chromatography (HPTLC)) for drug products.
The number of drugs introduced into market is increasing every year. These drugs may be either new entities or partial structural modification of the existing one. Very often there is a time lag from the date of introduction of a drug into the market to the date of its inclusion in pharmacopoeias. This happens because of the possible uncertainties in the continuous and wider usage of these drugs, report of new toxicities (resulting in their withdrawal from the market), and development of patient resistance and introduction of better drugs by competitors. Under these conditions, standards and analytical procedures of these drugs may not be available in the pharmacopoeias. It becomes necessary, therefore to develop newer analytical methods for such drugs.
Basic Criteria for New Method Development of Drug Analysis1: ¾ The drug may not be official in any pharmacopoeias.
¾ A proper analytical procedure for the drug may not be available in the literature due to
patent regulations.
¾ Analytical methods may not be available for the drug in the form of a formulation due
to the interference caused by the formulation excipients.
¾ Analytical methods for the quantitation of the drug in biological fluids may not be
available.
Introduction to HPLC method of analysis for drug:
Some of the advantages are:
¾ Speed (analysis can be accomplished in 20 minutes or less),
¾ Greater sensitivity (various detectors can be employed),
¾ Improved resolution (wide variety of stationary phases),
¾ Reusable columns (expensive columns but can be used for many analysis),
¾ Ideal for the substances of low volatility,
¾ Easy sample recovery, handling and maintenance,
¾ Instrumentation tends itself to automation and quantitation (less time and less labour),
¾ Precise and reproducible,
¾ Calculation are done by integrator itself,
¾ Suitable for preparative liquid chromatography on a much larger scale.
Chromatographic methods are commonly used for the quantitative and qualitative analysis of raw materials, drug substances, drug products and compounds in biological fluids2.
TYPES OF CHROMATOGRAPHY3-6:
Chromatography is a technique by which the components in a sample, carried by the liquid or gaseous phase, are resolved by sorption- desorption steps on the stationary phase.
A. HIGH PERFORMANCE LIQUID CHROMATOGRAPHY (HPLC):
High performance liquid chromatography separation based on interaction and differential partition of the sample between the mobile liquid phase and the stationary phase. The commonly used chromatographic methods are divided into the following groups,
1. Normal phase 2. Reverse phase 3. Chiral
1. NORMAL PHASE CHROMATOGRAPHY:
In the normal phase mode, the stationary phase is polar and the mobile phase is nonpolar in nature. In this technique, nonpolar compounds travel faster and are eluted first. This is because of the lower affinity between the nonpolar compounds and the stationary phase. Polar compounds are retained for longer times because of their higher affinity with the stationary phase. These compounds, therefore take more times to elute. Normal phase mode of separation is therefore, not generally used for pharmaceutical application because most of the drug molecules are polar in nature and hence take longer time to elute.
2. REVERSE PHASE CHROMATOGRAPHY:
Reversed phase mode is the most popular mode for analytical and preparative separations of compound of interest in chemical, biological, pharmaceutical, food and biomedical sciences. In this mode, the stationary phase is nonpolar hydrophobic packing with octyl or octa decyl functional group bonded to silica gel and the mobile phase is polar solvent. An aqueous mobile phase allows the use of secondary solute chemical equilibrium (such as ionization control, ion suppression, ion pairing and complexation) to control retention and selectivity. The polar compound gets eluted first in this mode and nonpolar compounds are retained for longer time. As most of the drugs and pharmaceuticals are polar in nature, they are not retained for longer times and hence elute faster. The different columns used are octa decyl silane (ODS) or C18, C8, C4, etc; (in the order of increasing polarity of the stationary phase).
3. CHIRAL PHASE CHROMATOGRAPHY:
Separation of the enantiomers can be achieved by on chiral stationary phases by formation of diastereomers via derivating agents or mobile phase additives on achiral stationary phases. When used as an impurity test method, the sensitivity is enhanced if the enantiomeric impurity elutes before the enantiomeric drug.
4. ION EXCHANGE CHROMATOGRAPHY:
In ion exchange chromatography, the stationary phase contains ionic groups like NR3+or SO3-
5. ION PAIR CHROMATOGRAPHY:
Ion pair chromatography may be used for the separation of ionic compounds and this method can also substitute for ion exchange chromatography. Strong acidic and basic compounds may be separated by reversed phase mode by forming ion pairs with suitable counter ions. This technique is referred to as reversed phase ion pair chromatography.
6. AFFINITY CHROMATOGRAPHY:
Affinity chromatography uses highly specific biochemical interactions for separation. The stationary phase contains specific groups of molecules which can absorb the sample if certain steric and charge related conditions are satisfied. This technique can be used to isolate proteins, enzymes as well as antibodies from complex mixtures.
7. SIZE EXCLUSION CHROMATOGRAPHY:
Size exclusion chromatography separates molecules according to their molecular mass. Largest molecules are eluted first and the smallest molecules last. This method is generally used when a mixture contains compounds with a molecular mass difference of at least 10%. This mode can be further subdivided into gel permeation chromatography (with organic solvents) and gel filtration chromatography (with aqueous solvents).
SCHEMATIC DIAGRAM OF HPLC EQUIPMENT7
a column with the mobile phase, the components of that solution migrate according to the non-covalent interaction of the compound with the column; determine the degree of migration and separation of components contained in the sample. The mobile phase can be altered in order to manipulate the interactions of the sample and the stationary phase. There are several types of elution namely: isocratic, gradient, and polytypic.
IN ISOCRATIC ELUTION:
Isocratic elution compounds are eluted using constant mobile phase composition all compounds begin migration through the column at onset. However each migrates at a different rate, resulting in faster or slower elution rate. This type of elution is both simple and inexpensive, but resolution of some compounds is questionable and elution may not be obtained in a reasonable amount of time.
IN GRADIENT ELUTION:
Gradient elution different compounds are eluted by increasing the strength of the organic solvent. The sample is injected while a weaker mobile phase is being applied to the system. The strength of the mobile phase is later increased in increments by raising the organic solvent fraction, which subsequently results in elution of retained components. This is usually done in a stepwise or linear fashion.
COMPONENTS OF HPLC8-11: ¾ Solvent delivery system
¾ Pump
¾ Sample injection system
¾ Column
¾ Detector
¾ Recorder
A. SOLVENT DELIVERY SYSTEM:
A degasser is needed to remove dissolved air and other gases from the solvent. Special grades of solvents are available for HPLC and these have been purified carefully in order to remove absorbing impurities and particulate matter to prevent these particles from damaging the pumping or injection system or clogging the column.
PUMPS:
The pump is one of the most important component of HPLC, since its performance directly affects retention time, reproducibility and detector sensitivity.
Three main types of pumps are used in HPLC to propel the liquid mobile phase through the system.
1. DISPLACEMENT PUMP: It produces a flow that tends to independent of viscosity and back pressure and also output is pulse free. But is possesses limited capacity (250 ml).
2. RECIPROCATING PUMP: It has small internal volume (35 to 400µl), their high output pressure (up to 10,000 psi) and their constant flow rates. But it produces a pulsed flow.
3. PNEUMATIC OR CONSTANT PRESSURE PUMP: They are pulse free, suffer from limited capacity as well as a dependence of flow rate on solvent viscosity and column back pressure. They are limited to pressure less than 2000 psi.
B. SAMPLE INJECTION SYSTEM:
Insertion of the sample onto the pressurized column must be as a narrow plug so that the peak broadening attributable to this step is negligible. The injection system itself should have no dead (void) volume.
There are three important ways of introducing the sample into injection port.
1. LOOP INJECTION:
In which, a fixed amount of volume is introduced by making use of fixed volume loop injector.
2. VALVE INJECTION:
3. COLUMN INJECTION:
In which, a variable volume is introduced by means of a syringe through a septum.
C. CHROMATOGRAPHIC COLUMN:
The column is usually made up of heavy glass or stainless steel tubing to withstand high pressure. The columns are usually 10-30 cm long and 4-10 mm inside diameter containing stationary phase at particle diameter of 25 µm or less. Columns with an internal diameter of 5mm give good results because of compromise between efficiency, sample capacity, and the amount of packing and solvent required.
COLUMN PACKING:
The packing used in modern HPLC consist of small, rigid particles having an arrow particle size distribution. There are three main types of column packing in HPLC.
1. POROUS, POLYMERIC BEDS:
Porous, polymeric beds based on styrene divinely benzene co-polymers used. For analytical purpose these have now been replaced by silica based, packing which are more efficient and more stable.
2. POROUS LAYER BEDS:
Consisting of a thin shell (1-3µm) of silica or modified silica on an spherical inert core (e.g. glass). After the development of totally porous micro particulate packing, these have not been used in HPLC.
3. TOTALLY POROUS SILICA PARTICLES(dia. 10 µm):
D. DETECTORS:
The function of the detector in HPLC is to monitor the mobile phase as it merges from the column. Detectors are usually of two types.
1. BULK PROPERTY DETECTORS:
It compares overall changes in a physical property of the mobile phase with and without an eluting solute. E.g. Refractive index, Dielectric constant or Density.
2. SOLUTE PROPERTY DETECTORS:
It responds to a physical property of the solute which is not exhibited by the pure mobile phases. E.g. UV absorbance, Fluorescence or diffusion current. Such detectors are about 1000 times more sensitive giving a detectable signal for a few nano grams of sample.
METHOD DEVELOPMENT BY HPLC12-14:
Method for analysing drug dosage form can be developed, depend upon the
¾ Nature of the sample
¾ Molecular weight
¾ Polarity
¾ Ionic character
¾ Solubility
The various parameters for method development.
1. Mode of separation
2. Selection of stationary phase 3. Selection of mobile phase 4. Selection of detector
1. SELECTION OF MODE OF SEPARATION:
In reverse phase mode, the mobile phase is comparatively more polar than the stationary phase. For the separation of polar or moderately polar compounds, the most preferred mode is reverse phase. The nature of the analyte is the primary factor in the selection of the mode of separation. A second factor is the nature of the matrix.
2. SELECTION OF STATIONARY PHASE / COLUMN:
Selection of the column is the first and the most important step in method development. The appropriate choice of separation column includes three different approaches
1. Selection of separation system
2. The particle size and the nature of the column packing.
3. The physical parameters of the column i.e. the length and the diameter.
Some of the important parameters considered while selecting chromatographic columns are
¾ Length and diameter of the column.
¾ Packing material
¾ Shape of the particles
¾ Size of the particles
¾ Percentage of carbon loading
¾ Pore volume
¾ Surface area
¾ End capping
The column is selected depending on the nature of the solute and the information about the analyte. Reversed phase mode of chromatography facilitates a wide range of columns like dimethyl silane (C2), butyl silane (C4), octyl silane (C8), octadecyl silane (C18), base
this study. Generally longer columns provide better separation due to higher theoretical plate numbers. As the particle size decreases the surface area available for coating increases. Column with 5µm particle size give the best compromise of efficiency, reproducibility and reliability. In this case the column selected had a particle size of 5 µm and a internal diameter of 4.6mm
Peak shape is equally important in method development. Columns that provide symmetrical peaks are always preferred while peaks with poor asymmetry can result in
¾ In accurate plate number and resolution measurement
¾ Imprecise quantitation
¾ Degraded and undetected minor bands in the peak tail
¾ Poor retention reproducibility
A useful and practical measurement of peak shape is peak asymmetry factor and peak tailing factor. Peak asymmetry is measured at 10% of full peak height and peak tailing factor at 5%. Reproducibility of retention time and capacity factor is important for developing a rugged and repeatable method. A column which gives separation of all the impurities and degrades from each other and from analyte peak and which is rugged for variation in mobile phase shall be selected.
3. SELECTION OF MOBILE PHASE:
The primary objective in selection and optimization of mobile phase is to achieve optimum separation of all the individual impurities and degrades from each other and from analyte peak.
In liquid chromatography, the solute retention is governed by the solute distribution factor, which reflects the different interactions of the solute-stationary phase, solute-mobile phase and the mobile phase-stationary phase. For a given stationary phase, the retention of the given solute depends directly upon the mobile phase, the nature and the composition of which has to be judiciously selected in order to get appropriate and required solute retention. The mobile phase has to be adopted in terms of elution strength (solute retention) and solvent selectivity (solute separation).
phase LC. The selectivity will be particularly altered if the buffer pH is close to the pKa of the analytes. The solvent strength is a measure of its ability to pull analyte from the column. It is generally controlled by the concentration of the solvent with the highest strength .The following parameters, which shall be taken into consideration while selecting and optimizing the mobile phase.
¾ Buffer
¾ pH of the buffer
¾ Mobile phase composition
3.1. Buffer:
Buffer and its strength play an important role in deciding the peak symmetries and separations. Some of the most common buffers are
¾ Phosphate buffers prepared using salts like K2HPO4, K2HPO4, NaH2PO4, Na2HPO4,
etc.
¾ Phosphoric acid buffer using H3PO4
¾ Acetate buffers – Ammonium Acetate, Sodium Acetate, etc.
¾ Acetic acid buffers using CH3COOH.
The retention time also depend on the molar strength of the buffer. Molar strength is increasingly proportional to retention time.
3.2. pH of the buffer:
pH plays an important role in achieving the chromatographic separations as it controls the elution properties by controlling the ionization characteristics. To maintain the pH of the mobile phase in the range of 2.0 to 8.0 as most columns does not withstand to the pH which are outside this range. This is due to the fact that the siloxane linkage are cleaved below pH 2.0, while the pH value above 8.0 silica may dissolve.
3.3. MOBILE PHASE COMPOSITION:
Experiments were conducted with mobile phases having buffers with different pH and different organic phases to check for the best separations between the impurities.
A mobile phase which gives separation of all the impurities and degrades from the each other and from analyte peak and which is rugged for variation of both aqueous and organic phase by at least ± 0.2% of the selected mobile phase composition.
SYSTEM SUITABILITY TESTS FOR CHROMATOGRAPHIC METHODS15-17:
System suitability is the checking of a system to ensure system performance before or during analysis of unknowns.
System suitability parameters and Recommendations:
SL.NO PARAMETERS RECOMMENDATIONS
1. Capacity factor (k´) The peak should be well resolved from other
peaks and the void volume, generally k´ 2.0.
2. Repeatability RSD / = 1% for N / = 5 is desirable.
3. Relative retention Not essential as long as the resolution is stated.
4. Resolution (Rs) RS of 2 between the peak of interest and the
closest eluting potential interfere (impurity, excipient, degradation product, internal standard, etc.
5. Tailing factor (T) T of / = 2
6. Theoretical plates (N) In general should be 2000
The parameters that are affected by the changes in chromatographic conditions are:
¾ Resolution (RS),
¾ Capacity factor (k´),
¾ Selectivity (a),
¾ Column efficiency (N),
1. RESOLUTION (RS):
Resolution is the parameter describing the separation power of the complete chromatographic system relative to the particular components of the mixture. The resolution of two neighbouring peak is defined as the ratio of the distance between two peak maxima. It is the difference between the retention times of two solutes divided by their average peak width. For baseline separation, the ideal value of RS is 1.5. It is calculated by using the formula,
Where Rt1 and Rt2 are the retention times of components 1 and 2
W1 and W2 are peak width of components 1 and 2.
2. CAPACITY FACTOR (K´):
Where, tR = Retention volume at the apex of the peak (solute ) and
to = void volume of the system.
3. SELECTIVITY (A) :
The selectivity (or separation factor) is a measure of relative retention of two components in a mixture. Selectivity is the ratio of the capacity factors of both peaks, and the ratio of the capacity factors of both peaks, and the ratio of its adjusted retention times. Selectivity represents the separation power of particular adsorbent to the mixture of these particular components.
This parameter is independent of the column efficiency, it only depends on the nature of the components, elute type, and eluent composition and adsorbent surface chemistry. In general, if the selectivity of two components is equal to 1, then there is no way to separate them by improving the column efficiency. The ideal value of a is 2.
It can be calculated by using formula,
a = V2 – V1 / V1 – V0 = K1´ / K2´
Where, V0 = The void volume of the column,
V1 and V2 = The retention volumes of the second and the first peak respectively.
4. COLUMN EFFICIENCY / BAND BROADENING(N) :
from 5000 to 100,000 plates/ meter are ideal for a good system. Efficiency is calculated by using the formula,
Where, tR is the retention time and
W is the peak width.
5. PEAK ASYMMETRY FACTOR (TF):
INTRODUCTION TO HPTLC METHODS OF ANALYSIS FOR DRUGS18-20
HPTLC (High Performance Thin Layer Chromatography) is a well known and versatile separation method which shows a lot of advantages in comparison to other separation techniques.
Layer of Sorbent 100µm
Efficiency High due to smaller particle size generated
Separations 3-5 cm
Analysis time Shorter migration distance and the analysis
time is greatly reduced
Solid support Wide choice of stationary phases like silica
gel for normal phase for reversed phase modes
Development chamber New type that require less amount of mobile
phase
Sample spotting Auto sampler
Scanning Use of UV/Visible/Fluorescence scanner
scans the entire chromatogram qualitatively and quantitatively and the scanner is an advanced type of densitometer.
FEATURES OF HPTLC:
1. Simultaneous processing of sample and standard-better analytical precision and accuracy less need for internal standard.
2. Several analysts work simultaneously
3. Lower analysis time and less cost per analysis. 4. Low maintenance cost.
5. Simple sample preparation-handle samples of divergent nature. 6. No prior treatment for solvents like filtration and degassing. 7. Low mobile phase consumption per sample.
9. Visual detection possible-open system.
10. Non UV absorbing compounds detected by post-chromatographic derivatization.
STEPS INVOLVED IN HPTLC:
1. Selection of chromatographic layer 2. Sample and standard preparation 3. Layer pre-washing
4. Layer pre-conditioning
5. Application of sample and standard 6. Chromatographic development 7. Detection of spots
8. Scanning
9. Documentation of chromatic plate
SELECTION OF CHROMATOGRAPHIC LAYER:
- Precoated plated-different support materials- different sorbents available.
- 80% of analysis – silica gel GF. Basic substances, alkaloids and steroids aluminium oxide. Amino acids, dipeptides, sugars and alkaloids- cellulose.
- Non-polar substances, fatty acids, carotenoids, cholesterol – RP2, RP8 and RP 18.
- Preservatives, barbiturates, analgesic and phenothiazine - Hybrid plates - RPWF254s.
SAMPLE AND STANDARD PREPARATION:
- To avoid interference from impurities and water vapours.
- Low signal to noise ration- Straight base line- Improvement of LOD.
- Solvents used are Methanol, Chloroform: Methanol (1:1), Ethyl acetate: Methanol (1:1), Chloroform: Methanol: Ammonia (90:9:1), Methylene chloride: Methanol (1:1), 1% Ammonia or 1% Acetic acid.
- Dry the plates and store in dust free atmosphere.
ACTIVATION OF PRE-COATED PLATES:
- Freshly open box of plates do not require activation.
- Aluminium sheets should be kept in between two glass plated and placing in oven at 110-120°C for 15 minutes.
APPLICATION OF SAMPLE AND STANDARD:
- Usual concentration range is 0.1-1µg/µl. - Above this causes poor separation.
- Linomat IV (automatic applicator) - nitrogen gas sprays sample and standard from syringe on TLC plates as bands.
- Band wise application – better separation – high response to densitometer.
SELECTION OF MOBILE PHASE:
- Trial and error
- One’s own experience and literature
NORMAL PHASE
- Stationary phase is polar - Mobile phase is non polar
- Non polar compounds eluted first because of higher affinity with the stationary phase
REVERSE PHASE
- Stationary phase is non polar - Mobile phase is polar
- Polar compounds eluted first because of lower affinity with stationary phase
- Non–polar compounds retained because of higher affinity with the stationary phase. - 3-4 component mobile phase should be avoided.
- Multi component mobile phase once used not recommended for further use and solvent composition is expressed by volumes (v/v) and sum of volumes is usually 100.
- Twin trough chambers are used only 10 – 15 ml of mobile phase is required
PRE- CONDITIONING (CHAMBER SATURATION):
- Un saturation chamber causes high Rf values
- Saturated chamber by lining with filter paper for 30 minutes prior to development. - Uniform distribution of solvent vapours.
- Less solvent for the sample to travel. - Lower Rf values.
CHROMATOGRAPHIC DEVELOPMENT AND DRYING:
- After development, remove the plate and mobile phase is removed from the plate. - To avoid contamination of lab atmosphere.
- Dry in vacuum desiccator. - Avoid hair drier.
- Essential oil components may evapourate.
DETECTION AND VISUALIZATION:
- Detection under UV light is first choice. - Non-destructive.
- Spots of fluorescent compounds can been. - Fluorescent stationary phase is used. - Silica gel GF.
- Non UV absorbing compounds like ethambutol, dicyclomine etc. - Dipping the plates in 0.1 % iodine solution.
- When individual component does not respond to UV. - Derivatisation required for detection.
QUANTIFICATION:
- Sample and standard should be chromatographed on same plate. - After development chromatogram is scanned.
- Camag TLC scanners III scan the chromatogram in reflectance or in transmittance mode by absorbance or by fluorescent mode.
- Scanning speed is selectable up to 100 mm/s. - A spectrum recording is fast.
- Calibration of single and multiple levels with linear or non- linear regressions are possible when target values are to be verified such as stability testing and dissolution profile single level calibration is suitable
- Statistics such as RSD or CI report automatically.
- Concentration of analyte in the sample is calculated by considering the sample initially taken and dilution factors.
HPTLC Method design and development
Set the analytical objective first that may be quantification or qualitative identification or optimization of analysis time before starting HPTLC. Method for analyzing drugs dosage forms by HPTLC demands primary knowledge about the
¾ Nature of the sample,
¾ Namely, structure,
¾ Polarity,
¾ Volatility,
¾ Stability,
¾ Solubility.
An exact recipe for HPTLC, however, also same like HPLC cannot be provided because method development involves considerable trial and error procedures. The most difficult problem usually is where to start, with what kind of mobile phase.
Selection of stationary phase is quite easy that is to start with silica gel which is reasonable and nearly suits all kinds of drugs. Mobile phase optimization is carried out by using three level techniques. First level involves use of neat solvents and then by finding some solvents which can have average separation power for the desired drugs. Second level involves decreasing or increasing solvent strength using hexane or water for respective purposes. Third level involves trying of mixtures instead of neat solvents from the selected solvents of first and second level which can further be optimized by the use of modifier like acids or bases.
Analytes are detected using fluorescence mode or absorbance mode. But if the analytes are not detected perfectly than it need change of stationary phase or mobile phase or need the help of pre or post chromatographic derivatization. Optimization can be started only after a reasonable chromatogram which can be done by slight change in mobile phase composition. This leads to a reasonable chromatogram which has all the desired peaks in symmetry and well separated.
Parameters that are affected by the changes in chromatographic conditions are:
¾ Retention factor (Rf),
1. RETENTION FACTOR (RF):
Retention factor is defined as the amount of separation due to the solvent migration through the sorbent layer as shown in the formula. It depends upon the time of development and velocity coefficient or solvent front velocity.
Migration distance of substance
Rf = ---
Migration distance of solvent front from origin
2. PEAK PURITY:
The null hypothesis “these spectra are identical” can in this case (purity) with two sided significance. During the purity test the spectrum taken at the first peak slope is correlated with the spectrum of peak maximum [r(s, m)] and the correlation of the spectra taken at peak maximum with the one from the down slope or peak end [r(m, e)] which is used as a reference spectra for statistical calculation. An error probability of 1% only is rejected if the test value is greater than or equal to 2.576.
VALIDATION OF ANALYTICAL METHOD21-23:
Validation is an act of providing that any procedure, process, equipment, material, activity or system performs as expected under given set of conditions and also give the required accuracy, precision, sensitivity, ruggedness, etc.
The various validation parameters are:
¾ Accuracy
¾ Precision (repeatability and reproducibility),
¾ Linearity and range,
¾ Limit of detection (LOD)
¾ Limit of quantification (LOQ)
¾ Selectivity / specifity,
¾ Robustness / ruggedness
¾ Stability and system suitability studies.
1. Accuracy:
Accuracy may be determined by applying the method to samples or mixtures of excipients to which known amount of analyte have been added both above and below the normal levels expected in the samples. Accuracy is then calculated from the test results as the percentage of the analyte recovered by the assay. Dosage form assays commonly provide accuracy within 3-5% of the true value. The ICH recommend that accuracy should be assessed using a minimum of nine determinations over a minimum of three concentration levels, covering the specified range ( i.e. three concentration and three replicated of each concentration).
Percentage recovery = T - A X 100 / S
Where T = Total amount of drug estimated
A= Amount contributed by formulation
S = Amount of pure drug added.
2. PRECISION:
Precision of analytical method is expressed as SD and RSD of series of measurement by replicate estimation of drug. Repeatability involves analysis of replicates by the analyst using the same equipment and method and conducting the precision study over short period of time while reproducibility involves precision study at
- Different Occasions, - Different Laboratories, - Different Batch of Reagent, - Different Analysts,
- Different Equipments.
The RSD values are important for showing degree of variation expected when the analytical procedure is repeated several time in a standard situation. (RSD below 1% for bulk drugs, RSD below 2% for assays in finished product).
3. LINEARITY AND RANGE:
With varying concentrations of analyte.The working sample concentration and sample tested For accuracy should be in the linear range. The claim that the method is linear to be justified with additional mention of zero intercept by processing data by linear least square regression Declaring the regression co-efficient and b of the linear equation y = ax+ b together with the Correlation coefficient of determination ‘r’. For the method to be linear the ‘r’ value should be close to 1.
4. LIMIT OF DETECTION AND LIMIT OF QUANTITATION:- LIMIT OF DETECTION:
The limit of detection is the parameter of limit tests. It is the lowest level of analyte that can be detected, but not necessarily determined in a quantitative fashion, using a specific method under the required experimental conditions. The determination of the limit of detection of instrumental procedures is carried out by determining the signal-to-noise ratio by comparing test results from the samples with known concentration of analyte with those of blank samples and establishing the minimum level at which the analyte can be reliably detected. A signal-to-noise ratio of 2:1 or 3:1 is generally accepted.
For spectroscopic techniques or other methods that rely upon a calibration curve for quantitative measurements, the IUPAC approach employs the standard deviation of the intercept (Sa) which may be related to LOD and the slope of the calibration curve, b, by
LOD = 3 Sa / b
LIMIT OF QUANTITATION:
The limit of quantitation is the lowest concentration of analyte in a sample that may be determined with acceptable accuracy and precision when the required procedure is applied.
5. SELECTIVITY AND SPECIFICITY:
The selectivity of an analytical method is its ability to measure accurately and specifically the analyte of interest in the presence of components that may be expected to be present in the sample matrix. If any analytical procedure is able to separate and resolve the various components of a mixture and detect the analyte qualitatively the method is called selective. On the other hand, if the method determines or measures quantitatively the component of interest in the sample matrix without separation, it said to be specific.
Selectivity may be expressed in terms of the assay results obtained when the procedure is applied to the analyte in the presence of expected levels of other components, compared the results obtained when the procedure is applied to the analyte in the presence of expected levels of other components, compared to the results obtained on the same analyte without added substances. When the other components are all known and available, selectivity may be determined by comparing the test results obtained on the analyte with and without the addition of the potentially interfering materials. When such components are either unidentified or unavailable, a measure of selectivity can often be obtained by determining the recovery of a standard addition of pure analyte to a material containing a constant level of the other components.
6. ROBUSTNESS AND RUGGEDNESS: ROBUSTNESS:
The robustness of an analytical method is a measure of its capacity to remain unaffected by small but deliberate variation in method parameters and provides an indication of its reliability during normal usage. The determination of robustness requires that methods characteristics are assessed when one or more operating parameter varied.
Ruggedness:
7. STABILITY AND SYSTEM SUITABILITY TESTS:
Stability of the sample, standard and reagents is required for a reasonable time to generate reproducible and reliable results. For example, 24 hour stability is desired for solutions and reagents that need to be prepared for each analysis.
2. REVIEW OF LITERATURE
¾ Selvadurai Muralidharan et al24; reported a method development and validation for the
quantitative determination of Dexibuprofen (DI) in pharmaceutical dosage form. The method was carried out by reversed phase HPLC technique on a RP-18 column with a mobile phase composed of acetonitrile and 0.5 % triethylamine (pH 7.5 adjusted with orthophosphoric acid (30:70,v/v)). UV method was performed with the λmax at 222.0 nm.
Validation parameters such as linearity, precision, accuracy, and specificity were determined.
¾ Wan Wen Qing et al25; reported a establish a method for content determination of
dexibuprofen in the gel preparation by HPLC. Hypersil ODS2 column was used with acetonitrile: water (pH 3.0) 58:42 as mobile phase detecting wavelength as 263 nm flow rate as 1.0 ml min and temperature as 35ºC. The Dexibuprofen showed a good linear correlation with a range of 25.1-251.0 µg/ml, r = 0.9999. The average recovery was 101.6%.
¾ A. Thenmozhi et al26; reported a method development and validation for Dexibuprofen
in tablet dosage form by RP-HPLC. The method was carried out on Waters Symmetry C18 column in isocratic mode, with mobile phase consisting of Acetonitrile and water in the ratio of 55: 45 % (v/v), adjusted to pH 2.5 with orthophosphoric acid. The mobile phase was pumped at a rate of 1.5mL/min and detection was carried out at 214nm and linearity was found to be in the range of 40 to 160μg/ml. The correlation coefficient was found to be 0.9991. Validation of the proposed method has also been done.
¾ P. Balan et al27; reported a method development and validation for the determination of
¾ Selvadurai Muralidharan et al28; reported a method development and validation for
analysis of Dexibuprofen in tablet dosage form by HPTLC. The method uses aluminium foil HPTLC plates coated with silica gel 60F 254 as stationary phase and hexane: ethyl acetate: glacial acetic acid 7.5: 2.5: 0.5 (v/v) as mobile phase. Densitometric analysis of dexibuprofen and the internal standard (aceclofenac) was performed in reflectance mode at 217 nm. The system was found to give compact bands for Dexibuprofen (RF 0.50). Linearity was found to be in the range of 50-300 ng per band (r2 = 0.9902).
DEXIBU ¾ Not o
¾ Dexib
dextr STRUCT CHEMI Che MOLEC C13 MOLEC 206 DESCRI A wh SOLUBI Rea water. TABLET D UPROFEN:
official in an buprofen is a rorotatory en
TURAL FO
CAL NAME
emically it is
CULAR FOR
H18O2
CULAR WE
.28gm/mol
IPTION:
hite colour p
ILITY: adily soluble T FORMUL Dexibuprofen ny pharmacop a Non -Stero nantiomer of ORMULA29 E: s (2S)-2-[4-( RMULA: EIGHT: powder.
in organic s
LATION:
n 300 mg.
3. DR
peia oidal Anti In f ibuprofen. : (2-methyl pr solvent such RUG PROFI nflammatory ropyl) pheny
as ethanol a
ILE
y and Analge
yl] propanoic
and acetone a
esic effect. It
c acid(1,2,3)
and slightly
t is the active
THERAPEUTIC CATEGORY:
Non steroidal anti inflammatory drug.
PHARMACOKINETICS30-33:
Dexibuprofen is absorbed primarily from the small intestine. After metabolic transformation
in the liver (hydroxylation, carboxylation), the pharmacologically inactive metabolites are
completely excreted, mainly by the kidneys (90%), but also in the bile. The elimination half-
life is 1.8 - 3.5 hours; the plasma protein binding is about 99 %. Maximum plasma levels are
reached about 2 hours after oral administration.
INDICATION :
¾ Pain and inflammation caused by osteoarthritis.
¾ Acute symptomatic treatment of pain during menstrual bleeding (primary
dysmenorrhoea).
¾ Mild to moderate pain, such as pain in the muscles and joints and toothaches.
CONTRA INDICATION:
¾ Hypersensitivity to aspirin or other non-steroidal anti-inflammatory drugs.
¾ Active or suspected gastrointestinal ulcer .
¾ Gastrointestinal bleeding or other active bleedings or bleeding disorders.
¾ Active Crohn's disease or active ulcerative colitis.
¾ Severe renal dysfunction ,severely impaired hepatic function.
¾ Haemorrhagic diathesis and other coagulation disorders.
PRECAUTIONS:
¾ History of bronchial asthma
¾ Renal or hepatic disorder
¾ Bleeding disorders
ADVERSE DRUG REACTION :
GI bleeding, heartburn, epigastric pain, dyspepsia, peptic ulcer, nausea, vomiting, diarrhoea, jaundice, hepatitis, rash, thrombocytopaenia, visual disturbances, depression, fatigue, headache, dizziness, vertigo.
DRUG INTERACTIONS:
¾ Anticoagulants: The effects of anticoagulants on bleeding time can be potentiated by NSAIDs. If concomitant treatment cannot be avoided blood coagulation tests (INR, bleeding time) should be performed during the initiation of Dexibuprofen treatment and the dosage of the anticoagulant should be adjusted if necessary .
¾ Methotrexate used at doses of 15 mg/weekor more: If NSAIDs and methotrexate are given within 24 hours of each other plasma levels of methotrexate may increase, via a reduction in its renal clearance thus increasing the potential for methotrexate toxicity. Therefore, in patients receiving high-dose treatment with methotrexate, the concomitant use of Dexibuprofen is not recommended.
¾ Lithium: NSAIDs can increase the plasma levels of lithium, by reducing its renal clearance. The combination is not recommended. Frequent lithium monitoring should be performed. The possibility of reducing the dose of lithium should be considered other NSAIDs and salicylates ( acetyl salicylic acid at doses above those used for anti-thrombotic treatment, approximately 100 mg/day ) The concomitant use with other NSAIDs should be avoided, since simultaneous administration of different NSAIDs can increase the risk of gastrointestinal ulceration and
haemorrhage.
4. AIM AND OBJECTIVE
¾ Analytical methods by using sophisticated instruments such as HPLC and HPTLC are
having the vital role in the modern pharmaceutical analysis. Application of these
instruments for qualitative and quantitative estimation of marketed formulation.
¾ In this research work we applied two instruments namely HPLC and HPTLC for
estimation of Dexibuprofen.
¾ The literature review reveals that one HPTLC method and few HPLC methods in
Pharmaceutical formulation for the quantification of dexibuprofen.
¾ The aim of the present work was to develop and validate a simple, fast, and reliable
RP-HPLC and HPTLC method for the determination of dexibuprofen in tablet dosage
form.
¾ Conformation of the applicability of the developed method was validated according to
the International Conference on Harmonisation to determination of dexibuprofen in
5.
PLAN OF WORK
Development of Validated RP-HPLC and HPTLC Method for Estimation of Dexibuprofen in pharmaceutical dosage forms.
The plan of the proposed work includes the following steps.
¾ Selection of the drug.
¾ Collection of all available information and different analytical procedures related to
the drug.
¾ To undertake solubility study for the Dexibuprofen.
¾ Selection of suitable stationary phase and mobile phases.
¾ Selection of detection wave length.
¾ Optimization of chromatographic parameters.
¾ Preparation of calibration curve.
¾ Estimation of Dexibuprofen formulation.
6. LIST OF INSTRUMENTS USED
S.NO INSTRUMENTS
1. SHIMADZU HPLC with UV detector
2. HYPERSIL BDS C18 column (150 × 4.6mm, 5µ)
3. CAMAG HPTLC instrument
4. CAMAG TLC SCANNER 3
5. CAMAG LINNOMATE V AUTOMAIC SAMPLE
APPLICATOR
6. Twin-trough chamber (10 × 10 cm)
7. Ultra sonicator
8. Electronic balance (2mg-200gm) (Sartorius)
LIST OF CHEMICALS AND SOLVENTS
S.NO CHEMICALS AND SOLVENTS MANUFACTURER
1. DEXIBUPROFEN working standard USP standards
2. Acetonitrile (HPLC grade) Rankem
3. Methanol (HPLC grade) Fischer scientific
4. Tri ethyl amine Merck
5. Toluene Fischer scientific
6. Chloroform Merck
7. Ethanol Merck
8. Acetone
Merck
9. Ethyl acetate Fischer scientific
10. Glacial acetic acid Merck
7. METHOD DEVELOPMENT AND VALIDATION FOR ESTIMATION OF DEXIBUPROFEN TABLET DOSAGE FORM BY RP-HPLC
1. Selection of Column:
Experiments with different C18 columns were conducted to achieve best separation. C18
columns such as Hypersil BDS C18, was tried. After reviewing the results it was found that
the peak shape, retention time, resolution, tailing factor, and column efficiency are good with Hypersil BDS C18 (150 x4.6mm,5.0µm) column was selected.
2. SELECTION OF DETECTION WAVELENGTH:
The sensitivity of the HPLC method that uses UV detector depends upon the proper selection of wavelength. An ideal wavelength which gives good response for the drug to be detected is to be selected from the UV spectrum obtained for the drug, 264 nm was selected as the wavelength for this method.
INITIAL CHROMATOGRAPHIC CONDITIONS:
Stationary phase : Hypersil BDS C18,
(150 × 4.6 mm, 5μm particle size)
Flow rate : 1.0 ml/minutes
Column temperature : Ambient
Wavelength selected : 264 nm
3. SELECTION OF MOBILE PHASE:
Experiments with different mobile phases were tried in different ratio for the selection of mobile phase. So we tried with a mixture of solvent like Acetonitrile: water for getting a suitable symmetrical peak. After repeated trials this mixture of solvents Acetonitrile: water solvent gives a good symmetrical peak. So the above mobile phase was used as a solvent of choice for the drug.
5. EFFECT OF RATIO OF MOBILEPHASE:
peak modifiers such as 1 ml of glacial acetic acid and 0.2 ml of triethylamine and adjust the pH to 5.0± 0.05 to get a sharp symmetrical peak with good retention time.
6. EFFECT OF FLOW RATE:
TRIAL: CHROM Stationar Flow rate Column t Wavelen Injection Run time Mobile p 1 MATOGRA ry phase e temperature ngth selected n volume e phase APHIC CON
: Hyper
: 1.0 ml
: Ambie
d : 264 nm
: 10µl
: 10 minu
: Aceton
Fig No
NDITION:
sil BDS C18
/minutes
ent
m
utes
nitrile: water
o: 2 Chroma
8, (150 × 4.6
(50: 50%v/v
atogram Sho
6 mm, 5μm p
v)
owing Trial
particle size)
l No: 1
TRIAL: CHROM Stationar Flow rate Column t Wavelen Injection Run time Mobile p 2 MATOGRA ry phase e temperature ngth selected n volume e phase APHIC CON
: Hyper
: 1.0 ml
: Ambie
d : 264 nm
: 10µl
: 10 minu
: Methan
Fig No: 3
NDITIONS:
sil BDS C18
/minutes
ent
m
utes
nol: water (5
3 Chromato
8, (150 × 4.6
55:45% V/V
gram Show
6 mm, 5μm p
V)
wing Trial N
particle size)
No: 2
TRIAL: CHROM Stationar Flow rate Column t Wavelen Injection Run time Mobile p 3 MATOGRA ry phase e temperature ngth selected n volume e phase APHIC CON
: Hyper
: 1.0 ml
: Ambie
d : 264 nm
: 10µl
: 10 minu
[image:46.612.125.513.390.638.2]: Aceton
Fig No: 4
NDITION:
sil BDS C18
/minutes ent m utes nitrile: water Chromatog
8, (150 × 4.6
(60: 40%v/v
gram Showi
6 mm, 5μm p
v) add 0.1 m
ing Trial No
particle size)
ml of triethyla
o: 3
)
FIXED C Stationar Flow rate Column t Wavelen Injection Run time Mobile p CHROMAT ry phase e temperature ngth selected n volume e phase TOGRAPH
: Hyper
: 1.0 ml
: Ambie
d : 264 nm
: 10µl
: 10 minu
: Aceton
0.2 ml t
Fig No: 5
HIC CONDIT
sil BDS C18
/minutes ent m utes nitrile: Water triethylamine Chromatog TION:
8 (150 × 4.6
r (60:40%v/v
e. Adjust the
gram Showi
mm, 5μm p
v) 1 ml of gl
e pH to 5.0 w
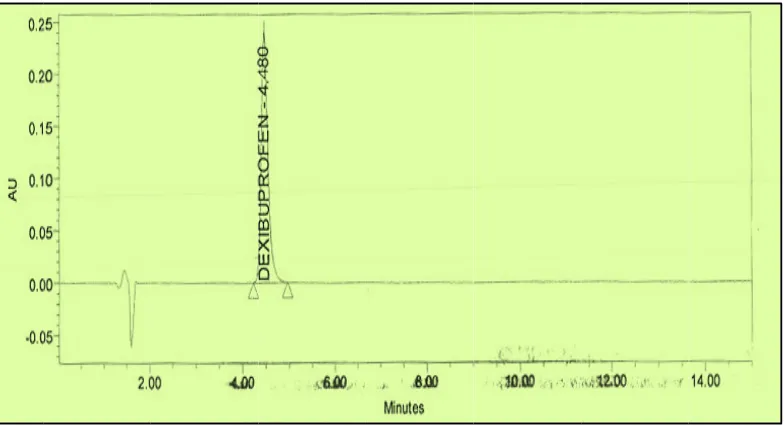
ing Dexibup
article size)
lacial acetic
with glacial a
profen
acid and
PREPAR Mix 600 triethylam solution t PREPAR Prepare a STANDA w standard content a with dilu assay res Fig RATION O
0 ml of ace mine. Adjust
through 0.45
RATION O
a mixture of
ARD PREP
weigh accur
into a 50 m
and make up
uent and mix
sults are tabu
g. No: 6 Chr
OF MOBILE
etonitrile, 40 t the pH to 5µm membra
OF DILUEN
600 ml of a
PARATION
rately and t
ml volumetr
p to the volum
x well. Chro
ulated and ar
romatogram
E PHASE:
00ml of wat 5.0± 0.05 w ane filter.
NT:
cetonitrile an
N:
transfer abo
ric flask, ad
me with met
matogram o
re as shown i
m showing p
ter, 1 ml o with triethyla
nd 400 ml o
out 50 mg
d 30 ml of
thanol. Dilut
of standard s
in Table No
peaks of stan
f glacial ac amine or glac
f water.
of Dexibup
methanol s
te 5 ml of th
solution is as
: 1.
ndard soluti
cetic acid an cial acetic a
profen work
onication to
he above solu
s shown in F
ion of Dexib
nd 0.2 ml o acid. Filter th
ing referenc
o dissolve th
[image:48.612.112.504.436.649.2]ution to 50 m
Fig No: 6 an
SAMPLE PREPARATION:
Weigh and transfer 8 tablets into a 200 ml volumetric flask, add 10 ml of water and shake for 5 min. Add 100 ml of methanol sonication for 20 minutes with intermediate shaking, make up to the volume with methanol and mix well. Filter the solution through a 0.45µm nylon filter. Dilute 2.0 ml of filtrate to 250 ml volumetric flask and make up to volume with diluents. Chromatogram of sample solution is as shown in Fig No: 7
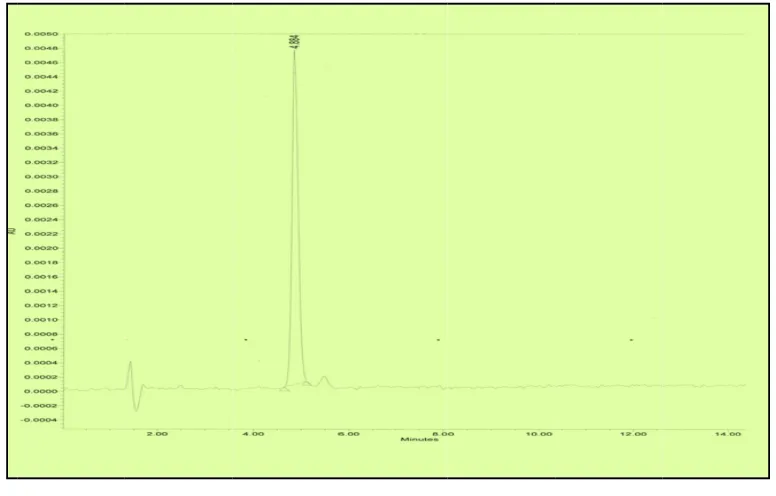
Fig. No: 7 Chromatogram showing peaks of sample solution of Dexibuprofen
Name Retention time
(min)
Area USP Tailing USP Plate count
EVALUATION OF SYSTEM SUITABILITY:
The relative standard deviation for the area of five replicate injections of Dexibuprofen standard solution-2 should be less than 2.0.
Tailing factor for Dexibuprofen peak in the first injection of standard solution-2 should be less than 2.0.
METHOD VALIDATION:
Validation is the process of evaluating products or analytical methods. It includes testing but it is more for instance, the checking the documentation for completeness and correctness.
Validation is defined as documented evidence that a system performance as expected.
OBJECTIVE:
The objective of this validation study is to demonstrate that the proposed method is suitable for its intended use.
This study covers the following parameters,
1. Precision
i. System precision ii. Method precision iii. Intermediate precision
2. Specificity
3. Forced degradation
4. Linearity
5. Accuracy
6. Solution stability
7. Filter interference study
8. Robustness
SYSTEM SUITABILITY TESTING:
The purpose of the system suitability test is to ensure that the complete testing system
EVALUATION OF SYSTEM SUITABILITY
1. The relative standard deviation for the area of five replicate injections of dexibuprofen standard solution should be less than 2.0
2. Tailing factor dexibuprofen peak in the first injection of standard solution should be less than 2.0
3. Theoretical plates for dexibuprofen peak in the first injection of standard solution should be more than 2000 and the results are tabulated and are as shown in Table No
1. PRECISION:
The precision of an analytical procedure expresses the closeness of agreement between
a series of measurements obtained from multiple sampling of the same homogeneous sample under the prescribed conditions. Precision may be considered at three levels: Repeatability, Intermediate precision and Reproducibility.
PROCEDURE:
A) SYSTEM PRECISION:
Preparation of standard solution (100µg/ml):
Weigh accurately and transfer about 50.0 mg of dexibuprofen standard into a 50.0 ml volumetric flask, add 30 ml of methanol sonication to dissolve the content and make up to the volume with methanol (stock solution).
Dilute 5.0 ml of the above solution to 50.0 ml with diluent and mix well. Inject 10µl of the blank solution and the standard solution of 100µg/ml for five times and calculate the %RSD for the area of five replicate injections. The chromatograms are as shown in Fig No: 8 and the results are tabulated in table – 2.
ACCEPTANCE CRITERIA:
Percentage relative standard deviation (%RSD) for peak areas of dexibuprofen is not more than 2.0.
Fig No: 8 Chromatogram showing System Precision of Dexibuprofen
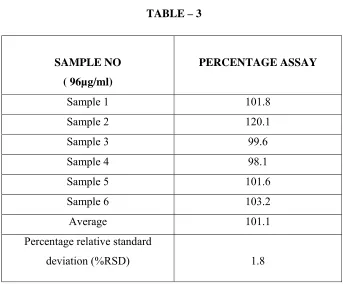
B) METHOD PRECISION: Preparation of sample solution:
Weigh and transfer 8 tablets in to a 200.0 ml volumetric flask, add 10 ml of water and shake for 5 minutes. Add 100 ml of methanol, sonication for 20 minutes with intermediate shaking and make up to the volume with methanol. Mix well and filter the solution through a 0.45µm nylon filter. Dilute 2.0 ml of filtrate to 250.0 ml with diluent.
Inject 10µl of the blank solution and six replicate injections of sample solution for six times and calculate the %RSD for the area of six replicate injections. The chromatograms are as shown in Fig No: 9 and the results are tabulated in table – 3.
ACCEPTANCE CRITERIA:
Fig No: 9 Chromatogram showing Method Precision of Dexibuprofen
C) INTERMEDIATE PRECISION (RUGGEDNESS):
ACCEPTANCE CRITERIA:
Percentage relative standard deviation (%RSD) for assay is not more than 2.0.
2. SPECIFICITY:
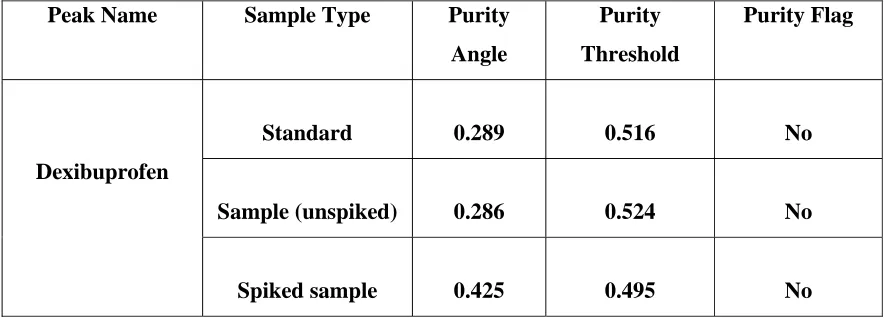
Blank, placebo, standard, sample solution (unspiked) and sample solution spiked with known impurities at 1% level were injected into the HPLC system. There was no interference from the blank and placebo at the retention time of dexibuprofen peak.
Peak purity data reveals that dexibuprofen peak was homogenous and there were no co-eluting peaks at the retention time of dexibuprofen peak.
Calculated the percentage difference between the mean assay of unspiked and spiked sample with respect to unspiked sample. The results are tabulated in table – 5a. The peak purity data of dexibuprofen peak from standard, sample (unspiked) and spiked sample are summarized in table – 5b. The chromatograms are as shown in Fig No: 11 and 12.
ACCEPTANCE CRITERIA:
i. No peaks elutes at the retention time of dexibuprofen in blank and placebo.
ii. The percentage difference between the assay values of spiked and unspiked sample is not more than ± 2.0 with respect to unspiked sample.
iii. Peak purity passes.
Fig No: 11 Chromatogram showing specificity of Dexibuprofen
Fig No: 12 Chromatogram showing specificity of Dexibuprofen
3. FORCED DEGRADATION:
Forced degradation study was carried out by treating the sample under the following conditions.
a) Degradation By Hydrochloric Acid (Acid Treated Sample):
Sample was treated with 10 ml of 5N Hydrochloric acid and kept on bench top for 12 hours. Treated sample solution was analysed as per the testing procedure.
b) Degradation By Sodium Hydroxide (Base Treated Sample):
Sample was treated with 10 ml of 5N sodium hydroxide and kept on bench top for 12 hours. Treated sample solution was analysed as per the testing procedure.
c) Degradation By Hydrogen Peroxide (Peroxide Treated Sample):
Sample was treated with 10 ml of 30% solution of hydrogen peroxide and kept on bench top for 12 hours. Treated sample solution was analysed as per the testing procedure.
d) Degradation By Thermal (Heat Treated Sample):
Sample was kept in an oven at 105ºc for about 24 hours. Treated sample was analysed as per the testing procedure.
e) Degradation By Photo Light [Controlled Condition (Wrapped In Aluminium Foil)]:
Sample was exposed to light of 1.2 million lux hours in protected condition. Treated sample was analysed as per the testing procedure.
f) Degradation By Photo Light [Uncontrolled Condition]:
Sample was exposed to light of 1.2 million lux hours. Treated sample was analysed as per the testing procedure.
The results of forced degradation studies are summarized in table – 6.
ACCEPTANCE CRITERIA:
i. Peak purity for main peak passes.
4. LINEARITY & RANGE:
The linearity of an analytical procedure is its ability (within a given range) to obtain test results which are directly proportional to the concentration (amount) of analyte in the sample.
The range of an analytical procedure is the interval between the upper and lower concentration (amounts) of analyte in the sample (including these concentrations) for which it has been demonstrated that the analytical procedure has a suitable level of precision, accuracy and linearity.
PROCEDURE:
Preparation of standard stock solution:
Weigh accurately and transfer about 50.0 mg of dexibuprofen standard into a 50.0 ml volumetric flask, add 30 ml of methanol sonication to dissolve the content and make up to the volume with methanol.
Preparation of (20, 40, 60, 80, and 100 µg/ml) sample solutions:
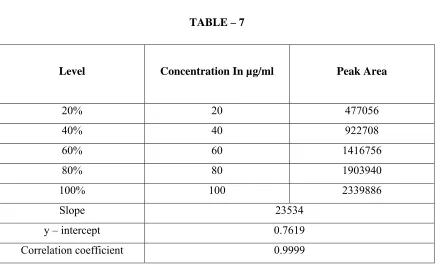
From the above stock solution pipette out 1.0, 2.0, 3.0, 4.0, 5.0 ml respectively into individual 50ml of volumetric flasks and dilute up to the mark with diluent to prepare 20, 40, 60, 80, 100 µg/ml of sample solutions respectively.
Inject 10µl of blank solution and each linearity level standard solutions into the chromatographic system and measure the peak area.
The linearity of dexibuprofen was performed in the range of 20µg/ml to 100µg/ml (20% to 100% of working concentration). A graph was plotted with concentration (µg/ml) on x- axis and peak area on y- axis. Slope, y- intercept, correlation coefficient (r- value) were determined (Fig No: 14).
The chromatograms are as shown in Fig No: 13. The results are tabulated in table – 7.
ACCEPTANCE CRITERIA:
Fig No: 13 Chromatogram showing Linearity of Dexibuprofen
Fig: 14Calibration curve for Dexibuprofen
y = 23534x + 0.7619 R² = 0.9999
0 500000 1000000 1500000 2000000 2500000
0 20 40 60 80 100 120
Peak Area
5. ACCURACY:
The accuracy of an analytical method may be defined as the closeness of the test results
obtained by the method to the true value. It is the measure of the exactness of the analytical method developed. Accuracy may often express as percent recovery by the assay of a known amount of analyte added.
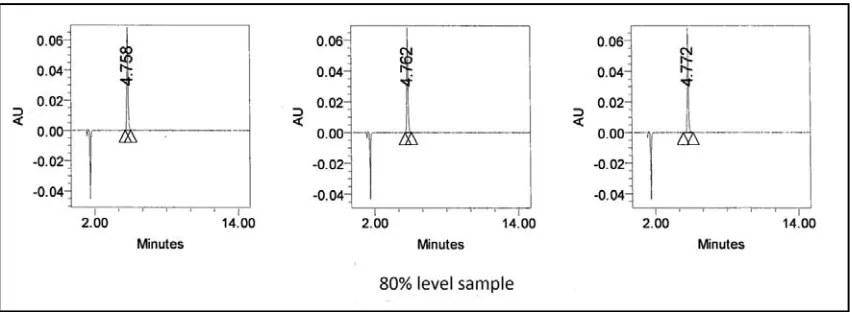
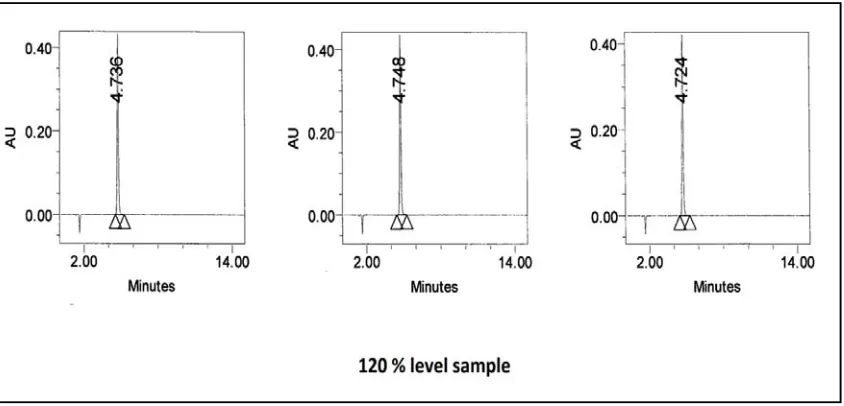
The accuracy was demonstrated by preparing recovery sample. Known amount of dexibuprofen spiked with placebo at about 80%, 100% and 120% of working concentration in triplicate and analysed. Prepared each level in the triplicates and the average value taken to calculate the recovery. The percentage recovery was calculated from the amount found and actual amount added.
The chromatograms are as shown in Fig No: 15-16.1. The results are tabulated in table – 8.
ACCEPTANCE CRITERIA:
Percentage recovery at each level is in between 98.0 to 102.0
[image:61.612.95.521.474.630.2]Percentage relative standard deviation (%RSD) is not more than 2.0 at each level.
Fig No: 16.1 Chromatogram showing 100% Acurracy of Dexibuprofen
[image:62.612.99.521.400.603.2]6. SOLUTION STABILITY:
Stability of analytical solution was verified by analysing the standard solution and sample solution of 300 mg tablets initially and also at different time intervals (4, 8, 12,16,20,24 hrs.) by storing in sample compartment of HPLC instrument at 25ºC (ambient). Calculated the cumulative percentage relative standard deviation (%RSD) for peak areas of dexibuprofen in standard and sample. The chromatograms are as shown in Fig No: 17. The results are tabulated in table – 9.
ACCEPTANCE CRITERIA:
Cumulative percentage relative standard deviation (% RSD) is not more than 2.0 for peaks areas of standard and sample.
7. FILTER INTERFERENCE STUDY:
Filter interference study was performed on sample solution of 300 mg tablets. Prepared
sample as per testing procedure filtered the solution through 0.45µ nylon filter, analysed the sample and the result compared with centrifuged sample result.
The results are tabulated in table – 10.
ACCEPTANCE CRITERIA:
The percentage difference between centrifuged and filtered sample results is not more than ± 2.0 with respect to centrifuged sample results.
8. ROBUSTNESS:
The evaluation of robustness should be considered during the development phase and depends on the type of procedure under study. It should show the reliability of an analysis with respect to deliberate variations in method parameters.
Robustness of the method verified by deliberately varying the following instrumental conditions.
a) By changing the flow rate by ± 0.1ml (0.9ml, and 1.1ml) variation to normal flow rate of 1.0 ml.
b) By changing the wavelength by ± 2 nm. (218nm and 220nm) variation from normal wavelength of 220nm.
c) By changing the mobile phase pH by ± 0.2 units (4.8 and 5.2) variation from normal mobile phase pH 5.0.
Preparation of standard solution (100µg/ml):
Weigh accurately and transfer about 50.0 mg of dexibuprofen standard into a 50.0 ml volumetric flask, add 30 ml of methanol sonication to dissolve the content and make up to the volume with methanol. Dilute 5.0 ml of the above solution to 50.0 ml with diluent an