RP-ESTIM
-HPLC M
MATION O
T
T
h
h
e
e
T
I
I
n
n
DEP
ETHOD D
OF ALL-T
B
D
D
T
T
a
a
m
m
i
i
l
l
N
N
a
a
d
d
n
n
p
p
a
a
r
r
t
t
i
i
a
a
l
l
f
f
u
u
M
MA
AS
S
(
(P
Ph
h
PARTMEN KMCH KOVAI
DEVELOP
TRANS RE
BROCCOL
D
D
i
i
s
s
s
s
e
e
r
r
t
t
a
a
t
t
i
i
o
o
n
n
d
d
u
u
D
D
r
r
.
.
M
M
.
.
G
G
u
u
l
l
f
f
i
i
l
l
m
m
e
e
n
n
t
t
f
f
S
ST
TE
ER
R
OF
O
h
ha
ar
rm
ma
ac
ce
eu
u
A
A
P
P
R
R
NT OF PHA
H COLLEG
I ESTATE,
COIMBAT
PMENT A
ETINOIC
LI AND SP
n
n
S
S
u
u
b
b
m
m
i
i
t
t
t
t
e
e
G
G
.
.
R
R
.
.
M
M
e
e
d
d
i
i
c
c
f
f
o
o
r
r
t
t
h
h
e
e
a
a
w
w
a
a
F
F
P
P
HA
H
AR
R
u
ut
ti
i
ca
c
al
l
A
An
n
R
R
I
I
L
L
-
-
2
2
0
0
1
1
2
2
ARMACEUT
GE OF PHA
KALAPAT
TORE -6410
AND VAL
C ACID IN
PINACH.
e
e
d
d
t
t
o
o
c
c
a
a
l
l
U
U
n
n
i
i
v
v
e
e
r
r
s
s
a
a
r
r
d
d
o
o
f
f
t
t
h
h
e
e
D
D
R
RM
MA
A
CY
C
Y
n
na
al
ly
y
si
s
i
s)
s
)
TICAL ANA ARMACY, TTI ROAD 048.
LIDATION
N PLANT
.
s
s
i
i
t
t
y
y
,
,
C
C
h
h
e
e
n
n
n
n
D
D
e
e
g
g
r
r
e
e
e
e
o
o
f
f
Y
Y
ALYSIS
D,
N FOR TH
EXTRAC
n
RP-ESTIM
-HPLC M
MATION O
The
ETHOD D
OF ALL-T
B
e TamilNaduIn partial f
M Prof. Depart KMC KOVAI
DEVELOP
TRANS RE
BROCCOL
Dissertatiou Dr. M.G.R
fulfilment fo MASTER O (Pharmace Subm T.M Under th .J.Dharuma
Head of th
APR
tment of Ph
CH COLLEG
I ESTATE,
COIMBA
PMENT A
ETINOIC
LI AND SP
on submitte
R Medical U
or the Awar
OF PHARM
eutical Analy
mitted by
anavalan
he guidance
an M. Pharm
he Departm
RIL-2012
harmaceutic
GE OF PHA
KALAPPA
TORE-6410
AND VAL
C ACID IN
PINACH.
d to
University, C
rd of the De
MACY ysis) of m, (Ph.D.) ment cal Analysis ARMACY ATTI ROAD 048
LIDATION
N PLANT
.
Chennai gree DN FOR TH
EXTRAC
Prof. Dr. A. Rajasekaran, M. Pharm, Ph.D.,
Principal,
K.M.C.H. College of Pharmacy,
Kovai Estate, Kalapatti Road,
Coimbatore -641048. (T.N)
CERTIFICATE
This is to certify that, the work embodied in the thesis entitled “RP-HPLC
METHOD DEVELOPMENT AND VALIDATION FOR THE ESTIMATION
OF ALL-TRANS RETINOIC ACID IN PLANT EXTRACT OF BROCCOLI
AND SPINACH” is a bonafide research work carried out by Mr.T.Manavalan
(Reg. No:
26107225
)
,
Student in Master of Pharmacy, Department of
Pharmaceutical Analysis, K.M.C.H. College of Pharmacy, Coimbatore, Tamilnadu,
under the guidance of Prof. J. Dharuman, M.Pharm, (Ph.D) Head, Dept of
Pharmaceutical Analysis, K.M.C.H. College of Pharmacy during the academic year
2011-2012.
Date:
Signature,
Place: Coimbatore.
A. Rajasekaran, Ph.D.,
Prof. J. Dharuman, M.Pharm, (Ph.D)
Head, Department of Pharmaceutical Analysis,
K.M.C.H. College of Pharmacy,
Coimbatore -641048.
CERTIFICATE
This is to certify that, the work embodied in the thesis entitled “RP-HPLC
METHOD DEVELOPMENT AND VALIDATION FOR THE ESTIMATION
OF ALL-TRANS RETINOIC ACID IN PLANT EXTRACT OF BROCCOLI
AND SPINACH” is a bonafide research work carried out by Mr.T.Manavalan
(Reg.No:26107225), Student in Master of Pharmacy, Department of Pharmaceutical
Analysis, K.M.C.H. College of Pharmacy, Coimbatore, Tamilnadu, under my
supervision and guidance during the academic year 2011-2012.
I wish him best career,
Signature,
Date: Prof. J. Dharuman, M. Pharm (Ph.D)
DECLARATION
I am here by stating that, to the best of my knowledge and belief, the project report
entitled “
RP-HPLC METHOD DEVELOPMENT AND VALIDATION FOR
THE ESTIMATION OF ALL-TRANS RETINOIC ACID IN PLANT
EXTRACT OF BROCCOLI AND SPINACH is being submitted for the
partial fulfilment of Master of Pharmacy in Pharmaceutical Analysis for the academic year 2011-2012 of KMCH. College of Pharmacy affiliated to The Tamilnadu Dr. M.G.R. Medical University carried out under the guidance of Prof. J. Dharuman, M.Pharm (Ph.D), Head, Department of Pharmaceutical Analysis, KMCH College of Pharmacy, Coimbatore.I abide that all the data presented in this report will be treated with utmost confidentiality.
Date: T.Manavalan
Place: (Reg No: 26107225)
EVALUATION CERTIFICATE
This is to certify that, the work embodied in the thesis entitled “
RP-HPLC METHOD
DEVELOPMENT AND VALIDATION FOR THE ESTIMATION OF
ALL-TRANS RETINOIC ACID IN PLANT EXTRACT OF BROCCOLI AND
SPINACH submitted by
Mr.T.Manavalan(Reg. No: 26107225), to The Tamilnadu Dr. M.G.R. Medical University, Chennai, in partial fulfilment for the Degree of Master of Pharmacy, inPharmaceutical Analysis, is a bonafide research work carried out by the candidate at K.M.C.H.
College of Pharmacy, Coimbatore, Tamilnadu, the same was evaluated by us during academic year 2011-2012.
Examination Center: KMCH College of Pharmacy, Coimbatore.
Date:
Internal Examiner External Examiner
ACKNOWLEDGEMENT
My dissertation entitled “
RP-HPLC METHOD DEVELOPMENT AND
VALIDATION FOR THE ESTIMATION OF ALL-TRANS RETINOIC ACID
IN PLANT EXTRACT OF BROCCOLI AND SPINACH
” would not have been a feasible one without the grace of god almighty who gave me morale till the completion of my project.I am extremely thankful to my Academic Guide Prof. J. Dharuman, M.Pharm,
(Ph.D) Head, Department of Pharmaceutical Analysis, KMCH. College of Pharmacy, for his
constant insight, guidance, countless serenity, encouragement and painstaking efforts in my project work. I am indebted to his kindness and never failing cooperation.
To begin with I would like to thank Dr. A. Rajasekaran, M. Pharm, Ph.D.,Principal, K.M.C.H. College of Pharmacy for his constant encouragement, support and the facilities provided.
I will always remain indebted to Dr Nalla G. Palanisamy, Chairman, and Dr.
Thavamani D. Palanisamy, Managing Trustee, K.M.C.H. College of Pharmacy, Coimbatore
for all the facilities, which have been provided to us at the institution, enabling me to do work of this magnitude.
My special thanks to all teaching and non-teaching staff members of KMCH College Pharmacy, Coimbatore, Library and computer lab faculties who directly or indirectly gave a helping hand during the course of study.
This project would not be a resplendent one without the timely help and continuous support by my ever Friends of the Pharmaceutical Ananlysis (CH. Rambabu, M. Venkana
Babu, T. Srikanth Reddy, J. K. Ghaharin, Dona Sara Kurian, A. V. S. Hemanth, Tinu
Thomas, G. Arun Kumar) and my M.Pharm Ist year juniors (G. Venkatesh, T.
Chaitanya,) and I take this opportunity to acknowledge them with thanks.
Finally I would like to express my sincere thanks to all those people who directly or indirectly helped me to complete this work successfully.
Above all I dedicate myself before the unfailing presence of GOD and constant love and encouragement given to me by my beloved Father, Mother, Sister and all of my family memberswho deserves the credit of success in whatever work I did.
Yours sincerely,
T.Manavalan.
ABBREVIATIONS
HPLC High Performance Liquid Chromatography
UV Ultra violet
BA Bioavailability
M.W. Molecular weight
e.g. Example
i.e. That is
% Percentage
PDA Photo Diode Array
I.S Internal Standard
ACN Acetonitrile
CDSCO Central Drugs Standard Control Organization
RF Response Factor
Mg Milligram
Ml Milliliter
µg Microgram
W/w Weight by weight
V/v Volume by volume
ng /ml nanogram per milliliter
PH Hydrogen ion concentration
0C Degree centigrade
T Time
Abs. Absorbance
Conc. Concentration
Fig. Figure
Tab. Table
M.P. Melting Point
AUC Area under curve
CV Coefficient of variance
RSD Relative standard deviation
L/h Liter per hour
L/kg Liter per kilogram
Rpm Rotation per minute
INDEX
CHAPTER
CONTENT
PAGE
1
Introduction
01
2
Literature
review
25
3
Drug
profile
29
4
Plant
profile
30
5
Aim
&
objective
34
6
Methodology
36
7
Quantification
&
Validation
41
8
Result
&
Discussion
44
9
Summary
&
conclusion
60
10
Bibliography
62
INTRODUCTION
Nature has given on us a very rich botanical wealth and various types of plants grow in different parts of the country (Jignaet al., 2005). According to a conservative estimation, 300,000-400,000 plant species grow on Earth; however, only a small percentage have had their phytochemistry and biological function investigated (Kitani, et al., 2001). Since ancient times herbal medicine are used for various treatment and in most of the developing countries 75-80% of the whole population rely on herbal medicine because of better cultural acceptability, better compatibility with the human body and fewer side effects. Hence, the last few years have seen a major increase in their use in the developed countries. For example four out of ten Americans used alternative medicine therapies in 1997; total visits to alternative medicine practitioners increased by almost 50% from 1990 and exceeded the visits to all US primary care physicians (Grabley and Thiericke, 1999). Thirty per cent of the worldwide sales of drugs are based on natural products. India is rich in different levels of biodiversity, namely species diversity, genetic diversity and habitat diversity. In India enormous number of medicinal plants are available naturally which accounts for great economic values (Jignaet al., 2005).
purposes. Hence, pharmaceutical sector is focused on development of new drugs, innovative/indigenous processes for known drugs and development of plant-based drugs through investigation of leads from the traditional systems of medicine. Even though the current accepted modern medicine or Allopathy has gradually developed over the years by scientific and observational efforts of scientists, the basis of its development remains rooted in traditional medicine and therapies. Ancient wisdom has been the basis of modern medicine and will remain as one important source of future medicine and therapeutics (Patwardhan and Hooper, 1992).
Nature based treatments gaining much importance now a days due to number of reasons like development of drug-resistance by microorganisms to antibiotics, side effects of modern drugs, and emerging diseases where no medicines are available, which have stimulated the interest on plants as a significant source of new medicines. Researchers are experiencing difficulty in identifying new lead structures, templates and scaffolds in the finite world of chemical diversity. A number of synthetic drugs have adverse and unacceptable side effects. There have been impressive successes with botanical medicines. Considerable research on pharmacognosy, chemistry, pharmacology and clinical therapeutics has been carried out on (Dahanukaret al., 2000) to bring the numerous molecules like rauwolfia alkaloids for hypertension, psoralens in vitiligo, holarrhena alkaloids in amoebiasis, guggulsterons as hypolipidemic agents, mucunapruriensfor Parkinson’s disease, piperidines as bioavailability enhancers and baccosides in mental retention (Patwardhan, 2003). A whole range of chronic and difficult-to-treat diseases such as cancers, cardiovascular disease, diabetes, rheumatism and AIDS, all require new effective drugs. Therefore, pharmaceutical industry is now focused to develop herbal based medicines. As a result many herbal products are available in market but the quality, efficacy and safety remain unclear. Because herbal products are easily adulterated, mislabelled and even lacking in active content. Hence, standardization is an important issue and this seems to be a logical solution for quality control of herbal products, however it is not an easy process due to the presence of complex phytoconstituents.
herbal medicinal preparations. For these, chromatographic methods like high performance liquid chromatography (HPLC), thin layer chromatography (TLC), high performance thin layer chromatography (HPTLC), and gas chromatography (GC) are routinely used as valuable tools for qualitative determination of small amounts of impurities, Identification and quantification of active constituent present in the herbal formulations. (Quality Control Methods for Medicinal Plant Materials, WHO, Geneva, 1998).
High-performance liquid chromatography (HPLC) is nowadays one of the separation techniques most extensively used in the phytochemistry and pharmaceutical industry for quality control because of its high selectivity, efficacy and speed (Merken and Beecher, 2000). Validation of an HPLC test method is mandatory in implementing a quality control system in any laboratory and ensures that the methodology is sufficiently selective, accurate, reproducible and robust over the range specified for analysis (ICH, 1996)
The present study is aimed to develop a validated HPLC method for the quantification of All-trans retinoic acid in plant extracts namely Broccoli (Brassica oleracea), Spinach
(Spinacia oleracea).
Analytical methods development and validation [1-4] plays a crucial role in the discovery, development, and manufacture of pharmaceuticals.
Pharmaceutical products formulated with more than one drug, typically referred to as combination products, are intended to meet previously unmet patients need by combining the therapeutic effects of two or more drugs in one product.
These combination products can present daunting challenges to the analytical chemist responsible for the development and validation of analytical methods. High performance liquid chromatography (HPLC) for drug products containing more than one active ingredient. The official test methods that result from these processes are used by quality control laboratories to ensure the identity, purity, potency, and performance of drug products.
introduction of better drugs by competitors. Under these conditions, standards and analytical procedures for these drugs may not be available in the pharmacopoeias. It becomes necessary, therefore to develop newer analytical methods for such drugs.
Importance of analytical chemistry is to gain information about the qualitative and quantitative composition of substance and chemical species, that is, to find out what a substance is composed of and exactly how much it is present.
Pharmaceutical analysis deals with the analysis of the pharmaceutical substances. It is generally known that pharmaceutical is a chemical entity of therapeutic interest.
Pharmaceutical analysts in research and development (R&D) of pharma industry plays a vital role in new drug development and follow up activities to assure that, a new drug product meets the established standards, its stability, and continued to meet the purported quality throughout its shelf life.
Analytical method development is required for:
¾ Herbal products
¾ New process and reactions
¾ Active ingredients (Macro analysis)
¾ Residues (Microanalysis)
¾ Impurity profiling
¾ Component of interest in different matrices
¾ Clinical pharmacokinetic studies
¾ Quality control department in industries
Basic criteria for new method development of drug analysis:
The drug or drug combination may not be official in any pharmacopoeias,
A proper analytical procedure for the drug may not be available in the literature due to patent regulations,
Analytical methods may not be available for the drug in the form of a formulation due to the interference caused by the formulation excipients,
Analytical methods for the quantitation of the drug in biological fluids may not be available,
The existing analytical procedures may require expensive reagents and solvents. It may also involve cumbersome extraction and separation procedures and these may not be reliable.
Method development [5-7]
• Planning
• Method development • Customer evaluation testing • Validation experiments • Method transfer experiments • Final method in use
• Final result
CHROMATOGRAPHY [8, 9]
Chromatography is a group of technique for the separation of the compounds of mixtures by their continuous distribution between two phases. One is stationary phase and the other is mobile phase. As a general rule, highly polar materials are best separated using partition chromatography, while very non polar materials are separated using adsorption chromatography. Between extremes, either process might be applicable.
Fig: 1 Schematic Diagram of a HPLC instrument
[image:16.612.130.486.486.687.2]
HPLC Methods of Analysis for Drugs in Combination:
Most of the drugs in multi component dosage forms can be analyzed by HPLC method because of the several advantages like rapidity, specificity, accuracy, precision and ease of automation in this method. HPLC method eliminates tedious extraction and isolation procedures. Some of the advantages are:
Speed (analysis can be accomplished in 20 minutes or less),
Greater sensitivity (various detectors can be employed),
Improved resolution (wide variety of stationary phases),
Reusable columns (expensive columns but can be used for many analysis),
Ideal for the substances of low volatility,
Easy sample recovery, handling and maintenance,
Instrumentation tends itself to automation and quantitation (less time and less labour),
Precise and reproducible,
Calculations are done by integrator itself,
Suitable for preparative liquid chromatography on a much larger scale.
The different types of chromatography
9 Adsorption chromatography
9 Partition chromatography
9 Ion Exchange chromatography
9 Gel permeation chromatography
9 Column chromatography
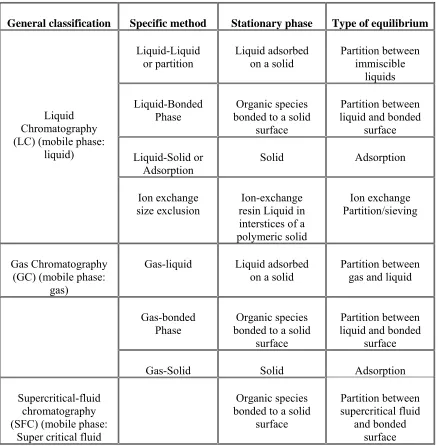
Table no: 1 CLASSIFICATION OF COLUMN CHROMATOGRAPHIC METHODS
General classification Specific method Stationary phase Type of equilibrium
Liquid Chromatography (LC) (mobile phase:
liquid)
Liquid-Liquid
or partition Liquid adsorbed on a solid Partition between immiscible liquids
Liquid-Bonded
Phase bonded to a solid Organic species surface
Partition between liquid and bonded
surface
Liquid-Solid or
Adsorption Solid Adsorption
Ion exchange size exclusion
Ion-exchange resin Liquid in interstices of a polymeric solid
Ion exchange Partition/sieving
Gas Chromatography (GC) (mobile phase:
gas)
Gas-liquid Liquid adsorbed
on a solid Partition between gas and liquid
Gas-bonded
Phase bonded to a solid Organic species surface
Partition between liquid and bonded
surface
Gas-Solid Solid Adsorption
Supercritical-fluid chromatography (SFC) (mobile phase:
Super critical fluid
Organic species bonded to a solid
surface Partition between supercritical fluid and bonded surface
There are different modes of separation in HPLC. They are normal phase mode, reversed phase mode, reverse phase ion pair chromatography, affinity chromatography and size exclusion chromatography.
In the normal phase mode, the stationary phase is polar (bonded siloxane with a
compounds, therefore take more times to elute. Normal phase mode of separation is therefore, not generally used for pharmaceutical applications because most of the drug molecules are polar in nature and hence take longer time to elute.
Reversed phase mode is the most popular mode for analytical and preparative separations of
compound of interest in chemical, biological, pharmaceutical, food and biomedical sciences. In this mode, the stationary phase is non-polar hydrophobic packing with octyl or octadecyl functional group bonded to silica gel and the mobile phase is polar solvent (methanol, acetonitrile, tetrahydrofuran, water, or usually a mixture of water with one of the organic solvents).
An aqueous mobile phase allows the use of secondary solute chemical equilibrium (such as ionization control, ion suppression, ion pairing and complexation) to control retention and selectivity and for adjusting the polarity. The organic solvent is called the
modifier, and acetonitrile is the most common one.
The polar compound gets eluted first in this mode and nonpolar compounds are retained for longer time. As most of the drugs and pharmaceuticals are polar in nature, they are not retained for longer times and hence elute faster. The different columns used are octadecylsilane (ODS) or C18, C8, C4, etc., (in the order of increasing polarity of the stationary phase).
Reverse phase chromatography is widely in use due to the following advantages.
¾ Many compounds such as biologically active substances, have limited solubility in the nonpolar mobile phase that are employed in normal-phase chromatography.
¾ Ionic or highly polar compounds have high rate of adsorption on straight silica or alumina columns and therefore can elute as tailing peaks.
¾ Column deactivation from polar modifiers is a problem in liquid-solid chromatography which frequently can lead to irreproducibility in chromatographic systems.
¾ Ionic compounds can be chromatographed by using ion-exchange chromatography. This mode of chromatography is tedious because precise control of variables such as pH and ionic strength is required for reproducible chromatography.
QUANTITATION:
Quantitation Methods in HPLC:
Peak height or peak area measurements only provide a response in terms of detector signal. This response must be related to the concentration or mass of the compound of interest. To accomplish this, some type of calibration must be performed.
The four primary techniques for quantitation are
1. Normalized peak area method 2. External Standard method 3. Internal Standard method 4. Method of Standard addition
1. Normalized peak area method:
The area percent of any individual peak is referred to the normalized peak area. This technique is widely used to estimate the relative amounts of small impurities or degradation compounds in a purified material and in this method; the response factor for each component is identified.
2. External Standard method:
This method includes injection of both standard and unknown and the unknown is determined graphically from a calibration plot or numerically using response factors.
A response factor (Rf) can be determined for each standard as follows
Rf = Standard Area (Peak height) Standard Concentration
samples. External standards are often used to ensure that the total chromatographic system is performing properly and can provide reliable results.
3. Internal Standard method:
A widely used technique of quantitation involves the addition of an internal standard to compensate for various analytical errors. In this approach, a known compound of a fixed concentration is added to the known amount of samples to give separate peaks in the chromatograms to compensate for the losses of the compounds of interest during sample pretreatment steps. Any loss of the component of interest will be accompanied by the loss of an equivalent fraction of the internal standard. The accuracy of this approach obviously dependence on the structural equivalence of the compounds of interest and the internal standard.
The requirements for an internal standard are:
It must have a completely resolved peak with no interferences,
It must elute close to the compound of interest,
It must behave equivalent to the compound of interest for analysis like pretreatments, derivative formations, etc.
It must be added at a concentration that will produce a peak area or peak height ratio of about unity with the compound,
It must not be present in the original sample,
It must be stable, un reactive with sample components, column packing and the mobile phase and
It is desirable that this compound is commercially available in high purity.
STD I A
Ax Rf
. . =
On the basis of the response factor and strength of the internal standard (NISTD), the amount of the analyte in the original sample can be calculated using the formula,
STD STD
F S
xN A R
A
X 1.
1 .
=
The calculations described above can be used after proving the linearity of the calibration curve for the internal standard and the analytical reference standard of the compound of interest. When more than one component is to be analyzed from the sample, the response factor of each component should be determined in the calculations using similar formula.
4. Method of Standard addition:
Optimiz O A reason symmetri composit F within th the peaks
ation of Ch
Optimization nable chrom ical peaks tion, the shif
rom a few e he range of in s are symme
Flow ch
romatograp
can be start matogram me
on the ch fting of the p
experimenta nvestigated etrical and ar
hart of HPL
phic Condit
ted only afte eans that al hromatogram
peaks can be
al measurem changes. An re well separ
LC method d
tions:
er a reasonab ll the compo m. By a sl
e expected.
ments, the po n optimized rated in less
developmen
ble chromato ounds are d light change
osition of th chromatogra run time.
nt
ogram has b detected by e of the m
e peaks can am is the on
been obtained more or les mobile phas
n be predicte e in which a
d. ss se
System Suitability:
System suitability testing is an integral part of analytical procedures.
The tests are based on the concept that the equipment, electronics, analytical operations and samples to be analyzed constitute an integral system that can be evaluated as such.
System suitability test parameters to be established for a particular procedure depend on the type of procedure being validated.
The peak resolution can be increased by using a more efficient column with higher theoretical plate number, N.
The parameters that are affected by the changes in chromatographic conditions, It includes the following parameters, but not necessarily to comply all the parameters.
• Resolution (Rs), • Capacity factor (k’), • Selectivity (α),
• Column efficiency (N) and • Peak asymmetry factor (As).
i) Resolution (Rs)
The resolution, Rs, of two neighboring peaks is defined by the ratio of the distance between the two peak maxima. It is the difference between the retention times of two solutes divided by their average peak width. For baseline separation, the ideal value of Rs is 1.5. It is calculated by using the formula,
Rs =
(
)
2 1
1 2 5 .
0 W W
Rt Rt
+ −
Where, Rt1 and Rt2 are the retention times of components 1 and 2 and
W1 and W2 are peak widths of components 1 and 2.
ii) Capacity factor (k’)
isocratic separation. The ideal value of k’ ranges from 2-10. Capacity factor can be determined by using the formula,
K’ = S
V V V × − 0 0 1
Where, V1 = retention volume at the apex of the peak (solute) and
V0 = void volume of the system.
The values of k’ of individual band increase or decrease with changes in solvent strength. In reversed phase HPLC, solvent strength increases with the increase in the volume of organic phase in the water / organic mobile phase. Typically an increase in percentage of the organic phase by 10 % by volume will decrease k’ of the bands by a factor of 2-3.
iii) Selectivity (α)
The selectivity (or separation factor), α is a measure of relative retention of two components in a mixture. The ideal value of selectivity is 2. It can be calculated by using the formula,
α =
0 1 0 2 V V V V − −
Where, V0 is the void volume of the column and V2 and V1 are the retention volumes of the second and the first peak respectively.
iv) Column efficiency (N)
Efficiency, N, of a column is measured by the number of theoretical plates per meter. It is a measure of band spreading of a peak. Smaller the band spread, higher is the number of theoretical plates, indicating good column and system performance. Columns with N ranging from 2000 - 100,000 plates/meter are ideal for a good system. Efficiency is calculated by using the formula,
N = 2 2 16
W Rt
,
v) Peak asymmetry factor (As)
Peak asymmetry factor, as, can be used as a criterion of column performance. The peak half width, b, of a peak at 10 % of the peak height, divided by the corresponding front half width, a, gives the asymmetry factor.
As =
a b
For a well packed column, an asymmetry factor of 0.9 to 1.1 should be achievable.
System Suitability Parameters and Recommendations (ICH Guidelines)
Parameter Recommendation
Capacity Factor (k’) the peak should be well-resolved from other peaks and
the void volume, generally k’>2.0
Repeatability RSD </= 1% for N >/= 5 is desirable.
Relative retention not essential as long as the resolution is stated.
Resolution (Rs) Rs of > 2 between the peak of interest and the closest
eluting potential interferent (impurity, excipients,
degradation product, internal standard, etc.
Tailing Factor (T) T of </= 2
Theoretical Plates (N) In general should be > 2000
VALIDATION OF ANALYTICAL METHOD:
INTRODUCTION:
Analytical method validation is the process of demonstrating that analytical procedures are suitable for their intended use and provide accurate test results that evaluate a product against its defined specification and quality attributes [10].
The U.S. Federal Register states “Validation data must be available to establish that the analytical procedures used in testing meets proper standards of accuracy and reliability [11]”any analytical test methods are expected to be used in a Quality Control environment they require an additional degree of refinement compared to research methods [12]
.
¾ When methods are properly developed, they readily validate.
¾ Validation is not a method development tool and it does not make a method good or efficient.
¾ Validation acceptance criteria should be based on method development experience.
VALIDATION OF ANALYTICAL PROCEDURES [13-17]
Different Types of Validation characteristics [18]
Generalized validation process for an HPLC assay method:
Validation is the process of collecting documented evidence that the method performs according to its intended purpose.
1. Precision:
The precision of test method is usually expressed as the standard deviation or relative standard deviation of a series of measurements.
Precision may be considered at three levels: Repeatability, Intermediate Precision and Reproducibility.
Acceptance Criteria:
¾ Percentage Relative standard deviation (%RSD) NMT 1 % (Instrument precision)
¾ (%RSD) NMT -2% (Intra- assay precision)
2. Accuracy [19]:
The ICH guideline recommends that accuracy should be determined using a minimum of nine determinations over a minimum of three concentration levels covering the specified range (ICH, 1996). Spiked samples are prepared in triplicate at three levels over a range that covers 80 -120% of the target concentration for assay methods and over a range that covers the expected impurity content of a sample for impurity methods (Shabir, 2003).
There are several methods that can be used for determining accuracy. The most common include:
Analyze a sample of known concentration and compare the measurement to the true value. In this case, method accuracy is the agreement between the difference in the measured analyte concentration and the known amount of analyte added. That is the accuracy or % recovered is calculated as:
Cm × 100 Ct
Where Cm is the measured concentration and Ct is the theoretical concentration. Accuracy has also been reported as a sample is analyzed and the measured value should ideally be identical to the true value. Accuracy is represented and determined by recovery experiments. The usual range is being 10% above or below the expected range of claim. The % recovery was calculated using the formula,
100 ) ( cov Re %
bX a b a
ery= + −
Where,
Acceptance Criteria:
¾ For an assay method, mean recovery will be 100%± 2% at each concentration over the range of 80-120% of the target concentration.
¾ For an impurity method, mean recovery will be 0.1% absolute of the theoretical
concentration or 10% relative, whichever is greater for impurities in the range of 0.1-2.5 % (V/W).
3. Detection Limit:
It is lowest amount of analyte in a sample that can be detected but not necessarily quantitated under the stated experimental conditions.
Following are different approaches: i. Visual Evaluation Method:
Prepare the sample solutions with known lowest possible concentrations of analyte and establish the minimum concentration at which the analyte can be reliably detected by analyzing as per test method.
ii. Based on Signal to Noise Ratio Method:
The LOD can be expressed as a concentration at specified signal-to-noise ratio obtained from samples spiked with analyte. A signal-to-noise ratio between 3:1 and 2:1 is generally considered acceptable.
iii. Based on the standard Deviation of the Response and the Slope:
¾ Prepare the blank solution as per test method and inject six times into the chromatographic system.
¾ Similarly prepare the linearity solution staring from lowest possible concentration of analyte to 150 % (or as per protocol) of target concentration and establish the linearity curve.
The detection limit (DL) may be expressed as:
3.3 X Standard deviation of the response of the blank (σ) LOD =
Slope
4. Quantitation Limit:
It is lowest amount of analyte in a sample, which can be quantitatively determined with acceptable accuracy and precision.
Following are different approaches: i. Visual Evaluation Method:
Prepare the sample solutions with known lowest possible concentrations of analyte and establish the minimum concentration at which the analyte can be reliably quantified by analyzing as per test method.
ii. Based on signal to noise ratio method :
The LOQ can be expressed as a concentration at specified signal-to-noise ratio obtained from samples spiked with analyte. A signal-to-noise ratio of 10:1 is generally considered acceptable. The ratio recognized by the ICH (1996) is a general rule. It has been stated that “The determination of LOQ is a compromise between the concentration and the required precision and accuracy. That is, as the LOQ concentration level decreases, the precision increases”.
iii. Based on the standard Deviation of the Response and the Slope:
¾ Prepare the blank solution as per test method and inject six times into the chromatographic system.
¾ Similarly prepare the linearity solution staring from lowest possible concentration of analyte to 150% (or as per protocol) of target concentration and establish the linearity curve.
The Quantification limit (QL) may be expressed as:
10 X Standard deviation of the response of the blank (σ) LOQ =
Slope
The slope shall be estimated from the calibration curve of the analyte.
Acceptance Criteria:
¾ In Pharmaceutical application, the LOQ is typically set at minimum 0.05% for active pharmaceutical ingredients.
¾ LOQ defined as the lowest concentration providing a RSD of 5%.
LOQ should be at least 10% of the minimum effective concentration for clinical applications
5. Specificity:
The ability to assess unequivocally the analyte in the presence of components that may be expected to present, such as impurities, degradation products and matrix components, etc. Specificity shall be demonstrated by performing Placebo / blank interference and forced degradation studies.
1. Blank interference:
Prepare blank solution as per test method and analyse as per test method. 2. Placebo interference (In case of Drug products):
Prepare the placebo solution equivalent to the test concentration (Subtract the weight of active ingredient) and analyse as per test method.
3. Force Degradation studies:
Degrade the sample forcefully under the various stress conditionslike Light, heat, humidity, acid / base / water hydrolysis and oxidation and ensure the degradation from 1 % to 20 %.
Light: Expose the Drug product, drug substance and placebo to UV light for about 200
watt hours / square meter and the overall illumination not less than 1.2 million Lu hours [17]
for visible light. Prepare the sample and placebo solution as per test method and analyse.
Heat: Expose the Drug product, drug substance and placebo at 105 °C for about 12
hours (For substance having low melting point below 10°C of its melting point). Prepare the sample and placebo solution as per test method and analyse.
Humidity: Expose the Drug product, drug substance and placebo for about 80 % RH at
about 25°C for about one week. Prepare the sample and placebo solution as per test method and analyse.
Acid / Base: Prepare the acid or base solution of 0.1N and reflux the sample and placebo
Water: Reflux the sample / placebo with 100 ml of purified water for 12 hour at 60°C.
Dissolve the contents in diluents as per test method. Change the reflux time so as to ensure the desired degradation.
Oxidation: Reflux for 12 hour at 60°C with 1 % H2O2 or suitable oxidant. Dissolve the
contents in diluents as per test method. Change the reflux time so as to ensure the desired degradation.
Note: Based on the physicochemical properties and literature stress conditions can be
decided.
Acceptance Criteria:
¾ Placebo / Blank should not elute at the retention time of analyte peak and known impurity peak.
¾ Peak purity of analyte peak should be confirmed.
¾ Degradation of active analyte peak should be from 1% to 20%.
6. Linearity and range:
The linearity of an analytical method is its ability to elicit test results that are directly (or by a well defined mathematical transformation) proportional to the analyte concentration in samples within a given range. The linear range of detectability that obeys Beer’s law is dependent on the compound analyzed and the detector used. The working sample concentration and samples tested for accuracy should be in the linear range. The claim that the method is linear is to be justified with additional mention of zero intercept by processing data by linear least square regression. Data is processed by linear least square regression declaring the regression co-efficient and b of the linear equation,
Y= aX + b
together with the correlation coefficient of determination r. For the method to be linear the r value should be close to1. Where Y is the measured output signal, X is the concentration of sample, a is the slop, b is the intercept.
If linearity is not meeting the acceptance criteria, establish the range of concentration in which it is linear.
Acceptance criteria:
Coefficient of correlation should be NLT 0.99.
7. Robustness:
It is a measure of method's ability to remain unaffected by small but deliberate variations in method parameters and provides an indication of its reliability during normal usage. For example a chromatographic method, the typical method parameters need to change deliberately and verify during method validation:
Flow rate : (+/- 0.2ml/minutes). Mobile phase composition : (+/- 10% of organic phase). Column oven temperature : (+/- 5°C).
PH of buffer in mobile phase : (+/- 0.2 units). Filter suitability : (At least two filters).
For Variations:
1. System suitability should meet the acceptance criteria as per test method.
2. If system suitability doesn’t meet, narrow the variation range and carryout the experiment again to meet system suitability.
8. Ruggedness:
The United States of Pharmacopeia (USP) defines Ruggedness as “the degree of reproducibility of test results obtained by the analysis of the same samples under a variety of normal test conditions, such as different labs, different analysts, and different lots of reagents. Ruggedness is a measure of Reproducibility of test results under normal, expected operational conditions from laboratory to laboratory and from analyst to analyst”.
The following are the typical method parameters need to be tested during method validation:
Analyst-to-Analyst variability. Column-to-Column variability. System-to-System variability. Different days.
Different Laboratories.
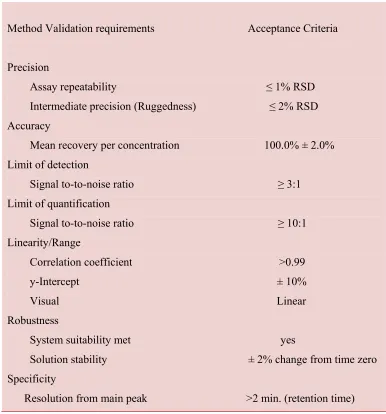
Method Validation Requirements for Example (ICH)
Table no: 2
Method Validation requirements Acceptance Criteria
Precision
Assay repeatability ≤ 1% RSD Intermediate precision (Ruggedness) ≤ 2% RSD Accuracy
Mean recovery per concentration 100.0% ± 2.0% Limit of detection
Signal to-to-noise ratio ≥ 3:1 Limit of quantification
Signal to-to-noise ratio ≥ 10:1 Linearity/Range
Correlation coefficient >0.99 y-Intercept ± 10% Visual Linear Robustness
System suitability met yes
Solution stability ± 2% change from time zero Specificity
Resolution from main peak >2 min. (retention time)
REVIEW OF LITERATURE
Vickie Tatum et al(2005) [20] have reported RP- HPLC assay method for All-trans retinoic acid. Chromatographic separation was achieved on an C18 reversed phase column Using 85% methanol and 15% 0.01 M sodium acetate buffer, pH 5.2, as the mobile phase and at a flow rate of 1.5 ml/min. Retinol, retinal, all-trans-retinoic acid and 13-cis-retinoic acid were eluted from a 5 μm C18 reversed-phase column (4.6mm I.D., 15 cm) in less than 14 min. Retinyl acetate, was eluted in 25.5 min under the above conditions. Each compound was detected at the most sensitive wavelength by coupling fluorescence and UV detection.
Lopez-Abater et al(2003) [21] have developed a method for the simultaneous determination of retinol acetate, α-Tocopherol and α-Tocopherol acetate. Method I: the fat milk sample was extracted with ethanol-hexane and injected directly into the chromatographic column. Method II: the power milk sample was extracted with ethanol-hexane and also injected directly into the column. Under optimum conditions the limits of detection for retinol acetate, δ-, β-, α-Tocopherol and α-Tocopherol acetate were 0.33, 21.2, 32.9, 32.5 and 3 .2 ng and the limits of quantification were 0.42, 25.3, 37.9, 36.8 and 6.3 ng, respectively. The precision results showed that the relative standard deviations of repeatability and reproducibility were between 0.74 and 5.7%.
David J. Hart et al(1999) [22] have performed studies that examine the factors which affect the chromatographic response of carotenoids and contribute to analytical variation and inaccuracies in their quantitative determination. The addition of a solvent modifier (triethylamine) to the mobile phase was shown to improve the recovery of carotenoids from the column from around 60% to over 90%. Analysis showed that good sources (>1000
μg/100 g) of lutein were broccoli, butter head lettuce, parsley, peas, peppers, spinach and watercress; of lycopene: tomatoes and tomato products; and of β-carotene: broccoli, carrots, greens, butter head lettuce, mixed vegetables, parsley, spinach and watercress. There was little or no loss of carotenoids on cooking, green vegetables showed an average increase in lutein levels of 24% and in β-carotene levels of 38%.
RA isomers was similar for each visit with 13-cis-RA having the highest concentrations followed by 9-cis-RA and all-trans-RA. The within-person variability of total RA and individual isomers was low.
Raphael Vazquez et al(2009) [24] have reported a RP-HPLC separation on an Zorbax C18 column (150 mm x 4.6 mm, 2.5 µm particle size)using a mobile phase consisting of a mixture ammonium acetate 10 mM, pH 4.5 (solvent A) and methanol (solvent B). The separation was achieved within 35 minutes and the detection was performed by UV spectrometry-tandem mass spectrometry. The validation of the method was performed by the statistical evaluation for intra-day (n =6) and inter-daycalibrations (n =7); it was found to be satisfactory in terms of selectivity, accuracy (recovery between 100.0 and 102.3%) and precision (intra-day and inter-day precision between 1.0 and 10.2% and between 0.7 and 11.8%, respectively).
Amin Ismail et al(2003)[25]have developed a RP-HPLC method for vitamin analysis, to identify and quantify β -carotene, vitamin C and riboflavin. A ultra sphere octa decyl silyl (ODS) hypersil C18, 5 mm particle size, in a 250 mm length x 4.0 mm I.D stainless steel column is used with a mobile phase mixture of acetonitrile: methanol: ethyl acetate (88:10:2). Flow rate of 1ml/min is maintained. UV detection at detection at 250nm.
A.M dzerk et al(1998) [26] have been developed a RP-HPLC method for the quantitation of 9-cis-retinoic acid and its major metabolite, 4-oxo-9-cis-retinoic acid in human plasma. Samples were buffered and extracted with methyl-tert-butyl-ether. The analytes and an I.S. were separated on a C18 HPLC column using a shallow gradient of 70– 89% organic solvent. The analytes were quantitated by UV detection at 348 nm. Selectivity against endogenous compounds and potential metabolites was demonstrated. The run time was 29 min. The standard curve was linear from 2.5 to 450 ng/ml. Inter assay precision for both analytes in quality control samples was less than 5.0% RSD.
found to be <1%. The result of accuracy study was ranged between 98.61% and 101.51% with a R.S.D. lower than 2%. LOD and LOQ were found to be 0.0428µgml−1 and 0.1298µgml−1, respectively.
Lopez LB et al(2002) [28] have been developed a methodology for the quantification of vitamin A in human milk. Vitamin A levels were assessed in 223 samples corresponding to the 5th, 6th and 7th postpartum months. The samples were saponified with potassium hydroxide/ethanol, extracted with hexane, evaporated to dryness and reconstituted with methanol. A column RP-C18, a mobile phase methanol/water (91:9 v/v) and a fluorescence detector (lambda excitation 330 nm and lambda emission 470 nm) were used for the separation and quantification of vitamin A. The analytical parameters of linearity (r2: 0.9995), detection (0.010 microg/ml) and quantification (0.025 microg/ml) limits, precision of the method (relative standard deviation, RSD = 9.0% within a day and RSD = 8.9% among days) and accuracy (recovery = 83.8%) demonstrate that the developed method allows the quantification of vitamin A in an efficient way.
Prachikabra et al(2000) [29] have developed a simple, sensitive and specific UV spectrophotometric for the estimation of isotretinoin in bulk and soft gelatin capsule for routine analysis. The optimum conditions for analysis were established and validated in conformance with ICH guidelines. It was observed, the absorbance maximum (λmax) for Isotretinoin was 344 nm in methanol and the linearity was in the range of 1-8 μg/ml with coefficient of correlation as 0.9994. The lower limit of detection and the limit of quantification were found to be 0.2519 and 0.7634μg/ml respectively.
Stephen A. Barnett et al(1979) [30] have developed a RP-HPLC method for the simultaneous estimation of Vitamin A acetate Vitamin D2 and Vitamin E acetate in multivitamin mineral tablets. The method requires dissolution of the sample in water-ethanol-pyridine solution (50:46:4), extraction of the vitamin in to warm hexane addition of cholesterol benzolate internally standard and separation with a methanol water gradient solution of coupled µBond pack phenyl-µbond pack column. Detection of the vitamin and internal standard is monitored at 280nm with separation accomplished in approximately in 15mn.
employs a C18 reversed-phase column and methanol as an eluent. The detection of these two compounds is monitored with fluorescence excitation at 348 nm and emission at 470 nm. Detector noise established the lower limit of quantitation at approximately 0.5 ng. Plasma samples were employed to evaluate the accuracy, reproducibility, and applicability of the method. Less than 1 ng of vitamin A in plasma can be quantitated by this procedure.
Zafar Iqbala et al(2001) [32] have developed a novel, simple and fast reversed-phase HPLC/UV method for simultaneous determination of all-trans-retinol and α -Tocopherol in human serum using Retinyl acetate as internal standard in the concentration of 0.5 μg/ml. A liquid-phase extraction was applied to the 250 μl of serum with n-hexane– dichloromethane mixture (70:30, v/v), in two steps, using ethanol–methanol mixture (95:5, v/v) for protein precipitation and BHT (butylated hydroxy toluene) as stabilizer for sample preparation. Both analytes were analyzed on Kromasil 100 C18 column (150 mm × 4.6 mm, 5 μm), protected by a Perkin Elmer C18 (30 mm × 4.6 mm, 10 μm; Norwalk, USA) pre-column guard cartridge, at 292 nm wavelength, using methanol–water (99:1, v/v), in isocratic mode as mobile phase applied at flow rate of 1.5 ml/min and 1 ml/min for both 5 μm and 3 μm columns, respectively. Complete separation of all the analytes was achieved in 3 and 6 min on 3 μm and 5 μm columns.
Lorena Rigogaspar et al(2010) [33] have reported a simple RP-HPLC method to evaluate the influence of two currently available photostabilizers on cosmetic formulations containing combined UV-filters and vitamins A and E. UV-irradiated formulation samples were submitted to a procedure that included a reliable, precise and specific HPLC method employing a C18 column and detection at 325 and 235 nm. Methanol, isopropanol and water were the mobile phases in gradient elution. The method precision was between 0.28 and 5.07.
Benedicte Morina et al(2007)[34] have reported the effect of the fat-soluble vitamin A or vitamin E and grape seed proanthocyanidin extract (GSPE) on oxidative DNA damage estimated by 8-oxo-7, 8-dihydro-2′-deoxyguanosine (8-oxodG) contents in urine and leukocyte of rats. The aim of this study was to establish whether anthocyanidins could act as putative antioxidant micronutrients.
All-trans IUPAC n Synonym Molecula Chemica STRUCT Physical Appearan Odour Solubility Melting p Storage Category
s retinoic ac
name ms ar weight al formula TURE F
l and chemic
nce y point y cid
: (2E,4E, 6
Yl) nona RA.
: vitamin A
Known a
: 300.4412
: C20H28O2
[image:40.612.205.414.321.382.2]
Fig 2: Chem
cal properti
: Yellow to : Characte : It is pract chlorofor ATRA is in 95% e : 180-182 : ATRA is : Common used to tr
DRUG
6E,8E)-3, 7--2, 4,6,8-Tet
A acid; Tret as all-trans r
2 g/mol.
2.
mical structu
ies:
o light orang ristic floral o tically insolu rm, sparingly s soluble at a
thanol fat an °C, crystals s more sensit nly used to tr reat acute pr
G PROFIL
-dimethyl-9-traenoic acid
tinoin is the
retinoic acid
ure of All-tr
ge crystalline odour. uble in wate y soluble in about 40 mg/ nd non-polar from ethano tive to light, reat acne vul romyelocytic
LE
(2, 6, 6-trim d 3, 4, 5-Trih
acid form o
d or ATRA.
rans retinoic
e powder.
r; slightly so ether, and so /ml in DMSO r solvents. ol.
heat, and ai lgaris and ke c leukaemia
methylcyclohe hydroxybenz
f vitamin A It is a drug
c acid
oluble in alco oluble in me O and at abo
ir in solution eratosis pilar
(APL).
exen-1- zoic acid,
and is also ATRA.
ohol and ethanol. out 2.7 mg/m
n.
ris. It is also
ml
PLANT PROFILE-1
Description of plant: BroccoliBotanical information:
Botanical name : Brassica oleracea.
[image:41.612.223.389.189.369.2]Family : Brassicaceae
Fig: 3 Brassica oleracea
Common names : Broccoli, brocks, calabrese, Italian asparagus, Italian broccoli
Vernacular names:
Hindi : Hari phulagobi
Tamil : pachchai pookosu
Parts used : whole plant
Chemical constituents:
Uses:
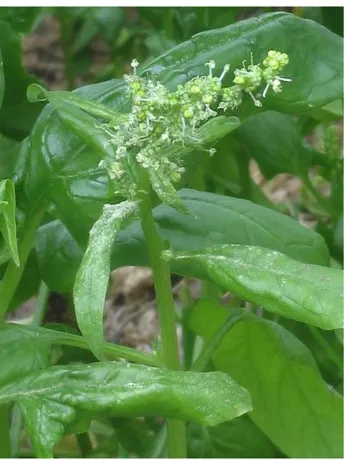
PLANT PROFILE-2
Fig: 4 Spinacia oleracea
Description of plant: Spinach
Botanical information:
Botanical name : Spinacia oleracea.
Family : Amaranthaceae, formerly ChenopodiaceaeMimosaceae
Habitat : Asia, probably Persia
Vernacular names:
Hindi : Palak
Marathi : Palak
Malayalam : cheera, bayala
Sanskrit : Palakya
Tamil : Pasalakeerai
Chemical constituents:
Spinach leaves, containing several active components, including flavonoids, exhibit antioxidative, antiproliferative, and anti-inflammatory properties in biological systems. A powerful, water-soluble, natural antioxidant mixture (NAO), which specifically inhibits the lipoxygenase enzyme, was isolated from spinach leaves. Spinach contains an impressive range of active substances which are indispensable to the body. In its structure we find mineral salts (sodium, potassium, calcium, phosphorus, magnesium, sulfur, iron, zinc, manganese, and iodine, copper), vitamins (C, B1, B2, B6, PP, E, K, folic acid, vitamin A), chlorophyll, amino acids such as arginine and lysine, but also lipids, and fibers. With only 17 calories, 100 grams of spinach supplies the body with 5 mg of iron, 500 mg of potassium, 170 mg of calcium, 23 mg of vitamin C, 2 mg of vitamin E, 150 micrograms of folic acid, 3500 micrograms of beta-carotene and 7 grams of alimentary fibers.
Uses:
The plant is used against throat and lung affections.
AIM AND OBJECTIVE
The use of All-trans retinoic acid in health prospects is growing enormous, a study to investigate the estimation of the All-trans retinoic acid which is widely used as an Anti-oxidant, in Broccoli (Brassica oleracea) and Spinach (Spinacia oleracea) extract has been proposed. There is no validated RP-HPLC method reported for the estimation of All-trans retinoic acid present in the plant Broccoli (Brassica oleracea) and Spinach (Spinacia oleracea).
Hence the present study was aimed to
¾ Develop a new RP- HPLC method for the estimation of All-trans retinoic acid in different extract of these plants.
¾ Validate the developed method as per ICH guidelines.
¾ And to quantify All-trans retinoic acid in extract of these plants and dried leaves of the same.
For the simultaneous estimation of All-trans retinoic acid in extracts HPLC, HPTLC and UV-Spectroscopic methods are considered to be the most suitable. These methods are powerful, extremely precise, accurate, sensitive, specific, linear and rapid in analyzing the sample.
MATERIALS
Plant materials
Broccoli and Spinach was obtained from Hills area of Ooty, Tamil nadu.
Marker compounds
All-trans retinoic acid was purchased from Surien Pharmaceutical Pvt.Ltd Chennai (India). The purity of All Trans retinoic acid was reported to be 99.6% w/w.
Chemicals and Solvents
Acetonitrile HPLC grade – Merck specialties, Mumbai. Ortho phosphoric acid (Analytical grade) – SD fine chemicals, Mumbai. Distilled water – Merck specialties, Mumbai.
Instruments
• HPLC system (Shimadzu, Japan) with LCsolution software.
• Elico pH meter LI 127. • Shimadzu LC-20 AT HPLC.
System : Shimadzu gradient HPLC
Pump : LC – 20AT prominence solvent delivery system
Detector : SPD-M20A Prominence Diode array detector
Injector : Rheodyne 7725i with 20 μl loop
• Shimadzu 1600 LC-UV Spectrophotometer. • Solvent filtration unit – Millipore.
• Shimadzu electronic balance AY 220.
• Ultra Cooling centrifuge – Remi, IndiaPerkin elmer Lambda 25 UV/Vis spectrophotometer with win lab software. • Branson 1510 sonicator.
• Solvent filtration unit – Millipore. • Mettler AT 200 weighing balance. • Prama rotatory evaporator
METHODOLOGY
Selection of wavelengthAccurately weighed (1 mg) of All-trans retinoic acid was transferred in to a separate volumetric flask and dissolved in 10 ml methanol to produce 100 µg/ml of stock solution. A working standard solution containing 10µg/ml was prepared and the UV spectrum was recorded by scanning in the range of 200 nm to 400 nm. The chromatographic conditions used for the initial run is given below,
9 Chromatographic conditions-1
Stationary phase : Phenomenex C18 column
Mobile phase : Solvent A: hexane sulphonic acid pH 3.5
Solvent B: methanol
Solvent ratio : 50:50
Detection : 215 nm
Flow rate : 1.0 ml/min
Sample size : 20 μl
Needle wash : water
Column temperature : room temperature (20ºC)
9 Chromatographic conditions-2
Stationary phase : Phenomenex C18 column
Mobile phase : Solvent A: potassium dihydrogen orthophosphate
20mM pH 3.5, Solvent B: acetonitrile
Solvent ratio : 60:40
Detection : 261 nm
Flow rate : 1.0 ml/min
Sample size : 20 μl
Column temperature : room temperature (20ºC)
9 Chromatographic conditions-3
Stationary phase : Phenomenex C18 Column
Mobile phase : Solvent A: Water
Solvent B: acetonitrile
Solvent ratio : 60:40
Detection : 220 nm
Flow rate : 1.0 ml/min
Sample size : 20 μl
Needle wash : water
Column temperature : room temperature (20ºC)
9 Chromatographic conditions-4
Stationary phase : Phenomenex C18 Column
Mobile phase : Solvent A: ortho phosphoric acid pH-4
Solvent B: acetonitrile: methanol (50:50)
Solvent ratio : 55:45
Detection : 201 nm
Flow rate : 1.0 ml/min
Sample size : 20 μl
Needle wash : water
While developing RP-HPLC method with different mobile phases like acetonitrile: methanol, acetonitrile: buffer (acetate, phosphate buffer), and methanol: buffer was used, but no favourable results obtained. But the mobile phase consisting of ortho phosphoric acid and acetonitrile in the ratio 55:45 gave acceptable peak.
Hence, further modification was made in the mobile phase to get a sharp symmetrical peak with good resolution.
4) OPTIMIZATION OF SEPARATION CONDITIONS
• Effect of ratio of mobile phase
The mobile phase of ortho phosphoric acid and acetonitrile in various ratios, 50:55, 55:45, 60:40, 70:30, were tried and the chromatograms were recorded at 201 nm with a flow rate of 1ml/min. At the ratio of 55:45 of ortho phosphoric acid and acetonitrile was selected as the ideal ratio for the estimation of All-trans retinoic acid.
• Effect of flow rate:
Keeping the ortho phosphoric acid and acetonitrile mobile phase ratio at 55:45 chromatograms were recorded at a flow rate of 1ml/min. At this flow rate, the peaks were sharp with good resolution. So 1ml/min was kept constant for the analysis (flow rate 1.0ml/min 1.1ml/min, up to 1.5ml/min were also tried, but did not give any satisfactory results).
Fixed chromatographic conditions:
Based on the above studies, the following chromatographic conditions were finally optimized for the simultaneous estimation of All-trans retinoic acid in Broccoli (flower head) and
Spinach (leaf) extract.
Stationary phase : Phenomenex C18 column
Mobile phase : Solvent A: ortho phosphoric acid pH4
Solvent B: acetonitrile
Solvent ratio : 55:45
Detection : 201 nm
Sample size : 20 μl
Needle wash : water
Column temperature : room temperature (20ºC)
SELECTION OF EXTRACTION PROCEDURE FOR THE PLANTS:
EXTRACTION PROCEDUREOF BROCCOLI
Method I.
Weighed accurately about 10gm of sample(broccoli) in a beaker, then 30ml of hexane was added and stored in room temperature for two days. Filter the sample solution and take 10 ml of filtrate (hexane layer), to this 30ml of di-chloride methane was added and kept for 2 days in room temperature. finally separated the two layers.
Method II.
To the weighed sample of broccoli (10gm), 20ml of chloroform was added and Stored at room temperature for two days. Filter the sample solution and collected the filtrate.
Method III.
EXTRACTIONPROCEDUREFOR SPINACH:
Method I.
Accurately weighed sample of spinach was shaken with dry ether for 3 hours at room temperature. Collected residue was then extracted with two successive lots of dry acetone. Combine the filtrate of ether and acetone extracts and removed the solvent by evaporation.
Method II.
Weighed sample of spinach was shaken with toluene at room temperature. Then collected residue was extracted with two successive amount of methanol. Combine the extracts after filtration and removed the solvent by evaporation.
Method III.
QUANTIFICATION AND VALIDATION
Preparation of standard stock solutionsAccurately weighed 10 mg of All-trans retinoic acid, transferred into a 10 ml volumetric flask, dissolved in 10ml of methanol, to produce 1 mg/ml stock solution.
Preparation of working standard stock solutions
Calibration curves
Appropriate aliquots from the standard solutions were transferred to a series of 10 ml volumetric flasks, and the volume in each flask was adjusted to the mark with Mobile phase.