COMPARATIVE EVALUATION OF ACCURACY OF
IMPLANT LEVEL IMPRESSIONS OBTAINED WITH
CLOSED TRAY PRESS FIT IMPRESSION COPINGS AND
OPEN TRAY SPLINTED IMPRESSION COPINGS FOR
MULTIPLE IMPLANTS - AN IN VITRO STUDY
Dissertation Submitted to
THE TAMILNADU DR. M.G.R. MEDICAL UNIVERSITY
In partial fulfillment for the Degree of
MASTER OF DENTAL SURGERY
BRANCH I
ACKNOWLEDGEMENT
This dissertation is the result of work with immense support from many
people and it is a pleasure now that I have the opportunity to express my
gratitude to all of them.
I would be failing in my duty if I do not adequately convey my heartfelt
gratitude and my sincere thanks to my Head of the Department, Professor
Dr. N.S. Azhagarasan, M.D.S., Department of Prosthodontics and Crown &
Bridge, Ragas Dental College & Hospital, Chennai, for his exceptional guidance,
tremendous encouragement, well-timed suggestions and heartfelt support
throughout my postgraduate programme which has never failed to drive the best
out of me. I would like to profoundly thank him for giving an ultimate sculpt to
this study. I remember thy help for ages.
I wish to express my gratitude to Dr. S. Ramachandran, M.D.S.,
Principal, Ragas Dental College & Hospital, Chennai, for his encouragement
throughout my postgraduate course. I also thank him for permitting me to make
use of the amenities in the institution.
I would like to solemnly thank Dr. K. Madhusudan, M.D.S., Professor,
for the valuable guidance and encouragement rendered by him. This dissertation
has been the fertile outcome of his massive endurance, support, proficient
guidance and counsel.
I would like to express my real sense of respect, gratitude and thanks to
support, back up and valuable criticism extended to me during the period of my
study. The timely help and encouragement rendered by her had been enormously
helpful throughout the period of my postgraduate study.
I would also like to thank Dr.S.Jayakrishnakumar, M.D.S.,
Dr.Manoj Rajan, M.D.S., Dr. Saket Miglani, M.D.S., Dr. Manikandan, M.D.S.,
Dr. Saravana Kumar, M.D.S., Dr. Hariharan, M.D.S., Dr. Vallabh Mahadevan, M.D.S., Dr.Sabarinathan, M.D.S., Dr.Divya Krishnan, M.D.S., for
their valuable suggestions and help given throughout my study.
I thank Mr. Ravanan for helping me with the statistical analysis for the
study.
I would also like to thank Mr.Dhanansekar, Manager, CIPET, Chennai
for extending his support and expertise in the measurement phase of my study.
It would not be justifiable on my part if I do not acknowledge the help of
my fellow colleagues, my seniors, my juniors and friends for their criticism and
continuous support throughout my postgraduate course.
Last but not the least, even though words wouldn’t do much justice, I
would like to specially thank my father Mr.S.Saravanan, my mother
Mrs.S.Vijaya and my brother Dr.S.Sankara Subbu for their blessings and love.
CONTENTS
S.NO TITLE PAGE NO.
1. INTRODUCTION 1
2. REVIEW OF LITERATURE 8
3. MATERIALS AND METHODS 17
4. RESULTS 32
5. DISCUSSION 55
6. CONCLUSION 64
7. SUMMARY 68
LIST OF TABLES
Table No.
Title Page No
1. Basic values, mean and standard deviation of inter implant distances in x-axis for the reference model (Control-Group R).
35
2. Basic values, mean and standard deviation of inter implant distances in x-axis for Group A samples.
36
3. Basic values, mean and standard deviation of inter implant distances in x-axis for Group B samples.
37
4. Basic values, mean and standard deviation of inter implant distances in y-axis for the reference model (Control-Group R).
38
5. Basic values, mean and standard deviation of inter implant distances in y-axis for Group A samples.
39
6. Basic values, mean and standard deviation of inter implant distances in y-axis for Group B samples.
40
7. Basic values, mean and standard deviation of inter implant distance in z- axis for reference model (Control-Group R).
41
8. Basic values, mean and standard deviation of inter implant distances in z-axis for Group A samples.
42
9. Basic values, mean and standard deviation of inter implant distances in z-axis for Group B samples.
43
10. Basic values, mean and standard deviation of inter implant angulations in z-axis for reference model (Control-Group R).
44
11. Basic values, mean and standard deviation of inter implant angulations in z-axis for Group A samples.
45
12. Basic values, mean and standard deviation of inter implant angulations in z-axis for Group B samples.
46
13. Comparison of mean inter implant distances for Control-Group R, Group A and Group B samples in x-axis.
14. Differences in mean inter implant distances between Control-Group R, Group A and Group B samples in x-axis.
47
15. Comparison of mean inter implant distances for Control-Group R, Group A and in Group B samples in y-axis.
48
16. Differences in mean inter implant distances between Control-Group R, Group A and Group B samples in y-axis.
48
17. Comparison of mean inter implant distances for Control-Group R, Group A and Group B samples in z-axis.
49
18. Differences in mean inter implant distances for Control-Group R, Group A and Group B samples in z-axis.
49
19. Comparison of mean of inter implant angulations for Control-Group R, Group A and Group B samples in z-axis.
50
20. Differences in mean inter implant angulations for Control-Group R, Group A and Group B samples in z-axis.
50
21. Comparative evaluation of mean difference in inter implant distance between reference model (Control-Group R), Group A and Group B in x-axis.
51
22. Comparative evaluation of mean difference in inter implant distance between reference model (Control-Group R), Group A and Group B in y-axis.
52
23. Comparative evaluation of mean difference in inter implant distance between reference model (Control-Group R), Group A and Group B in z-axis.
53
24. Comparative evaluation of difference in inter implant angulations between reference model (Control-Group R), Group A and Group B in z-axis.
LIST OF GRAPHS
Graph No. Title
Graph 1 Basic values of inter implant distances in x-axis for the reference model (Control-Group R).
Graph 2 Basic values of inter implant distances in x-axis for Group A samples.
Graph 3 Basic values of inter implant distances in x-axis for Group B samples.
Graph 4 Basic values of inter implant distances in y-axis for the reference model (Control-Group R).
Graph 5 Basic values of inter implant distances in y-axis for Group A samples.
Graph 6 Basic values of inter implant distances in y-axis of Group B samples.
Graph 7 Basic values of inter implant distance in z- axis for reference model (Control-Group R).
Graph 8 Basic values of inter implant distances in z-axis for Group A samples.
Graph 9 Basic Values of Inter Implant Distances In z-Axis for Group B samples.
Graph 10 Basic values of inter implant angulations in z-axis for reference model (Control-Group R).
Graph 11 Basic values of inter implant angulations in z-axis for Group A samples.
Graph 12 Basic values of inter implant angulations in z-axis for Group B samples.
Graph 14 Differences in mean inter implant distances between Control-Group R, Group A and Group B samples in x-axis.
Graph 15 Comparison of mean inter implant distances for Control-Group R, Group A and Group B samples in y-axis.
Graph 16 Differences in mean inter implant distances between Control-Group R, Group A and Group B samples in y-axis.
Graph 17 Comparison of mean inter implant distances for Control-Group R, Group A and Group B samples in z-axis.
Graph 18 Differences in mean inter implant distances between Control-Group R, Group A and Group B samples in z-axis.
Graph 19 Comparison of mean inter implant angulations for Control-Group R, Group A and Group B samples in z-axis.
ANNEXURE
LIST OF FIGURESFig.No. Title
Fig.1: Modelling wax
Fig.2: Closed tray impression coping Fig.3a: Implant Replica
Fig.3b: Cover screw
Fig.4: Press fit impression copings Fig.5a: Open tray impression copings Fig.5b: Guide pins
Fig.6a: Manual prosthetic torque wrench Fig.6b: Screw driver
Fig.7a: Heat cure acrylic resin - Polymer Fig.7b: Heat cure acrylic resin – Monomer Fig.7c: Heat cure acrylic resin – Cold mould seal Fig.8: Irreversible hydrocolloid
Fig.9: Type IV dental stone Fig.10: Vibrator
Fig.11: Light cure unit Fig.12: Polyether adhesive Fig.13: Light cure resin sheet
Fig.16: Dental surveyor
Fig.17: Pentamix auto mixing unit Fig.18: Pentamix mixing tips Fig.19a: Edentulous model former Fig.19b: Edentulous wax model
Fig.20a: Implant replicas incorporated in wax model Fig.20b: Finished wax model with implant replicas Fig.21: Finished reference model in heat cure acrylic resin Fig.22a: Reference model with tapered impression copings
Fig.22b: Irreversible hydrocolloid impression with repositioned tapered impression copings Fig.23: Primary cast
Fig.24: Wax spacer adapted to primary cast Fig.25: Irreversible hydrocolloid impression Fig.26: Spaced primary cast
Fig.27a: Finished custom trays in light cure resin (Open tray) Fig.27b: Finished custom trays in light cure resin (Closed tray) Fig.28: Press fit copings attached to reference model
Fig.29: Adhesive applied to closed tray Fig.30: Tray loaded with polyether
Fig.31: Impression made with polyether impression material Fig.32: Closed tray impression
Fig.34: Master cast (Group A)
Fig.35a: Brush bead application of pattern resin on index Fig.35b: Splinted open tray copings attached to the reference model
Fig.36: Adhesive applied to open tray
Fig.37: Impression made with polyether impression material Fig.38: Open tray impression
Fig.39: Connecting implant replica to open tray impression copings
Fig.40: Master cast (Group B)
1
INTRODUCTION
The use of dental implants has revolutionized prosthodontics and the fixed treatment options that can be offered to patients. High survival rates and long- term predictability for clinically loaded endosseous implants have been consistently reported resulting in one of the most successful treatment modalities in dentistry.3,10,40,60 Predictable success in implantology can be achieved by paying attention to diagnosis and treatment planning, implant surgical procedures, impression making, passive fit of prosthesis, occlusion and recall maintenance.18,22,23,33,46 Implant failures can be either early failures or late failures. Early failures occur primarily due to inappropriate surgical planning and execution. On the other hand, inappropriate prosthodontic planning, lack of passive fit or occlusal discrepancies leads to late failures occurring due to excessive or inappropriate load transfer to the implants.41
2
discrepancy of the framework has been reported in the range of 10µm to 150µm based on various clinical studies.26,30,50,56 Even though the implant components and bone appear to tolerate a degree of misfit without adverse biomechanical problems, it is appropriate to ensure passive fit of the frame work to the implant. Passive fit of the framework largely depends on accurate impression techniques for the accurate reproduction of the inter implant relationship in the working cast.44 Several other strategies such as CAD/CAM machining, soldering, laser welding have also been suggested to achieve passive fit.13,45,46,57
The accuracy of the impression therefore remains a critical factor in determining a precise fit.57 Various factors such as type of impression technique, different connection level (implant level and abutment level),1,35 different impression trays8,53, implant depth36, time delay for stone pouring and impression material of choice12,17,25 have been shown to influence the accuracy of impression.20,21,33,37 Several impression techniques have been advocated for implant impressions to ensure the passive fit of prosthesis.5,7 The different impression techniques advocated in the literature for implant level impressions include indirect (closed tray) and direct (open tray) techniques.8,19,59
3
to the impression. The advantage of this technique is that the implant replicas are visually fastened to the impression copings and therefore ensuring its complete seating. But on the other hand the reseating of the coping in the impression may not be accurate, which can reflect as an error in the inter implant relationship in a vertical axes. The instances of the impression material being distorted or damaged is also possible while using the closed tray impression technique in multiple implant situations, especially if implants are not parallel to each other.2,14,57
Direct technique (open tray) uses square impression copings that are picked in the impression and the analogs are connected to the copings. The primary advantage is that, the coping remains in the impression and the chances of error during reseating of the impression coping back into the impression is eliminated. The concern of the angulated implants deforming the impression material upon removal of impression does not exist.14,29 The limitation includes blind fastening of the analog that can result in rotation of the impression coping inside the impression and therefore an error in the inter implant relationship in the horizontal axis can occur.2,57
4
impression coping with pattern resin have been advocated to achieve accurate open tray impression by various authors.20,21,28,56
The above mentioned techniques may be uncomfortable for the patient and the clinician while the impression copings are being screwed and unscrewed intra orally. Slight movement of the copings may result in deformation of the impression material while unscrewing the guide pins from the impression copings during tray removal, or screwing/replacing the matching implant replicas in the impression tray.
5
plastic, press fit closed tray impression coping can be adjusted to suit complicated implant positioning for making accurate implant level impressions.48 However scientific literature on the accuracy of impressions obtained with press fit impression copings is lacking.
Several methods of comparing the accuracy of impressions include strain gauge method and measuring method have been described in the literature to evaluate the accuracy of implant impressions.33 Measurement of the distances between the implant replicas in the master model and comparing them with that of the experimental model have been reported in the previous studies.54,55,58 Devices like travelling microscope, digital micrometer, measuring microscope, optical scanner, profile projector have been used for this purpose. It is necessary to study the inter implant distances in x, y and z axis and also the angular measurements in z-axis in order to study the linear and rotational distortion of the impression copings and implant replicas. Coordinate measuring machine (CMM) is an appropriate device to measure the inter implant distances and angulations in the three axes.31 A Coordinate measuring machine is a device which measures the distance of the analogs from a reference point in the three different axes(x, y and z axes). CMM can calculate the amount of rotational distortion as well as calculate linear rotation. It can also measure the inter implant angulation.21
6
impression can result in three dimensional changes in inter implant relationship. Therefore there is a need for evaluation of master casts in all the three axes. There are very few studies which combinedly evaluate the inter implant distances in casts, in x, y and z axes as well as the inter implant angulations.21,46 Scientific evidence regarding the accuracy of master casts obtained from impression made with press fit impression copings and its comparison with other impression techniques are lacking. Therefore, there is a need to analyse and understand the impression technique that would best suit the requirements in a particular clinical situation, to achieve a three dimensionally accurate working cast for fabrication of a passively fitting implant framework.
Hence this in vitro study was aimed to comparatively evaluate the accuracy of implant level impressions obtained with closed tray press fit impression copings and open tray splinted impression copings for multiple implants. Also added to the aim of the study are the following objectives:
1) To evaluate the accuracy of implant level impressions obtained with closed tray press fit impression copings in x axis.
2) To evaluate the accuracy of implant level impressions obtained with closed tray press fit impression copings in y axis.
7
4) To evaluate the accuracy of implant level impressions obtained with open tray splinted impression copings in x axis.
5) To evaluate the accuracy of implant level impressions obtained with open tray splinted impression copings in y axis.
6) To evaluate the accuracy of implant level impressions obtained with open tray splinted impression copings in z axis.
7) To compare the accuracy of implant level impressions obtained using closed tray press fit impression technique and open tray splinted impression technique in x-axis.
8) To compare the accuracy of implant level impressions obtained using closed tray press fit impression technique and open tray splinted impression technique in y-axis.
8
REVIEW OF LITERATURE
Eames WB et al (1979)17 evaluated the effect of an impression material on the accuracy of the impression. The trays were divided into three groups based on the spacer thickness. Group 1 had 2mm thick spacer, group 2 had 4mm thick spacer while group 3 had 6mm thick spacer. The results showed that the most accurate impressions were obtained using a 2mm spaced tray for all the materials tested.
Valderhaug J et al (1984)53 evaluated the dimensional stability of
elastomeric impression materials in stock and custom trays. The elastomeric impression materials used were impregum, xantopren light body and medium body. The results showed that all the measurements except one compiled with the requirements for dimensional stability of rubber impression materials
9
Barrett MG et al (1993)5 performed this study to determine the accuracy of six different impression techniques. The techniques involved were tapered copings with i) alginate ii) polyvinyl siloxane; square copings with i) plaster ii) polyether iii) polyvinylsiloxane iv) splinting of copings with autopolymerizing resin and dental floss before making polyvinyl siloxane impression. Statistical analysis showed no significant difference between the different materials.
Hsu C et al (1993)26performed this study to compare the influence of four implant transfer techniques and two master cast methods on the accuracy of abutment position. Groups were i) nonsplinted copings ii)copings secured with dental floss and Duralay resin iii) copings secured with orthodontic wire and Duralay resin, iv)copings secured by prefabricated resin block with .The master cast methods were i)solid cast and ii) Zeiser system. Impressions were made with polyether (Impregum f) material. The results showed that i) the Duralay resin used for splinting is insignificant ii) there is no significant difference between splinted and unsplinted implant copings and iii) with the zeiser system, it was possible to get reduced inter abutment error.
10
Assif D et al (1994)2 described a modified impression technique for implant –supported restoration. The technique involves making a preliminary impression with irreversible hydrocolloid to get a stone model. In this model, an autopolymerising resin custom tray is fabricated with sufficient space for the impression material. Impression is made and after it sets, the excess is cut flush with the tray. The copings are then splinted externally with the tray using autopolymerising resin the incremental manner.
Jemt T et al (1996)31 evaluated four systems for measuring fit at the implant prosthesis interface. The four systems were a) University of
Washington, b) Mylab system c) Photogrammeteric measurement system d) University of Michigan system. Results showed that all four methods are
comparable to each other in detecting misfit. The Mylab system was found to be the most repeatable system. Photogrammetery was the only system to evaluate the misfit intraorally.
11
Burawi C et al (1997)7 conducted this study to compare the accuracy of a splinted with an unsplinted impression technique. results showed that the plastic impression caps used in the unsplinted impression technique were superior to the resin splinted technique for the transfer of the position of the intraoral bone-lock implants to a laboratory master cast.
Wee AG et al (2000)57 compared the amount of torque to rotate a square impression coping in an impression and evaluated the accuracy of solid implant casts fabricated from different impression materials. Polyether, addition silicone and polysulfide were made using each material. The results showed that the highest torque values were obtained for polyether which was contributed to the rigidity of the material. Polyether and addition silicone gave more accurate casts than polysulfides.
Herbst D et al (2000)24 assessed the dimensional accuracy of casts obtained from four impression techniques i)tapered impression copings not splinted together ii) square impression copings splinted together iii) square impression copings splinted with autopolymerising acrylic resin iv)square copings with lateral extension on one side, not splinted. Results showed that the dimensional accuracy of was exceptional for all the impression techniques. The author attributed this to the property of the addition silicone in achieving accurate impressions.
12
copings were used. The results showed that modified impression copings had a significantly lesser amount of rotational movement than unmodified impression technique.
Vigolo P et al (2003)55 in their in vitro study evaluated the accuracy of three impression techniques using polyether impression material. Fifteen impressions were made in each group, in group 1 non modified impression copings were used. In group 2, impression copings were connected using Duralay resin. In group 3, impression copings were air abraded and coated with adhesive. Results showed that i)none of the casts of group 1 allowed for the seating of metal template and ii) the master casts obtained by splinting the copings and air borne particle abrasion were accurate.
Burns J et al (2003)8 performed an in vitro study to study whether custom trays produce more consistently accurate implant fixture level impressions than stock trays, by use of an open tray technique. The results showed that rigid custom trays (close fit and spaced) produced significantly more accurate impressions than flexible stock polycarbonate trays.
13
Windhorn RJ et al (2006)59 described an open tray technique for impression implants. In this technique, a custom acrylic resin tray was fabricated with an opening in the area where the implants were located. Impression posts were screwed on to the implants. A section of boxing wax was adapted over the openings in the tray and sealed to the tray. Light body addition silicone was injected around the impression posts wile medium or heavy body VPS material was filled in the tray. In the area of wax alone, Blu mousse Classic was added in the tray and the impression made.
Lee H et al (2008)37 investigated the accuracy of published implant impression techniques and examined the clinical factors affecting implant impression accuracy. The results of his investigation showed that greater accuracy was in splinted technique than with the non splint technique and in studies with 4 or more implants, open tray technique showed more accuracy than closed tray technique.
14
Lee YJ et al (2009)38 compared the accuracy of four implant level
impression techniques for angulated implants. Four groups were included: a) octagonal transfer impression coping b) non octagonal transfer impression
coping c) non-octagonal pick up impression coping d) non-octagonal pick up impression coping splinted with acrylic resin. Results showed that casts produced from non octagonal impression techniques were more accurate then those produced by other impression techniques.
Nissan J et al (2009)43 described the use of press fit, closed tray impression copings as a mechanism suitable for an implant level cast. At first the copings were connected to the implant by pressing on instead of screwing and fit was verified radiographically and impression taken. After impression sets the impression is removed from mouth with the press fit copings and the replicas wee connected.
15 Del’ Acqua MA et al (2010)16
compared the dimensional accuracy of a stone index and of two impression techniques. Three groups of impressions were tested namely: index (I), squared (S), modified squared (MS). The accuracy was evaluated using stereomicroscope. The results showed that the index and modified squared generated more accurate casts than the squared technique.
Mostafa TNM et al (2010)42 evaluated the precision of three transfer techniques using two impression materials. This study compared the accuracy between direct technique splinted and unsplinted and indirect technique with two impression materials namely polyether and polyvinylsiloxane. A travelling microscope was used to make six measurements for each cast. Results showed that there was no statistical significance difference between the impression materials regarding the accuracy.
Hariharan R et al (2010)21 evaluated the accuracy of casts obtained from non-splinted and splinted impression techniques employing various splinting materials for multiple implants. Impressions were divided into four groups: a) non-splinted technique b) acrylic resin splinted technique c) bite registration addition silicone d) bite registration polyether splinted technique and accuracy was measured using CMM. Results showed that polyether bite registration silicone showed more accuracy.
16
also its effect on marginal discrepancy. The accuracy was measured using CMM. The results showed that implant level accurately transferred the angulated position of implants and the impression method did not affect the level of marginal discrepancy.
Kwon JH et al (2011)35evaluated and compared the three dimensional accuracy of master casts obtained with and without impression copings. Groups involved were I) impressions using open tray copings II) impressions obtained without using impression copings. The accuracy was measured using CMM. Results showed that casts obtained using open tray impression copings was more accurate than casts obtained without using impression copings.
17
MATERIALS AND METHODS
This in vitro study was aimed to comparatively evaluate the accuracy of implant level impressions obtained with closed tray press fit impression copings and open tray splinted impression copings for multiple implants.
Materials:
The following materials were used in the study.
1. Mandibular edentulous model former (Ashoosons, Delhi, India) (Fig.19)
2. Modelling wax (Cavex , Holland BV , The Netherlands) (Fig.1)
3. Impression coping closed tray (NoblRpl RP, REF 35406, Nobel Biocare AB , Sweden) (Fig.2)
4. Implant replica and cover screw (NobRpl RP, REF 29500, Nobel Biocare AB, Sweden) (Fig.3a & 3b)
5. Press fit impression coping, plastic (NoblRpl RP, REF 35406, Nobel Biocare AB , Sweden) (Fig.4)
6. Impression coping open tray (NoblRpl RP, REF 33539 , Nobel Biocare AB , Sweden) (Fig.5a & 5b)
7. Manual prosthetic torque wrench (REF 29165 , Nobel Biocare AB, Sweden) (Fig.6a)
18
9. Heat cured acrylic resin (DPI heat cure India) (Fig.7a & 7b) 10. Separating media (DPI heat cure cold mould seal , India) (Fig.7c) 11. Irreversible hydrocolloid (Algimat ,India) (Fig.8)
12. Type IV dental stone ( Ultrarock, Kalabhai, India) (Fig.9)
13. Polyether tray adhesive (3m ESPE AG, Seefeld, Germany) (Fig.12) 14. Light cure resin sheets (Plaque Photo, W+P Dental, Hamburg,
Germany) (Fig.13)
15. Polyether impression material (Impregnum penta, 3M AG, Seefeld, Germany) (Fig.14)
16. Pattern resin (GC pattern resin, Osaka, Japan) (Fig.15)
Equipments:
The following equipments were used in the study:
1. Pentamix 2, (3M AG, Seefeld, Germany) (Fig.17) 2. Light cure unit (Delta, India) (Fig.11)
3. Coordinate measuring machine (CMM) (Spectra, Accurate, Pune, India) (Fig. 37).
4. Dental surveyor (Paraflex, Bego, Germany) (Fig.16). 5. Vibrator(Fig.10) (Delta, India)
Description of Pentamix automatic mixing unit (Fig.17):
19
viscosity polyether impression material. The Pentamix automatic Mixing Unit essentially consists of three components namely : Drive unit with motors,
clutch and gears, Dispensing unit consisting of chain, cross-member, double
plunger and piston discs and Superstructure with frame, side sections made of
die-cast aluminum and polycarbonate housing. The clutch is a particularly
important component. It is responsible for transmitting the enormously high
torque levels, while at the same time acting as an overload safety device.
It must disengage the drive unit reliably from the dispensing unit when
the material in the foil bag has been used up. The clutch also provides defined,
delayed disengaging each time dispensing finishes in order to prevent the
pastes from dripping.
Description of Coordinate Measuring Machine (CMM) (Fig.41):
20
Coordinate measuring machine (CMM) is also a device used in manufacturing and assembly processes to test a part or assembly against the design intent. By precisely recording the X, Y, and Z coordinates of the target, points are generated which can then be analysed via regression algorithms for the construction of features. These points are collected by using a probe that is positioned manually by an operator or automatically via Direct Computer Control (DCC).
METHODOLOGY:
The methodology of this study has been divided into the following stages:
I. Reference model fabrication
II. Evaluation of reference model using Coordinate measuring machine III. Custom tray fabrication
a. Preparation of primary cast b. Preparation of spaced primary cast c. Fabrication of custom tray IV. Implant impressions
V. Preparation of master casts
21
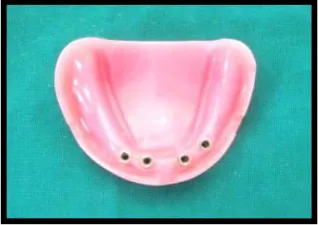
I. REFERENCE MODEL FABRICATION(Control-Group R): (Fig. 19,
20 & 21)
22
II. EVALUATION OF REFERENCE MODEL(Control-Group R)
USING COORDINATE MEASURING MACHINE: (Fig.42)
The reference model was evaluated using a Coordinate measuring machine (CMM, Accurate Spectra, Pune, India) (Fig 41), which is capable of measuring in x, y and z axes with an accuracy of ±5µm. The CMM was connected to a data processor (Accusoft) which gave the measured values. In order to measure the three dimensional accuracy of the reference model, the inter implant distances in x, y and z axes were measured and the angle between the implant replicas around the z-axis were evaluated. The implant replicas were numbered 1 to 4 starting from the left posterior replica to the right posterior replica.
The probe used in the CMM was first calibrated. The reference model was measured to obtain the reference values. The model was screwed in the base for measuring. In order to obtain similar orientation of the reference model and all the master casts, the centre of replicas 1 and 4 were aligned in the CMM and then the measurements were made (Fig.42).
23 Measuring distance in x axis (Fig.44):
The coordinates of the centre of replica 1 was measured and zeroed. Keeping this position as a reference, the positions of the centre of replica 1 and 2(D1x), 1 and 3(D2x), and 1 and 4(D3x) were measured in the x plane (Fig.44).
Measuring distance in y axis (Fig.45):
The coordinates of the centre of replica 1 was measured and zeroed. Keeping this position as a reference, the positions of the centre of replica 1 and 2(D1y), 1 and 3(D2y), and 1 and 4(D3y) were measured in the y plane (Fig.45)
Measuring distance in z axis (Fig.46):
Then the probe was used to measure the plane formed by the platform of replica 1. The distance between the planes formed by the replica platforms were measured. The distance between the plane formed by the replica platform number 1 and 2(D1z), 1 and 3(D2z) and 1 and 4(D3z) were measured to get the inter implant distance in the z axis (Fig.46).
Measuring angulations in z axis (Fig.47):
24
coping were measured. The angle formed between the implant replicas 1 and 2 (Angle1), 1 and 3 (Angle 2) and 1 and 4 (Angle 3) were measured by calculating the angle formed by the flat surfaces of the respective impression copings (Fig.47). Each measurement on the reference model in all the three axes were measured 5 times and the mean measurements were obtained. All the measurements were made by a single operator to avoid inter operator error.
III. FABRICATION OF CUSTOM TRAYS (Fig 22-27):
III a. Preparation of primary cast (Fig.22 & 23)
Four tapered impression copings (NobRpl RP, REF 33540, Nobel Biocare AB, Sweden) (Fig.2) were screwed onto the implant replicas of the reference model (Fig.22a) at a torque of 15Ncm using a manual torque wrench (REF 29165, Nobel Biocare AB, Sweden) (Fig.6a). An irreversible hydrocolloid (Neocolloid, Zhermack, Italy) (Fig.8) impression was made and the tapered impression posts- the implant replica complex repositioned in the impression (Fig.22b). Stone cast was obtained using type IV dental stone (Kalabhai, India) (Fig.9). This cast was used as the primary cast (Fig.23).
III b. Preparation of spaced primary cast (Fig.24-26):
25
spaced primary cast(Fig.26). All the custom trays to be used in this study were fabricated using this spaced primary cast for both open and closed tray techniques.
III c. Custom tray fabrication (Fig.27a & 27b):
26
inside the light curing unit for 6 minutes. The tray was removed from the cast and kept inside the curing unit for another 6 minutes. In this manner, 10 custom trays were made for open tray impressions (Fig.27a) and 10 custom trays were made for closed tray impressions (Fig.27b). All the trays were left undisturbed for 24 hours, for the trays to become dimensionally stable prior to impression making.
IV. IMPLANT IMPRESSIONS
The custom trays obtained in the above mentioned manner were employed for impression making. Impression techniques were divided into two groups namely:
GROUP A - Implant level impression technique with closed tray press fit impression copings.
GROUP B – Implant level impression technique with open tray splinted impression copings.
The procedure adopted for making impressions for Group A and Group B is detailed subsequently:
GROUP A – Implant level impression technique with closed tray press fit impression copings (Fig.28-32):
27
was ensured by visual inspection of the model. The custom trays was coated with a uniform layer of polyether adhesive (3M ESPE, Germany) (Fig.12) and allowed to dry for fifteen minutes as per the manufacturer’s recommendation
(Fig.29). Medium body polyether was machine mixed (3M ESPE Pentamix 2, Germany) (Fig.17) and loaded into the custom tray keeping the tip immersed in the material all the time (Fig.30). It was also syringed around the impression copings by another operator. The tray was then positioned over onto the reference model immediately and the impression was made (Fig.31).
While positioning, care was taken to ensure that the tray seated completely in the three stops that were made in the reference model to ensure complete seating and proper positioning of the custom tray. The excess material along the borders of the tray was removed. The impression was allowed to set undisturbed for six minutes as per the manufacturer’s
recommendation. A total of 10 such impressions were made. After ensuring the complete set of the impression material, the tray with the impression was retrieved from the reference model (Fig.32).
GROUP- B – Implant level Impression Technique With Open Tray Impression Copings. (Fig.35-38)
28
as a scaffold for the resin splinting material and to prevent the flow of the resin towards the implant. The index was sectioned into a labial and lingual half so as to facilitate its removal after polymerisation of the splint material. The index was repositioned on the reference model. Pattern resin (GC pattern resin, Osaka, Japan) (Fig.15) was added around the impression copings by brush bead method to splint the copings together (Fig.35a). The splint was allowed to polymerise undisturbed for 4 minutes. The splint was then sectioned in-between the impression posts using a thin separating disc to relive the stresses caused due to polymerisation shrinkage. The cut sections were then rejoined using the same pattern resin by applying it using the “brush bead” method. This was again allowed to polymerise for 4 minutes. The putty
index was later removed. The reference model-impression copings assembly was now ready for impression making (Fig.35b).
The custom tray and the resin splint were coated with a uniform layer of polyether adhesive (3M ESPE, Germany) (Fig.12) and allowed to dry for fifteen minutes as per the manufacturer’s recommendation (Fig.36). Medium
29
It was made sure that the tray seated completely in the three stops that were made in the reference model to ensure complete seating and proper positioning of the custom tray. The excess material that had flown over the top of the posts through the window in the custom tray was removed to expose the screws. The impression was allowed to set undisturbed for 6 minutes as per the manufacturer’s recommendation. After ensuring the complete set of
impression material, the tray with impression was retrieved from the reference model. The screws of the impression posts were unscrewed and the impression removed from the reference model (Fig.38). A total of ten impressions were made in this group in the similar manner.
V. Preparation of master casts: (Fig.33, 34, 39 and 40)
The impressions made were allowed to polymerise completely and the casts were poured after half an hour as per manufacturer’s recommendation.
For the copings picked in the closed tray press fit impression the implant replicas were attached by pressing it on to the closed tray copings (Fig.33). Implant replicas were screwed onto the impression posts that were picked in the open tray impressions (Fig.39). Casts were poured using type IV dental stone (Ultrarock, Kalabhai, India) (Fig.9). The stone was hand mixed with water as per the manufacturer’s recommended ratio of 100 gram to 20ml and
30
the impressions (Fig.34 & 40). For all the open tray impressions, the impression copings were unscrewed before retrieval of the cast. All casts were labelled 1 to 10 according to the group. A total of 20 master casts were thus obtained (10 casts for Group A and 10 casts for Group B).
VI. Evaluation of master casts: (Fig.43-47)
The casts obtained from the different impressions were grouped according to the respective techniques and numbered from 1 to 10 in each group. All 20 casts of Group A and Group B were evaluated using a Coordinate measuring machine (CMM, Accurate Spectra, Pune, India) (Fig.43) in a similar manner as it was done for the reference model. The measurements were made in all the three axes namely x, y and z (Fig.44-47).
VII. RESULTS AND STATISTICAL ANALYSIS:
The mean values of all the measurements for each group were obtained and they were statistically analysed using one way ANOVA and Student Newmann Keuls tests at a significance of 0.5 using SPSS 11.5 software, tabulated and inferences drawn.
31
METHODOLOGY OVERVIEW
REFERENCE MODEL FABRICATION (Control–Group R)
Measuring inter implant relations in x, y and z axes using CMM for reference model
(Control-Group R)
Custom trays fabrication 10-closed trays; 10-open trays
Closed tray impressions with press fit impression copings
(Group A)
Open tray impressions with splinted open tray impression
copings (Group B)
Master casts fabrication Master casts fabrication
Measuring inter implant relations in x, y and z axes using CMM for Groups A and B master casts
METHODOLOGY
[image:44.595.314.473.182.301.2]REFERENCE MODEL FABRICATION
Fig.19a: Edendulous model former Fig.19b: Edentulous wax model
[image:44.595.108.269.184.299.2]
Fig.20a : Implant replicas Fig.20b: Finished wax
incorporated in wax model model with replicas
[image:44.595.314.483.378.494.2] [image:44.595.221.381.570.682.2]32
RESULTS
The present in vitro study was conducted to comparatively evaluate the accuracy of implant level impression obtained with closed tray press fit impression copings and open tray splinted impression copings for multiple implants.
The following results were obtained from the study which compared the inter implant distances in x, y and z axis and the angular relationships between the implants in z axis. These four parameters were compared between
the reference model (Control-Group R) and test groups (Group A and Group B).
Mean and standard deviation (S.D) of all the values for each group were obtained and they were statistically analyzed by using one way ANOVA and Student-Newman-Keuls test.
Table 1-3 shows the basic values, mean and standard deviation of inter implant distances in x-axis for the reference model (Control-Group R) and the test groups (Group A and Group B).
33
Table 7-9 shows the basic values, mean and standard deviation of inter implant distances in z-axis for the reference model (Control-Group R) and the test groups (Group A and Group B).
Table 10-12 shows the basic values, mean and standard deviation of inter implant angulations in z-axis for the reference model (Control-Group R) and the test groups (Group A and Group B).
Table 13 shows the comparison of mean inter implant distances for Control-Group R, Group A and Group B samples in x axis.
Table 14 shows the differences in mean inter implant distances between Control-Group R, Group A and Group B samples in x-axis.
Table 15 shows the comparison of mean inter implant distances for Control-Group R, Group A and Group B samples in y axis.
Table 16 shows the differences in mean inter implant distances between Control-Group R, Group A and Group B samples in y-axis.
Table 17 shows the comparisons of mean inter implant distances for Control-Group R, Group A and Group B samples in z axis.
Table 18 shows the differences in mean inter implant distances between Control-Group R, Group A and Group B samples in z-axis.
34
Table 20 shows the differences in mean inter implant angulations between Control-Group R, Group A and Group B in z-axis.
Table 21 shows the comparative evaluation of mean differences in inter implant distances between reference model (Control-Group R), Group A and Group B samples in x-axis.
Table 22 shows the comparative evaluation of mean differences in inter implant distances between reference model (Control-Group R), Group A and Group B samples in y-axis.
Table 23 shows the comparative evaluation of mean differences in inter implant distances between reference model (Control-Group R), Group A and Group B samples in z-axis.
35
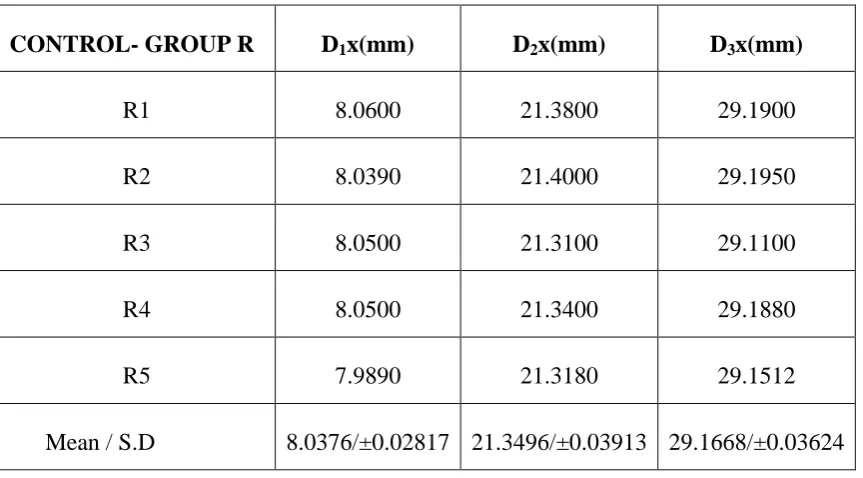
Table 1: Basic values, mean and standard deviation of inter implant distances in x-axis for the reference model (Control-Group R)
D1x – distance between replica 1 and replica 2 in x-axis
D2x – distance between replica 1 and replica 3 in x-axis
D3x – distance between replica 1 and replica 4 in x-axis
INFERENCE:
For the reference model the mean inter implant distance in x-axis, between replica 1 and replica 2 (D1x) is 8.0376mm, between replica 1 and replica 3 (D2x) is 21.3496mm and between replica 1 and replica 4 (D3x) is
29.1668mm.
CONTROL- GROUP R D1x(mm) D2x(mm) D3x(mm)
R1 8.0600 21.3800 29.1900
R2 8.0390 21.4000 29.1950
R3 8.0500 21.3100 29.1100
R4 8.0500 21.3400 29.1880
R5 7.9890 21.3180 29.1512
36
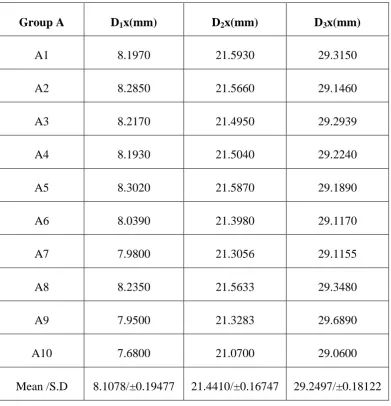
Table 2: Basic values, mean and standard deviation of inter implant distances in x-axis for Group A samples
INFERENCE:
For the Group A samples the mean inter implant distance in x-axis, between replica 1 and replica 2 (D1x) is 8.1078mm, between replica 1 and replica 3 (D2x) is 21.4410mm and between replica 1 and replica 4 (D3x) is 29.2497mm.
Group A D1x(mm) D2x(mm) D3x(mm)
A1 8.1970 21.5930 29.3150
A2 8.2850 21.5660 29.1460
A3 8.2170 21.4950 29.2939
A4 8.1930 21.5040 29.2240
A5 8.3020 21.5870 29.1890
A6 8.0390 21.3980 29.1170
A7 7.9800 21.3056 29.1155
A8 8.2350 21.5633 29.3480
A9 7.9500 21.3283 29.6890
A10 7.6800 21.0700 29.0600
37
Table 3: Basic values, mean and standard deviation of inter implant distances in x-axis for Group B samples
INFERENCE:
For Group B samples the mean inter implant distance in x-axis between replica 1 and replica 2 (D1x) is 8.0028mm, between replica 1 and replica 3 (D2x) is 21.2902mm and between replica 1 and replica 4 (D3x) is 29.1420mm.
Group B D1x(mm) D2x(mm) D3x(mm)
B1 7.9610 21.2470 29.1360
B2 7.8510 21.1980 29.0194
B3 8.4610 21.3680 29.1960
B4 8.1020 21.4350 29.2390
B5 7.8943 21.2200 29.1140
B6 8.0220 21.3400 29.1930
B7 7.8800 21.2430 29.1130
B8 7.8301 21.1690 29.0530
B9 8.0671 21.3780 29.2170
B10 7.9600 21.3044 29.1400
38
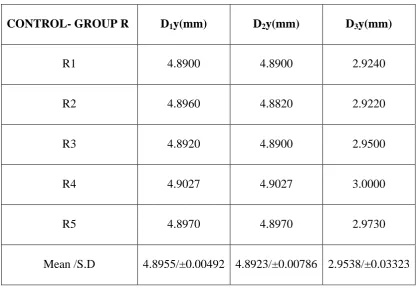
Table 4: Basic values, mean and standard deviation of inter implant distances in y-axis for the reference model (Control-Group R)
D1y – distance between replica 1 and replica 2 in y-axis
D2y – distance between replica 1 and replica 3 in y-axis
D3y – distance between replica 1 and replica 4 in y-axis
INFERENCE:
For reference model the mean inter implant distance in y-axis, between
replica 1 and replica 2 (D1y) is 4.8955mm, between replica 1 and replica 3 (D2y) is 4.8923mm and between replica 1 and replica 4 (D3y) is 2.9538mm.
CONTROL- GROUP R D1y(mm) D2y(mm) D3y(mm)
R1 4.8900 4.8900 2.9240
R2 4.8960 4.8820 2.9220
R3 4.8920 4.8900 2.9500
R4 4.9027 4.9027 3.0000
R5 4.8970 4.8970 2.9730
39
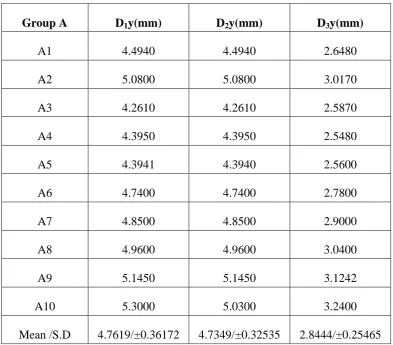
Table 5: Basic values, mean and standard deviation of inter implant distances in y-axis for Group A samples
INFERENCE:
For Group A samples the mean inter implant distance in y-axis between replica 1 and replica 2 (D1y) is 4.7619mm, between replica 1 and replica 3 (D2y) is 4.7349mm and between replica 1 and replica 4 (D3y) is 2.8444mm.
Group A D1y(mm) D2y(mm) D3y(mm)
A1 4.4940 4.4940 2.6480
A2 5.0800 5.0800 3.0170
A3 4.2610 4.2610 2.5870
A4 4.3950 4.3950 2.5480
A5 4.3941 4.3940 2.5600
A6 4.7400 4.7400 2.7800
A7 4.8500 4.8500 2.9000
A8 4.9600 4.9600 3.0400
A9 5.1450 5.1450 3.1242
A10 5.3000 5.0300 3.2400
40
Table 6: Basic values, mean and standard deviation of inter implant distances in y-axis for Group B samples
INFERENCE: For Group B samples the mean inter implant distance in y-axis between replica 1 and replica 2 (D1y) is 5.0200mm, between replica 1
and replica 3 (D2y) is 4.9722mm and between replica 1 and replica 4 (D3y) is 3.1016mm.
Group B D1y(mm) D2y(mm) D3y(mm)
B1 4.8850 4.8850 2.9880
B2 5.0200 5.2670 3.3000
B3 5.3500 5.3300 3.2200
B4 5.1700 4.8900 3.1700
B5 4.8650 4.7600 2.9700
B6 4.9800 4.8800 3.0840
B7 4.8900 4.9800 3.0800
B8 4.9200 4.8600 2.9600
B9 5.0800 4.9800 3.0680
B10 5.0400 4.8900 3.1760
41
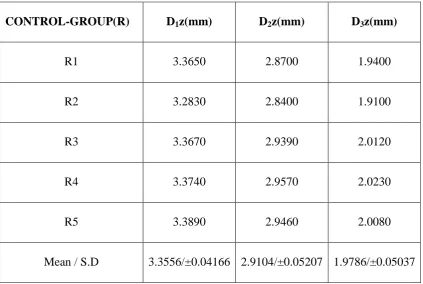
Table 7: Basic values, mean and standard deviation of inter implant distance in z-axis for reference model (Control-Group R)
D1z – distance between replica 1 and replica 2 in z-axis
D2z – distance between replica 1 and replica 3 in z-axis
D3z – distance between replica 1 and replica 4 in z-axis
INFERENCE:
For reference model the mean inter implant distance in z-axis between replica 1 and replica 2 (D1z) is 3.3556mm, between replica 1 and replica 3 (D2z) is 2.9104mm and between replica 1 and replica 4 (D3z) is 1.9786mm.
CONTROL-GROUP(R) D1z(mm) D2z(mm) D3z(mm)
R1 3.3650 2.8700 1.9400
R2 3.2830 2.8400 1.9100
R3 3.3670 2.9390 2.0120
R4 3.3740 2.9570 2.0230
R5 3.3890 2.9460 2.0080
42
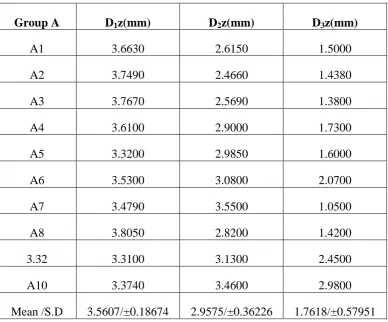
Table 8: Basic values, mean and standard deviation of inter implant distances in z-axis for Group A samples
Group A D1z(mm) D2z(mm) D3z(mm)
A1 3.6630 2.6150 1.5000
A2 3.7490 2.4660 1.4380
A3 3.7670 2.5690 1.3800
A4 3.6100 2.9000 1.7300
A5 3.3200 2.9850 1.6000
A6 3.5300 3.0800 2.0700
A7 3.4790 3.5500 1.0500
A8 3.8050 2.8200 1.4200
3.32 3.3100 3.1300 2.4500
A10 3.3740 3.4600 2.9800
Mean /S.D 3.5607/±0.18674 2.9575/±0.36226 1.7618/±0.57951
INFERENCE:
43
Table 9: Basic values, mean and standard deviation of inter implant distances in z-axis for Group B samples
INFERENCE:
For Group B samples, the mean inter implant distance in z-axis between replica 1 and replica 2 (D1z) is 3.5766 mm, between replica 1 and replica 3 (D2z) is 2.8109mm and between replica 1 and replica 4 (D3z) is 1.7915mm.
Group B D1z(mm) D2z(mm) D3z(mm)
B1 3.3950 3.1500 2.3050
B2 3.260 3.5400 2.1642
B3 3.4100 3.1900 1.8900
B4 3.9100 2.7100 1.7900
B5 3.6330 2.4170 1.6260
B6 3.4400 2.3400 1.6700
B7 3.2900 3.0600 1.4500
B8 4.0680 2.5500 1.6800
B9 3.9000 2.8220 1.6900
B10 3.4600 2.3300 1.6500
44
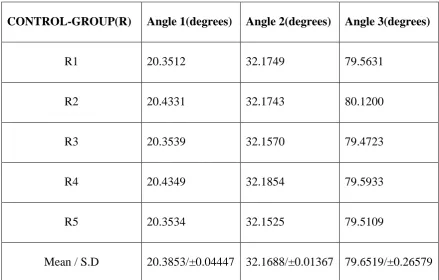
Table 10: Basic values, mean and standard deviation of inter implant angulations in z-axis for reference model (Control-Group R)
Angle 1 – angulation between replica 1 and replica 2 in z-axis
Angle 2 – angulation between replica 1 and replica 3 in z-axis
Angle 3 – angulation between replica 1 and replica 4 in z-axis
INFERENCE:
For reference model the mean inter implant angulation in z-axis between replica 1 and replica 2 (Angle 1) is 20.3853º, between replica 1 and replica 3 (Angle 2) is 32.1688º and between replica 1 and replica 4 (Angle 3) is 79.6519º.
CONTROL-GROUP(R) Angle 1(degrees) Angle 2(degrees) Angle 3(degrees)
R1 20.3512 32.1749 79.5631
R2 20.4331 32.1743 80.1200
R3 20.3539 32.1570 79.4723
R4 20.4349 32.1854 79.5933
R5 20.3534 32.1525 79.5109
45
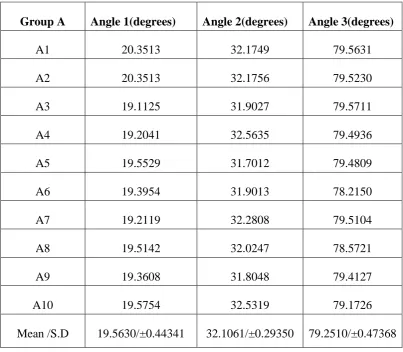
Table 11: Basic values, mean and standard deviation of inter implant angulations in z-axis for Group A samples
INFERENCE:
For Group A samples, the mean inter implant angulations in z-axis between replica 1 and replica 2 (Angle 1) is 19.5630º, between replica 1 and replica 3 (Angle 2) is 32.1061º and between replica 1 and replica 4 (Angle 3) is 79.2510º.
Group A Angle 1(degrees) Angle 2(degrees) Angle 3(degrees)
A1 20.3513 32.1749 79.5631
A2 20.3513 32.1756 79.5230
A3 19.1125 31.9027 79.5711
A4 19.2041 32.5635 79.4936
A5 19.5529 31.7012 79.4809
A6 19.3954 31.9013 78.2150
A7 19.2119 32.2808 79.5104
A8 19.5142 32.0247 78.5721
A9 19.3608 31.8048 79.4127
A10 19.5754 32.5319 79.1726
46
Table 12: Basic values, mean and standard deviation of inter implant angulations in z-axis for Group B samples
Group B Angle1(degrees) Angle 2(degrees) Angle 3(degrees)
B1 20.3105 32.1550 80.3939
B2 21.5634 31.2408 79.1013
B3 19.0224 31.3606 80.0151
B4 20.0708 30.1527 79.5556
B5 21.5951 32.2914 80.8058
B6 19.2540 31.2910 80.2021
B7 20.3712 32.0712 80.3657
B8 19.2050 30.0744 79.2657
B9 19.5831 31.1313 78.7647
B10 20.0156 31.1817 79.0849
Mean /S.D 20.0991/±0.90969 31.2950/±0.75840 79.7555/±0.69034
INFERENCE:
47
Table 13: Comparison of mean inter implant distances for Control-Group R, Group A and Group B samples in x-axis
Note: * denotes significance at 5% level
INFERENCE:
On comparison of the mean inter implant distances in x-axis, D1x and D3x were statistically not significant while statistically significant differences were obtained in the D2x values between Control-Group R, Group A and Group B means.
Table 14: Differences in mean inter implant distances between Control- Group R, Group A and Group B samples in x-axis
Group D1x(mm) D2x(mm) D3x(mm)
Mean Mean Mean
R 8.0376 21.3496 29.1668
A 8.1078 21.4410 29.2497
B 8.0028 21.2902 29.1420
P value 0.402 0.037* 0.166
Group Δ D1x(mm) ΔD2x(mm) ΔD3x(mm)
A- R 0.0702 0.0914 0.0829
B-R -0.0348 -0.0594 -0.0248
48
Table 15: Comparison of mean inter implant distances for Control-Group R, Group A and Group B samples in y-axis
Note: * denotes significance at 5% level
INFERENCE: On comparison of the mean inter implant distances in y-axis, D1y and D2y were statistically not significant while statistically
significant differences were obtained in the D3x values between Control-Group R, Group A and Group B means.
Table 16: Differences in mean inter implant distances between Control- Group R, Group A and Group B samples in y-axis
Group D1y(mm) D2y(mm) D3y(mm)
Mean Mean Mean
R 4.8955 4.8923 2.9538
A 4.7619 4.7349 2.8444
B 5.0200 4.9722 3.1016
P value 0.093 0.103 0.014*
Group Δ D1y(mm) ΔD2y(mm) ΔD3y(mm)
A-R -0.1336 -0.1574 -0.1094
B-R 0.1245 0.0799 0.1478
49
Table 17: Comparison of mean of inter implant distances for Control -Group R, -Group A and -Group B samples in z-axis
INFERENCE: On comparison of the mean inter implant distances in z-axis (D1z, D2z and D3z) between the reference and the test groups, results were found to be statistically insignificant.
Table 18: Differences in mean inter implant distances for Control-Group
R, Group A and Group B samples in z-axis
Group Δ D1z(mm) ΔD2z(mm) ΔD3z(mm)
A-R 0.2051 0.0471 -0.2168
B-R 0.2210 -0.0995 -0.1871
A-B -0.0159 0.1466 -0.0297
Group D1z(mm) D2z(mm) D3z(mm)
Mean Mean Mean
R 3.3556 2.9104 1.9786
A 3.5607 2.9575 1.7618
B 3.5766 2.8109 1.7915
50
Table 19: Comparison of mean inter implant angulations for Control- Group R, Group A and Group B samples in z-axis
Note: *denotes significance at 5% level
INFERENCE: On comparison of the mean inter implant angulations in z-axis, Angle 1 and Angle 3 were statistically not significant while statistically significant differences were obtained in the Angle 2 values between Control- Group R, Group A and Group B means.
Table 20: Differences in mean inter implant angulations for
Control-Group R, Control-Group A and Control-Group B samples in z-axis
Group Angle 1 (degrees) Angle 2 (degrees) Angle 3(degrees)
Mean Mean Mean
R 20.3853 32.1688 79.6519
A 19.5630 32.1061 79.2510
B 20.0991 31.2950 79.7555
P value 0.061 0.003* 0.127
Group Δ Angle 1(degrees) Δ Angle 2(degrees) Δ Angle 3 (degrees)
A-R -0.8223 -0.0627 -0.4005
B-R -0.2862 -0.8738 0.1036
51
Table 21: Comparative evaluation of mean difference in inter implant distance between reference model (Control-Group R) and Group A and
Group B in x-axis
*Denotes significance at 5% level
INFERENCE:
Significant difference was found in D2x on comparison between Group A and Group B with p value of 0.030(P value < 0.05).
Inter implant distance
Groups Mean
difference
P value
D1x Group A Control-Group R 0.0702 0.740 Group B Control-Group R -0.0348 0.928
Group A Group B -0.1050 0.377
D2x Group A Control-Group R 0.0914 0.375 Group B Control-Group R -0.0594 0.654
Group A Group B -0.1508 0.030*
D3x Group A Control-Group R 0.0829 0.462 Group B Control-Group R -0.0248 0.931
52
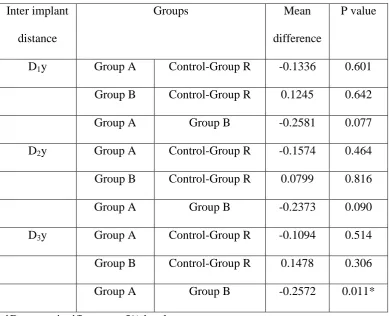
Table 22: Comparative evaluation of mean difference in inter implant distance between reference model (Control-Group R), Group A and
Group B in y-axis
*Denotes significance at 5% level
INFERENCE:
On comparing the mean differences between reference and test group, significant difference was found in D3y between Group A and Group B with P value of 0.011 (P value < 0.05).
Inter implant
distance
Groups Mean
difference
P value
D1y Group A Control-Group R -0.1336 0.601 Group B Control-Group R 0.1245 0.642
Group A Group B -0.2581 0.077
D2y Group A Control-Group R -0.1574 0.464
Group B Control-Group R 0.0799 0.816
Group A Group B -0.2373 0.090
D3y Group A Control-Group R -0.1094 0.514 Group B Control-Group R 0.1478 0.306
53
Table 23: Comparative evaluation of mean difference in inter implant distance between reference model (Control-Group R) and Group A and
Group B in z-axis
INFERENCE:
On comparing the mean difference between reference model and test groups no significant differences were found.
Inter implant distance
Groups Mean
difference
P value
D1z Group A Control-Group R 0.2051 0.224 Group B Control-Group R 0.2210 0.180
Group A Group B -0.0159 0.986
D2z Group A Control-Group R 0.0471 0.968 Group B Control-Group R -0.0995 0.865
Group A Group B 0.1466 0.627
D3z Group A Control-Group R -0.2168 0.602 Group B Control-Group R -0.1871 0.683
54
Table 24: Comparative evaluation of mean difference in inter implant angulations between reference model (Control-Group R) and Group A
and Group B in z-axis
*Denotes significance at 5% level
INFERENCE:
On comparing the mean differences between reference model and test groups, significant difference was found in Angle 2 between reference and Group B with P value of 0.015 and also between Group A and Group B with P value of 0.006(P value < 0.05).
Inter implant angulations
Groups Mean
difference
P value
Angle1 Group A Control-Group R -0.8223 0.074 Group B Control-Group R -0.2862 0.703
Group A Group B -0.5361 0.177
Angle 2 Group A Control-Group R -0.0627 0.947 Group B Control-Group R -0.8738 0.015*
Group A Group B 0.8111 0.006*
Angle 3 Group A Control-Group R -0.4005 0.391 Group B Control-Group R 0.1036 0.937
55
DISCUSSION
Dental implant therapy has been widely used for the restoration of partially and fully edentulous patients. It is essential for long term successful implant prostheses to achieve a passive fit between the fixture and superstructure. A passive fit is defined as a very precise surface contact for the metal and it distributes functional load uniformly.33 The passive fit between the implant and the framework of the prosthesis is critical for successful long term osseointegration.6,23
An understanding of the biomechanics of implant prosthodontics is critically important, since the use of a rigid framework will distribute forces directly to the transmucosal abutment connection, implant, and ultimately to the bone.46 Ill-fitting implant frameworks may cause mechanical failures of the prosthesis and/ or implants, or biologic complications of the surrounding tissue.34,49 Mechanical complications may include loosening of the prosthetic and abutment screws or fracture of areas components in the system. Biologic complications may include adverse tissue reactions, pain, tenderness, marginal bone loss, and loss of integration.9,34
56
material accuracy and the implant master cast technique.38,57 Success in oral rehabilitation is dependent, in part, on the accurate registration of those structures that constitute the basis for prosthesis support. The impression which allows replication must be accurate and reproducible so that the resultant master cast precisely duplicates the clinical condition.
Implant level impression requires uses of implant copings. Copings can either be open tray impression copings or closed tray impression copings. The primary advantage of the open tray coping is that, the coping remains in the impression and the chances of error during reseating of the impression coping back into the impression is eliminated as the coping gets picked up in the impression. The concern of the angulated implants deforming the impression material upon removal of impression does not exist. But during fastening of the analog to the impression coping there are chances of rotation of coping inside the impression thereby causing a rotational distortion.2,14,29,57