S H O R T R E P O R T
Open Access
The impact of temporal variability of biochemical
markers PAPP-A and free
b
-hCG on the specificity
of the first-trimester Down syndrome screening:
a Croatian retrospective study
Dubravka Ti
š
lari
ć
-Medenjak
1*, Ivana Zec
1, Ana-Maria
Š
imundi
ć
2, Senka Sabolovi
ć
-Rudman
3, Milan Kos
4,
Ž
eljka Bukovec Megla
1Abstract
Background:The variability of maternal serum biochemical markers for Down syndrome, freeb-hCG and PAPP-A
can have a different impact on false-positive rates between the 10+0 and 13+6 week of gestation. The study population comprised 2883 unaffected, singleton, spontaneously conceived pregnancies in Croatian women, who delivered apparently healthy child at term. Women were separated in 4 groups, dependently on the gestational week when the analyses of biochemical markers were performed. The concentrations of freeb-hCG and PAPP-A in maternal serum were determined by solid-phase, enzyme-labeled chemiluminiscent immunometric assay (Siemens Immulite). Concentrations were converted to MoMs, according to centre-specific weighted regression median curves for both markers in unaffected pregnancies. The individual risks for trisomies 21, 18 and 13 were computed by Prisca 4.0 software.
Findings:There were no significant differences between the sub-groups, regarding maternal age, maternal weight and the proportion of smokers. The difference in log10MoM freeb-hCG values, between the 11thand 12th gestational week, was significant (p = 0.002). The difference in log10MoM PAPP-A values between the 11
th and 12th, and between 12thand 13th week of gestation was significant (p = 0.006 and p = 0.003, respectively). False-positive rates of biochemical risk for trisomies were 16.1% before the 11th week, 12.8% in week 12th, 11.9% in week 13thand 9.9% after week 13th. The differences were not statistically significant.
Conclusions:Biochemical markers (log10MoMs) showed gestation related variations in the first-trimester unaffected pregnancies, although the variations could not be attributed either to the inaccuracy of analytical procedures or to the inappropriately settled curves of median values for the first-trimester biochemical markers.
Findings
The first-trimester screening for trisomies 21, 18 and 13, combining maternal age, fetal nuchal translu-cency thickness (NT), maternal serum free b-human chorionic gonadotropin (free b-hCG) and pregnancy associated plasma protein-A (PAPP-A) has revealed a highly potential possibility of an early detection of fetal aneuploidies [1-5].
Various co-variables influence the specificity and sen-sitivity of the first-trimester biochemical markers have been studied [6]. Corrections of the calculated gesta-tional MoM values (Multiples of the Median) have been proposed for maternal weight, cigarette consumption, ethnicity and twin-pregnancy [7-10]. Fetal gender, maternal insulin-dependent diabetes mellitus, parity/ gravidity and procedures in assisted reproduction show certain, but insignificant influence on the screening performance [11-15].
Several studies have focused on the optimal timing for analysis of biochemical markers, predominantly concerning their sensitivity for fetal trisomies [16,17].
* Correspondence: [email protected]
1Laboratory of Endocrinology, Clinics of Oncology and Nuclear Medicine,
University Hospital“Sestre milosrdnice”, Zagreb, Croatia
The optimal sensitivity of PAPP-A is between 9-12 weeks’gestation, being significantly reduced towards the 13th week [18]. Clinical sensitivity of free b-hCG becomes evident from the 10th week, ongoing towards the second trimester of pregnancy [19].
To our knowledge, there has been a lack of publica-tions, which presume the precision of the applied analy-tical methods to the physiological variations of maternal serum markers across the first trimester. This retrospec-tive study in Croatian women with unaffected pregnan-cies has the aim to: (a) assess the specificity of free
b-hCG and PAPP-A across the first-trimester in terms of the false-positive rate (FPR) for trisomy 21 in particu-lar weeks and (b), to examine the analytical accuracy of the methods applied for the measurement of biochem-ical markers.
Methods
In Croatia, combined screening for fetal trisomies has been performed from February 2006. Our Laboratory has been the only centre, which has conducted the ana-lyses for biochemical markers according to the recom-mendations of the Fetal Medicine Foundation (www. fetalmedicine.com). Also, we have been included in external proficiency testing program (UK NEQAS First Trimester Down Syndrome Screening) since August 2006.
Out of total 3118 pregnant women who underwent the combined screening for chromosomal abnormalities till May 2008, a cohort of 2883 subjects was retrospec-tively recruited from the entire population. The selec-tion criteria included non-diabetic, Caucasian women, with singleton, spontaneously conceived pregnancy, who delivered apparently healthy child at term. Pregnancies with abnormal fetal karyotype and those spontaneously aborted were excluded, on the basis of the data supple-mented from health-care providers and delivery records in maternity units, respectively.
All pregnant women had an ultrasound examination between weeks 10+0 and 13+6, which included the crown-rump (CRL) measurement for pregnancy dating and the correspondent NT value, respectively. The obstetrician filled the form with all the clinical data rele-vant for the pregnancy and the mother. The Hospital Ethics Committee approved the accessibility of the first-trimester screening to all pregnant women (E.C. No.19-1/2006). Each woman signed informed consent for the combined screening.
The concentrations of maternal serum freeb-hCG and PAPP-A were determined by solid-phase, enzyme-labelled chemiluminiscent immunometric assay (Siemens Medical Solution Diagnostics). Assays were performed on automated platform Immulite 1000. Med-ian levels of free b-hCG and PAPP-A in unaffected
pregnancies were calculated from weighted regression of observed medians for each gestational day. For that pur-pose, pregnancies achieved by the methods of assisted conception, twins, diabetic pregnant women and preg-nancies with confirmed fetal aneuploidies were excluded from the database. The data fitted the exponential equa-tion well; observed medians were close to those pre-dicted from the model. Regressed medians were used to generate multiples of the median (MoM) for each case. MoM values of markers were corrected for maternal weight and smoking cigarettes and individual risks for trisomies 21, 18 and 13 for each of the pregnant women were calculated using the Prisca 4.0 software (Typolog, Germany).
To assess the accuracy of the analytical procedures, specimens of Siemens control modules LPCCM and LFBCM were run in a day-routine (three-level control containing freeb-hCG in the lyophilized serum prepara-tion and two-level control for PAPP-A in non-human serum matrix, respectively). To examine the within-run precision, 15 replicates of each control were analyzed sequentially. To evaluate the between-day precision, an aliquot of the same lot of control specimen was run along with daily routine measurements. In addition, an aliquot of pooled pregnant women sera was run with daily batch of unknown samples.
The impact of variability of biochemical marker MoM values on the risk for trisomy 21 was assessed using the appropriate 15 paired concentrations of freeb-hCG and PAPP-A in controls and in human pooled sera as well, in combination with a fixed clinical pattern (CRL, NT, maternal age and maternal weight) and the relevant risks were computed.
Statistical analyses were performed using MedCalc
®
software and descriptive statistics using Excel 7.0, respectively. The normality of distributions of log10MoMs of biochemical markers was ascertained using Kolgomorov-Smirnov test. Proportions of smokers and FPR in particular weeks were determined by c2 test. The differences in maternal age and maternal weight, between particular weeks, were assessed by one-way ANOVA. The level of p < 0.05 was considered statisti-cally significant.
Results
Table 1 Within-run and between-day precision of measurement of freeb-hCG and PAPP-A, using Siemens Control Modules and human pooled sera on automated platform Immulite 1000
Freeb-hCG (ng/ml) PAPP-A (mIU/ml)
Sample Control Module LFBCM Human serum Control Module LPCCM Human serum
Control 1 Control 2 Control 3 Control 1 Control 2
Target 5.1 23.8 74.2 0.40 1.96
2SD Range (4.2-6.4) (19.8-27.8) (63.6-90.8) (0.32-0.48) (1.70-2.22)
Within-run
Mean 4.84 24.1 72.8 66.6 0.41 1.94 2.58
SD 0.15 1.12 3.50 2.40 0.01 0.06 0.17
CV* (%) 3.09 4.65 4.81 3.60 2.44 3.09 6.59
Between-run
Mean 4.75 22.66 71.66 61.7 0.38 1.94 2.39
SD 0.31 1.70 5.25 4.13 0.02 0.11 0.21
CV* (%) 6.52 7.50 7.32 6.69 5.26 5.67 8.79
CV* - coefficient of variation
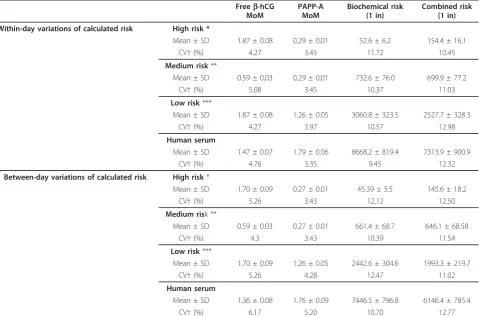
Table 2 Impact of within-day and between day variations on assessment of biochemical and combined risk for Down syndrome
Freeb-hCG MoM
PAPP-A MoM
Biochemical risk (1 in)
Combined risk (1 in)
Within-day variations of calculated risk High risk *
Mean ± SD 1.87 ± 0.08 0,29 ± 0,01 52.6 ± 6.2 154.4 ± 16.1
CV†(%) 4.27 3.45 11.72 10.45
Medium risk**
Mean ± SD 0.59 ± 0,03 0,29 ± 0,01 732.6 ± 76.0 699.9 ± 77.2
CV†(%) 5.08 3.45 10.37 11.03
Low risk***
Mean ± SD 1.87 ± 0.08 1.26 ± 0.05 3060.8 ± 323.5 2527.7 ± 328.3
CV†(%) 4.27 3.97 10.57 12.98
Human serum
Mean ± SD 1.47 ± 0.07 1.79 ± 0.06 8668.2 ± 819.4 7313.9 ± 900.9
CV†(%) 4.76 3.35 9.45 12.32
Between-day variations of calculated risk High risk*
Mean ± SD 1.70 ± 0.09 0.27 ± 0.01 45.39 ± 5.5 145.6 ± 18.2
CV†(%) 5.26 3.43 12.12 12.50
Medium risk **
Mean ± SD 0.59 ± 0.03 0.27 ± 0.01 661.4 ± 68.7 646.1 ± 68.58
CV†(%) 4.3 3.43 10.39 11.54
Low risk***
Mean ± SD 1.70 ± 0.09 1.26 ± 0.05 2442.6 ± 304.6 1993.3 ± 219.7
CV†(%) 5.26 4.28 12.47 11.02
Human serum
Mean ± SD 1.36 ± 0.08 1.76 ± 0.09 7446.5 ± 796.8 6146.4 ± 785.4
CV†(%) 6.17 5.20 10.70 12.77
[image:3.595.59.539.345.662.2]combined risk between 11.02-12.77%, depending on the particular risk level.
To investigate a possible gestation-dependent biological variability of biochemical markers, the pregnant women were classified in 4 groups, according to gestational age at blood sampling. There were no significant differences between the sub-groups, regarding maternal age, mater-nal weight and the proportion of smokers (table 3).
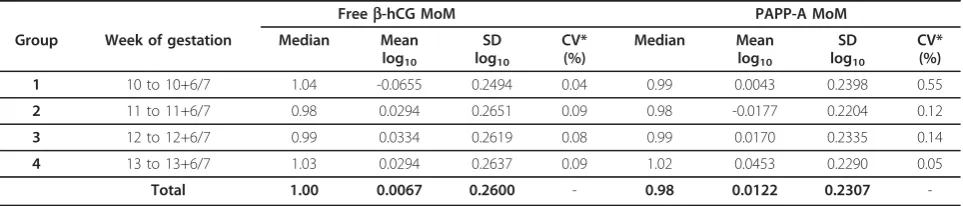
The distribution of maternal serum free b-hCG and PAPP-A MoM values, according to gestational age, are presented in table 4. Median MoMs of both markers were close to 1.0 in all of four weeks of gestation. For the both analytes and in all of the weeks, log10 MoM
values fitted the Gaussian distribution, with overall stan-dard deviation for freeb-hCG of 0.2600, and 0.2307 for PAPP-A, respectively.
Table 5 presents the results of assessment of variability for log10 MoM values of free b-hCG and PAPP-A between particular weeks. Using ANOVA, we showed sta-tistically significant difference in log10MoM values of free
b-hCG between the 11th and 12th gestational week (p = 0.002). In addition, significant differences were scer-tained for log10MoM PAPP-A between the 11thand 12th,
as well as between 12th and 13th week of gestation (p = 0.006 and p = 0.003, respectively). Post-hoc Student-Newman-Keuls test was used to assess the significance of the difference between subgroups.
In table 6, we compared the FPR of biochemical risk for trisomies in particular weeks of first-trimester gesta-tion, considering the cut-off values 1:300 for trisomy 21 and 1:100 for trisomies 18 and 13, respectively. The proportion of pregnant women, classified at increased biochemical risk, was 16.1% in the group before the 11th week, 12.8% between weeks 11 and 11+6, 11.9% between weeks 12 and 12+6, and 9.9% between weeks 13 and 13+6, respectively. The differences in proportions were not statistically significant, neither for the risks concern-ing trisomy 21 nor for trisomies 18/13.
Discussion
[image:4.595.56.540.436.535.2]Introducing the first-trimester screening for fetal trisomies in Croatian pregnant women has been the opportunity for the improvement of prenatal care in our country [20,21]. Previous studies have reported considerable variations in analytical procedures and precision of analyte measure-ment from different laboratories providing biochemical analyses [22]. That refers not only to the accuracy of mea-sured concentrations of freeb-hCG and PAPP-A, but also to converting them to the appropriate MoM values, and as the consequence, estimating the computed risks for fetal aneuploidies. In our country we have quite uniform popu-lation of women, concerning their demographic, social and ethnic background [20]. In that way, we have the opportunity to create the stable population median values
Table 3 Distribution of pregnancies through gestation according to demographic characteristics
[image:4.595.58.540.599.702.2]Group Week of gestation Number Maternal age (years)* Mean ± SD
Maternal weight (kg) ** Mean ± SD
Smokers *** N (%)
1 10 to 10+6/7 96 31.7 ± 4.5 66.9 ± 12.8 10 (10.4%)
2 11 to 11+6/7 853 31.5 ± 4.6 66.4 ± 11.2 91 (10.7%)
3 12 to 12+6/7 1326 31.4 ± 4.4 65.4 ± 10.6 153 (11.5%)
4 13 to 13+6/7 608 31.4 ± 4.4 65.6 ± 10.4 61 (10.0%)
Total 2883 31.5 ± 4.5 66.1 ± 11.3 315 (10.9%)
* p = 0.834 (one-way analysis of variance) ** p = 0.124 (one-way analysis of variance) *** p = 0.779 (c2
=1.093)
Table 4 Distribution of maternal serum freeb-hCG and PAPP-A MoM values, according to gestational age
Freeb-hCG MoM PAPP-A MoM
Group Week of gestation Median Mean log10
SD log10
CV* (%)
Median Mean log10
SD log10
CV* (%)
1 10 to 10+6/7 1.04 -0.0655 0.2494 0.04 0.99 0.0043 0.2398 0.55
2 11 to 11+6/7 0.98 0.0294 0.2651 0.09 0.98 -0.0177 0.2204 0.12
3 12 to 12+6/7 0.99 0.0334 0.2619 0.08 0.99 0.0170 0.2335 0.14
4 13 to 13+6/7 1.03 0.0294 0.2637 0.09 1.02 0.0453 0.2290 0.05
Total 1.00 0.0067 0.2600 - 0.98 0.0122 0.2307
-Gaussian distribution was confirmed by Kolgomorov-Smirnov test for normality MoM - Multiples of the Median
that produce correct MoMs and derive the results of the biochemistry from a single Laboratory. The MoM values for both analytes were close to 1.00 in each of the weeks, suggesting that the applied medians have been appropri-ate. We also have proved that the distribution of log10
MoM values of both markers fits a Gaussian curve, with SDs comparable with the results of much greater series in the literature [1-5]. Our results undoubtedly demonstrated the precision of the measurement of biochemical markers. Coefficients of intra- and inter-assay variations for both markers were exactly as proposed by the manufacturer. Concerning the fact that all analytical procedures were performed on automatic Immulite 1000 system, the data suggest more accurate and precise measurement perfor-mance than Spencer demonstrated when he had evaluated Immulite 2000 versus Kryptor platform [23]. He estab-lished a significant positive bias for PAPP-A (20.65%) against the ALTM of UK NEQAS for first-trimester screening. As of our experience, we disagree with this statement, since our Laboratory participates with the Immulite technology in the same program. The proceed-ings of NEQAS have demonstrated that our BIAS in PAPP-A concentrations, against ALTM, has been -1.8% (VAR 4.8%), while BIAS for MoM values have been -12.6% (VAR 9.4%). On the other side, BIAS for free
b-hCG has been -1.7% (VAR -4.1%) and for MoM values +1.4% (VAR +4.1%), respectively. Most probably, some considerable analytical improvements may have occurred for freeb-hCG and PAPP-A immunoassays on Immulite platforms since the year 2005, when Spencer published his study. Nonetheless, we can confirm that we have succeeded in keeping the high technical standards for biochemical marker analyses [24]. In line with Spencer’s
recommendations, the assessment of calculated risk varia-bility is an obligatory and useful tool in quality control [25]. We have shown that within-day and between-run CVs of calculated risks were, in rough, between 10-13%. This is to some extent higher than 8%, which is the opti-mal CV for target risk, but we need to continue with this monitoring for a longer period to have the more represen-tative experience. On the other hand, proper risk classifi-cation of pregnant women can be influenced not only by biochemical markers, but even more, by the imprecise measurement of ultrasonic markers, which is outside the scope of this study.
From the point of clinical interest, the most important is the discriminatory power of both biochemical markers across the first-trimester. The impact of variability of freeb-hCG and PAPP-A on their clinical sensitivity was clearly demonstrated in studies of Spencer and his co-workers [26,27].
To examine biological variations in normal pregnan-cies, we studied the variability of marker concentrations and their MoM values across the first trimester. The uniformity of sub-groups in particular weeks was proved by means of ANOVA and c2 test. The compliance of log10MoM values with normal distributions, and
[image:5.595.58.538.101.190.2]insig-nificant changes of SDs of both markers in particular weeks did not show any significant oscillations of the values of free b-hCG and PAPP-A. When we compared log-transformed MoM values between weeks by ANOVA, statistically significant differences were found for free b-hCG MoM values between the first two weeks. On the other side, significant differences for PAPP-A MoM values were established between sub-groups in later weeks of the first trimester.
Table 5 Variability of log10MoM values of freeb-hCG and PAPP-A between particular weeks
Freeb-hCG PAPP-A
Between-weeks’difference Sample size
F-ratio Significance level
F-ratio Significance level
Group 1 vs. Group 2 (10+0 to 11+6) 949 9.221 p = 0.002* 0.191 p = 0.294
Group 2 vs. Group 3 (11+0 to 12+6) 2179 0.0372 p = 0.847 7.445 p = 0.006*
Group 3 vs. Group 4 (12+0 to 13+6) 1934 0.947 p = 0.331 8.942 p = 0.003*
All 2883 3.516 p = 0.015* 8.696 p < 0.001*
* Statistically significant (one-way analysis of variance)
Table 6 Comparison of the false positive rates (FPR) in calculated biochemical risk in particular weeks
Group Week of gestation Risk for trisomy 21 (Cut-off≤1:300)
N/Total (%)
Risk for trisomy 18 (Cut-off≤1:100)
N/Total (%)
Between-weeks’difference *
1 10 to 10+6/7 15/96 (16.1%) 2/96 (2.2%) /
2 11 to 11+6/7 109/853 (12.8%) 17/853 (2.0%) Group 1 vs. Group 2c2=0.402, p = 0.52 3 12 to 12+6/7 158/1326 (11.9%) 15/1326 (1.1%) Group 2 vs. Group 3c2=0.313, p = 0.58 4 13 to 13+6/7 60/608 (9.9%) 10/608 (1.6%) Group 3 vs. Group 4c2=0.813, p = 0.37
[image:5.595.55.540.230.315.2]Spencer and co-workers determined the optimal time for PAPP-A measurement between 8-10 weeks’gestation, while its detection efficiency gradually decreased from 10 to 13 weeks’gestation. On the other side, the discrimina-tory power of free b-hCG was the best after the 12th week [26]. Our study hasn’t been designed to prove the best evidence, of neither of biochemical markers, in iden-tifying the affected pregnancies. Small number of Down syndrome cases in study population would not allow the meaningful statistical analysis. The aim of this investiga-tion was to discern a period in the first-trimester when the biochemical markers are most specific and if FPR, due to biochemistry, differ between the particular weeks. In our pregnant women, the proportion of those at“high biochemical risk”decreased from the week 10+0 to week 13+6, although the differences were not statistically sig-nificant. This study was unfortunately underpowered to detect such difference as significant. Over 1,000 pregnant women per week are needed to detect the observed dif-ference as significant, with the power of 0.8.
We think that it is important to get better insight in possible physiological variations of the first-trimester bio-chemical markers in particular weeks and to study the degree of the oscillations of mean marker values between the constant ranges of respective standard deviations. Although the number of our pregnant women was not large enough to form representative sub-groups, we have clearly shown that the observed variations are not caused by inaccuracy of analytical procedures or by a bias pro-duced by inappropriate median values of biochemical markers across the gestational range. Considering the prevailing standards for analytical laboratories, this is of value for correct interpretation of the results of biochem-ical markers, particularly concerning their specificity.
Conclusions
We have shown the gestation related variations of log10
MoM values for biochemical markers, across the first-trimester weeks in unaffected pregnancies. According to our results, it seems unlikely that the observed varia-tions could be attributed either to inaccuracy of analyti-cal procedures or to inappropriately settled curves of median values for the first-trimester biochemical mar-kers. Improvement of the screening strategy implies, on one side, following the guidelines of the Fetal Medicine Foundation and, on the other, a better setting of the timing for the biochemical parameters, for it can contri-bute to a higher specificity of the screening.
Acknowledgment
We are grateful for the contribution of all medical healthcare providers who helped us in gathering the data of pregnancy courses, diagnostic procedures, outcomes, as well as birth characteristics of neonates.
Author details
1Laboratory of Endocrinology, Clinics of Oncology and Nuclear Medicine,
University Hospital“Sestre milosrdnice”, Zagreb, Croatia.2University Department of Chemistry, University Hospital“Sestre milosrdnice”, Zagreb, Croatia.3Clinics of Gynecology and Obstetrics, University Hospital“Sestre
milosrdnice”, Zagreb, Croatia.4Out-patient Clinics of Gynecology“VILI”,
Zagreb, Croatia.
Authors’contributions
DTM has been the main co-ordinator of screening and conceived the study. IZ carried out analytical procedures and performed all statistical analyses. AMS participated in design of study and revised the manuscript. SSR and MK performed most of ultrasound examinations. ZBM helped in acquisition of data. All authors read and approved the final version of manuscript.
Competing interests
The authors declare that they have no competing interests. Patients’data relevant for this study were retrospectively extracted from the routine praxis and no other financial funds were employed.
Received: 12 February 2010 Accepted: 14 July 2010 Published: 14 July 2010
References
1. Spencer K, Spencer CE, Power M, Moakes A, Nicolaides KH:One stop clinic for assessment of fetal risk for fetal anomalies: a report of the first year of prospective screening for chromosomal anomalies in the first trimester.Br J Obstet Gynaecol1999,107:1271-1275.
2. Crossley JA, Aitken DA, Cameron AD, McBride E, Connor JM:Combined ultrasound and biochemical screening for Down syndrome: a Scotish multicentre stydy.Br J Obstet Gynaecol2002,109:667-676.
3. Schuchter K, Hafner E, Stangl G, Metzenbauer M, Hofinger D, Philipp K:The first-trimester‘combined-test’for the detection of Down syndrome pregnancies in 4939 uselected pregnancies.Prenat Diagn2002,
22:211-215.
4. Muller F, Benatar C, Audibert F, Roussel N, Dreux S, Cuckle H:First-trimester screening for Down syndrome in France combining fetal nuchal translucency measurement and biochemical markers.Prenat Diagn2003,
23:833-836.
5. Wøjdemann KR, Larsen SO, Rode L, Shalmi A, Sunberg K, Christiansen M, Tabor A:First trimester Down syndrome screening: Distribution of markers and comparison of assays for quantification of pregnancy-associated plasma protein-A.Scand J Clin Lab Invest2006,66:101-112. 6. De Graaf IM, Cuckle SH, Pajkrt E, Leschot NJ, Bleker OP, van Lith JMM:
Covariables in first trimester serum screening.Prenat Diagn2000,
20:186-189.
7. Spencer K, Bindra R, Nicolaides KH:Maternal weight correction of maternal serum PAPP-A and freeb-hCG when screening for trisomy 21 in the first trimester of pregnancy.Prenat Diagn2003,23:851-855. 8. Spencer K, Bindra R, Cacho AM, Nicolaides KH:The impact of correcting
for smoking status when screening for chromosomal anomalies using maternal serum biochemistry and fetal nuchal translucency thickness in the first trimester of pregnancy.Prenat Diagn2004,24:169-173. 9. Spencer K, Heath V, El-Sheikhah A, Ong CYT, Nicolaides KH:Ethnicity and
the need for correction of biochemical and ultrasound markers of chromosomal anomalies in the first trimester: A study on Oriental, Asian and Afro-Caribbean populations.Prenat Diagn2005,25:365-369. 10. Wald NJ, Rish S, Hackshaw AK:Combining nuchal translucency and serum
markers in prenatal screening for Down syndrome in twin pregnancies.
Prenat Diagn2003,23:588-592.
11. Spencer K, Ong CYT, Liao AWJ, Papademetriou D, Nicolaides KH:The influence of fetal sex in screening for trisomy 21 by fetal nuchal translucency, maternal serum freeb-hCG and PAPP-A at 10-14 weeks of gestation.Prenat Diagn2000,20:673-675.
12. Spencer K, Cicero S, Atzei A, Otigbah C, Nicolaides KH:The influence of maternal insulin-dependent diabetes mellitus on fetal translucency thickness and first-trimester maternal serum biochemical markers of aneuploidy.Prenat Diagn2005,25:927-929.
14. Liao AW, Heath W, Kametas N, Spencer K, Nicolaides KH:First-trimester screening for trisomy 21 in singleton pregnancies achieved by assisted reproduction.Hum Reprod2001,16(7):1501-1504.
15. Tul N, Novak-AntoličŽ:Serum PAPP-A levels at 10-14 weeks of gestation are altered in women after assisted conception.Prenat Diagn2006,
26:1206-1211.
16. Berry E, Aitken DA, Crossley YA, Macri JN, Connor JM:Screening for Down syndrome:changes in marker levels and detection rates between first and second trimesters.Br J Obstet Gynaecol1997,104:811-817. 17. Wenstrom KD:First trimester Down syndrome screening: Component
analytes and timing for optimal performance.Semin Perinatol2005,
29:195-202.
18. Cuckle HS, van Lith JMM:Appropriate biochemical parameters in first-trimester screening for Down syndrome.Prenat Diagn1999,19:505-512. 19. Evans MI, Krantz DA, Hallahan TW, Galen RS:Meta-analysis of first
trimester Down syndrome screening studies: freeb-human chorionic gonadotropin significantly outperforms intact human chorionic gonadotropin in a multimarker protocol.Am J Obstet Gynecol2007,
196:198-205.
20. Tišlarić-Medenjak D, Košec V, Kos M, Latin V, Harni V, LovrićB,et al:
Combined ultrasound and biochemical screening for fetal aneuploidy at 10-14 weeks of pregnancy: first results of test performance in Croatia.
Gynaecol Perinatol2008,17:195-200.
21. Tišlarić-Medenjak D, Zec I, Košec V, Ivičević-BakulićT, Kuna K, Herman R, et al:Combined ultrasound-biochemical screening of fetal trisomies in the first trimester and double biochemical screening in the second trimester in unaffected pregnancies.Gynaecol Perinatol2009,18:123-131. 22. Seth J, Sturgeon CM, Aellis AR, Al-Sadie R, Logan M:UK NEQAS for peptide
and related substances.Annual Report 2000Sheffield: UK NEQAS. 23. Spencer K:First trimester maternal serum screening for Down’s
syndrome: an evaluation of the DPC Immulite 2000 freeb-hCG and PAPP-A assays.Ann Clin Biochem2005,42:30-40.
24. Palomaki GE, Bradley LA, McDowell GA:ACMG Technical standards and guidelines: Prenatal screening for Down syndrome.Genet Med2005,
7:344-354.
25. Spencer K:Risk, a QC parameter.DS News2003,10:30-31.
26. Spencer K, Crossley JA, Aitken DA, Nix ABJ, Dunstan FDJ, Williams K:The effect of temporal variation in biochemical markers of trisomy 21 across the first and second trimesters of pregnancy on the estimation of individual patient specific risks and detection rates for Down’s syndrome.Ann Clin Biochem2003,40:219-231.
27. Spencer K, Cuckle HS:Screening for chromosomal anomalies in the first trimester: does repeat maternal screening improve detection rates?
Prenat Diagn2002,22:903-906.
doi:10.1186/1756-0500-3-194
Cite this article as:Tišlarić-Medenjaket al.:The impact of temporal variability of biochemical markers PAPP-A and freeb-hCG on the specificity of the first-trimester Down syndrome screening: a Croatian retrospective study.BMC Research Notes20103:194.
Submit your next manuscript to BioMed Central and take full advantage of:
• Convenient online submission
• Thorough peer review
• No space constraints or color figure charges
• Immediate publication on acceptance
• Inclusion in PubMed, CAS, Scopus and Google Scholar
• Research which is freely available for redistribution