R E S E A R C H A R T I C L E
Open Access
Factors associated with the inter-facility
transfer of inpatients in Sichuan
province, China
Linxin Liu
1, Chaojie Liu
2, Zhanqi Duan
3, Jingping Pan
3and Min Yang
4,5*Abstract
Background:The overuse of tertiary hospitals and underuse of primary care facilities has been one of the key reasons leading to fast health expenditure increase and health service utilization inequity in China. Recent health care reform in China tries to enforce a patient transfer system to make the health services utilization more efficient. This study examined the pattern and associated factors of inter-facility transfer of inpatients in Sichuan province of Western China.
Methods:Patient discharge records (n= 1,490,695) from 604 general hospitals during the period of April to June 2015 in Sichuan were extracted from the front page of the medical records system with individual information on demographics, insurance coverage, diagnoses, hospitals admitted and discharge type. We calculated the
percentage of inpatients transferring to other health facilities, the Inter-Facility Transfer Rate (IFTR) with adjustment for Charlson Comorbidity Index (CCI). Multi-level logistic regression models were established to identify factors associated with IFTRs.
Results:A small number of tertiary hospitals (n= 75, 12.41%) shared 51.71% (n= 770,823) of all admitted cases while a large number of primary/unrated hospitals (n= 321, 53.15%) shared only 8.15%. The overall CCI-adjusted IFTR was 2.08% with 3.73% among secondary hospitals, 1.87% among tertiary hospitals and 1.30% among primary/ unrated hospitals. Uninsured patients (OR = 1.13) and those with a lower level of insurance entitlements (OR = 1.12 for the New Rural Cooperative Medical Scheme and the Basic Medical Insurance for Urban Residents) were more likely to experience inter-facility transfer than those with a higher level of insurance entitlements (the Basic Medical Insurance for Urban Employees).
Conclusion:The level of IFTR in general hospitals in Sichuan is low, which is associated with the level of hospitals and insurance entitlements. Further studies are needed to better understand how patients and health care providers respond to different insurance policies and make decisions on inter-facility transfer.
Keywords:Inter-facility transfer, Inpatient care, Health policy, Health insurance, General hospital
Background
Inter-facility transfer refers to any patient transfer between two health care facilities for specific procedures, continu-ing medical care or rehabilitation. The bond between health care facilities in a regional medical network is
strong in many developed countries such as Australia, the USA, and the UK. Patient safety in terms of mortality is a major concern in inter-facility transfer studies [1,2]. Many practice guidelines have been developed in developed countries, requiring both the referring and receiving facil-ities to take actions to ensure the safety, continuity and coordination of patient care during the transfer process, which includes the initial decision of patient transfer [3].
In China, the health service delivery system comprises hospitals, primary care institutions and public health in-stitutions [4]. The hospital sector is dominated by public
© The Author(s). 2019Open AccessThis article is distributed under the terms of the Creative Commons Attribution 4.0 International License (http://creativecommons.org/licenses/by/4.0/), which permits unrestricted use, distribution, and reproduction in any medium, provided you give appropriate credit to the original author(s) and the source, provide a link to the Creative Commons license, and indicate if changes were made. The Creative Commons Public Domain Dedication waiver (http://creativecommons.org/publicdomain/zero/1.0/) applies to the data made available in this article, unless otherwise stated.
* Correspondence:yangmin2013@scu.edu.cn;yangmin3396@foxmail.com 4West China School of Public Health, West China Research Center for Rural
Health Development, Sichuan University, Chengdu 610041, Sichuan, People’s Republic of China
5Faculty of Health, Arts and Design, Swinburne University of Technology,
Melbourne, Australia
hospitals [5]. The hospital accreditation system run by the government classifies hospitals into three levels: pri-mary, secondary and tertiary, based on their size, scope and capacity of services. This system applies to both general and specialist hospitals. Tertiary hospitals usually have more than 500 beds, compared to 100–499 beds for secondary hospitals and 20–99 beds for primary hos-pitals [6]. Higher levels of hoshos-pitals are staffed by better-educated health workers, have more advanced medical equipment, and are able to deliver a wider range of services. The price schedule set up by the government is also linked to the level of hospitals: higher prices for higher levels of hospitals.
In China, patients are entitled to choose any local health facilities for services [7]. Despite a higher propor-tion of out-of-pocket payments, patients rely heavily on large hospitals, even for minor and non-urgent illness [8]. The overuse of tertiary hospitals and the underuse of primary and secondary facilities has been blamed for inflating health expenditure [8]. This problem has be-come one of the major targets of the recent health sys-tem reform.
In 2009, the Chinese government launched a new round of health reform, with an aim to develop a health-care system with good accessibility, affordability, safety and quality. The reform envisaged a tiered health care delivery system (THCDS), which requires “first contact at primary care facilities and coordinated referral prac-tices” [9]. Patients in urgent or critical conditions are supposed to be transferred from primary care facilities to higher levels of hospitals or from one tertiary hospital to another with strength in the relevant area of specialist care; whereas patients with chronic conditions and those in a stable condition are supposed to be managed by pri-mary care facilities [10]. In 2015, the State Council issued guidelines for developing the THCDS [11]. How-ever, no primary care gatekeeping mechanisms are in-cluded in the guidelines. A strong focus has been placed on structural adjustments of health care facilities, in-cluding strengthening primary care and functional speci-fications for different levels of health facilities [4].
Patient referral and transfer arrangements are shaped by factors associated with patients, health facilities and third-party payers such as medical insurance [12, 13]. Unfortunately, the THCDS proposal has not been well endorsed by patients. Studies show that patients are con-cerned about the low capacity and poor quality of care delivered by primary care facilities, preventing them from using primary care facilities as first contact or be-ing transferred back from higher levels of hospitals [10]. Patients and their family always weigh the need for treat-ments against a range of considerations, such as the price of different treatment regimes, insurance reim-bursements, and the prospect of a full recovery. Their
decisions are likely to be shaped by their financial cap-acity, educational attainment, and cultural background.
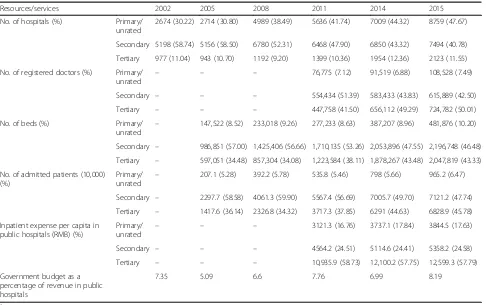
Although some health facilities signed agreements for patient referral arrangements in response to the national policy, the implementation is challenging due to a lack of enforcement and punitive measures [14]. Over the past few decades, health facilities in China have been ex-posed to intense market competition. They have increas-ingly relied on revenues generated from fee for services. The government budget comprised less than 9% of hos-pital revenues over the last decade (Table1). In this con-text, health facilities at lower levels might still refer/ transfer patients to a higher level facility to address con-cerns for patient safety. Indeed, the service capacity of primary care facilities has been alarmingly low in China and the majority of doctors work in medium- and large-sized hospitals (Table 1). However, it is less likely for hospitals to refer/transfer patients to another hospital or a lower level facility because doing so simply means a loss of revenue.
Anecdotal evidence shows that medical insurance policies also have a significant impact on patient referral/transfer ar-rangements [15]. It is a common practice in China that pa-tients are charged a higher price and given a lower percentage of insurance reimbursement for services in ter-tiary hospitals compared with those in secondary and pri-mary facilities. However, there is no evidence available to demonstrate whether and how such policies work in en-couraging patients to change their preference. Tertiary hos-pital services have continued to grow at a speed higher than the secondary and primary care facilities (Table1).
It is important to understand how hospitals refer/ transfer patients before appropriate interventions can be developed. This study aimed to examine inter-facility transfer activities for hospital inpatients in Sichuan prov-ince, using a large database of patient records main-tained by the provincial health authority.
Methods
A cross-sectional study was undertaken. The research questions of this study were: (1) what percentage of pa-tients admitted to hospitals experienced inter-facility transfer? (2) what were the factors associated with the inter-facility transfer of inpatients?
Setting
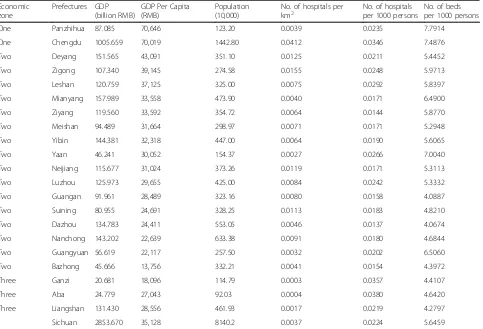
per capita ranging from 13,756 to 70,646 Yuan RMB in 2014 (Table2).
The Sichuan government initiated the THCDS reform in September 2014 [17]. In the proposed THCDS, county hosptials, township/community health centers, and village clinics are categorized as primary care facilities, although the majority of county hospitals are actually secondary hospitals. Capacity building programs in relation to these facilities were developed with an intention to attract more patients to primary care facilities. In 2015, the Sichuan health authority introduced two indicators to monitor the progress of the THCDS: number of referred/transferred patients and patient referral/transfer rates [18].
Sichuan had 1942 hospitals by the end of 2015, includ-ing 1291 general hospitals and 651 non-general hospitals (e.g. specialist hospitals and hospitals of Chinese medi-cine). This study extracted data from 863 general hospitals in the province from April to June 2015, which covered 330 public hospitals and 533 private hospitals. The extracted data contained 1.57 million patient discharge records (61.57% of all cases over the same period). Non-general hospitals were excluded from the study.
Data source
Data were extracted from the front page of inpatient medical records, which included socio-demographic
characteristics (age, sex, ethnicity) and the insurance cover-age of the patient, the location, ownership and accredited level of the treating hospitals, services related to the episode of care (diagnoses, surgery), and discharge destinations.
The item“discharge destination”recorded inter-facility transfer arrangements. Unfortunately, details of the planned receiving facilities for transferred patients were not recorded. About 4.51% of this item contained miss-ing data and 8.05% contained a logical mismatch in values between“discharge destination”and“receiving fa-cility”. These records were either corrected or excluded from the final analyses. Hospitals with less than 5 cases of valid recorded“discharge destination”and those with more than 20% of missing values in“discharge destination” were excluded from this study. This resulted in a final sam-ple size of 1,490,695 cases from 604 hospitals. The geo-graphic distribution of the participating hospitals resembles the distribution of all hospitals in the database (Fig.1).
Variables and statistical analysis
[image:3.595.57.543.97.402.2]Inter-facility transfer of patients was the major concern of this study, which was defined as the transfer of a pa-tient from the admitted hospital to another facility for treatment of the same conditions. A code 1 was assigned to a patient who was transferred to another facility at discharge, and 0 otherwise.
Table 1Number (percentage) of resources and services across three levels of hospitals in China (2002–2015)a
Resources/services 2002 2005 2008 2011 2014 2015
No. of hospitals (%) Primary/ unrated
2674 (30.22) 2714 (30.80) 4989 (38.49) 5636 (41.74) 7009 (44.32) 8759 (47.67)
Secondary 5198 (58.74) 5156 (58.50) 6780 (52.31) 6468 (47.90) 6850 (43.32) 7494 (40.78)
Tertiary 977 (11.04) 943 (10.70) 1192 (9.20) 1399 (10.36) 1954 (12.36) 2123 (11.55)
No. of registered doctors (%) Primary/
unrated – – –
76,775 (7.12) 91,519 (6.88) 108,528 (7.49)
Secondary – – – 554,434 (51.39) 583,433 (43.83) 615,889 (42.50)
Tertiary – – – 447,758 (41.50) 656,112 (49.29) 724,782 (50.01)
No. of beds (%) Primary/
unrated –
147,522 (8.52) 233,018 (9.26) 277,233 (8.63) 387,207 (8.96) 481,876 (10.20)
Secondary – 986,851 (57.00) 1,425,406 (56.66) 1,710,135 (53.26) 2,053,896 (47.55) 2,196,748 (46.48)
Tertiary – 597,051 (34.48) 857,304 (34.08) 1,223,584 (38.11) 1,878,267 (43.48) 2,047,819 (43.33)
No. of admitted patients (10,000) (%)
Primary/ unrated
– 207.1 (5.28) 392.2 (5.78) 535.8 (5.46) 798 (5.66) 965.2 (6.47)
Secondary – 2297.7 (58.58) 4061.3 (59.90) 5567.4 (56.69) 7005.7 (49.70) 7121.2 (47.74)
Tertiary – 1417.6 (36.14) 2326.8 (34.32) 3717.3 (37.85) 6291 (44.63) 6828.9 (45.78)
Inpatient expense per capita in public hospitals (RMB) (%)
Primary/
unrated – – –
3121.3 (16.76) 3737.1 (17.84) 3844.5 (17.63)
Secondary – – – 4564.2 (24.51) 5114.6 (24.41) 5358.2 (24.58)
Tertiary – – – 10,935.9 (58.73) 12,100.2 (57.75) 12,599.3 (57.79)
Government budget as a percentage of revenue in public hospitals
7.35 5.09 6.6 7.76 6.99 8.19
a
Table 2GDP in Chinese RMB and medical resources in 21 prefectures of Sichuan in 2014a
Economic zone
Prefectures GDP (billion RMB)
GDP Per Capita (RMB)
Population (10,000)
No. of hospitals per
km2 No. of hospitalsper 1000 persons No. of bedsper 1000 persons
One Panzhihua 87.085 70,646 123.20 0.0039 0.0235 7.7914
One Chengdu 1005.659 70,019 1442.80 0.0412 0.0346 7.4876
Two Deyang 151.565 43,091 351.10 0.0125 0.0211 5.4452
Two Zigong 107.340 39,145 274.58 0.0155 0.0248 5.9713
Two Leshan 120.759 37,125 325.00 0.0075 0.0292 5.8397
Two Mianyang 157.989 33,558 473.90 0.0040 0.0171 6.4900
Two Ziyang 119.560 33,592 354.72 0.0064 0.0144 5.8770
Two Meishan 94.489 31,664 298.97 0.0071 0.0171 5.2948
Two Yibin 144.381 32,318 447.00 0.0064 0.0190 5.6065
Two Yaan 46.241 30,052 154.37 0.0027 0.0266 7.0040
Two Neijiang 115.677 31,024 373.26 0.0119 0.0171 5.3113
Two Luzhou 125.973 29,655 425.00 0.0084 0.0242 5.3332
Two Guangan 91.961 28,489 323.16 0.0080 0.0158 4.0887
Two Suining 80.955 24,691 328.25 0.0113 0.0183 4.8210
Two Dazhou 134.783 24,411 553.05 0.0046 0.0137 4.0674
Two Nanchong 143.202 22,639 633.38 0.0091 0.0180 4.6844
Two Guangyuan 56.619 22,117 257.50 0.0032 0.0202 6.5060
Two Bazhong 45.666 13,756 332.21 0.0041 0.0154 4.3972
Three Ganzi 20.681 18,096 114.79 0.0003 0.0357 4.4107
Three Aba 24.779 27,043 92.03 0.0004 0.0380 4.6420
Three Liangshan 131.430 28,556 461.93 0.0017 0.0219 4.2797
Sichuan 2853.670 35,128 8140.2 0.0037 0.0224 5.6459
a
Data source: Statistical reports from Sichuan Health and Family Planning Commission and Sichuan Statistics Yearbook
[image:4.595.58.544.527.703.2]Inter-facility transfer rate (IFTR) = transferred out cases recorded in“discharge destination”/ all admitted cases with a valid value in“discharge destination”* 100%
We calculated IFTR by population, hospital, and district. The factors associated with patient transfer were mea-sured at three levels - patients, hospitals, and prefec-tures. The data structured as patients (first level) nesting within hospitals (second level) and hospitals nesting within prefectures (third level). We performed multilevel logistic regression analyses using MLwiN 2.32 [19]. The first model (Model A) examined the associations be-tween IFTR and all levels of associated variables. We then divided the hospital sample into three subgroups based on their accreditation status and fitted a multilevel model for each group: primary/unrated (Model B1), sec-ondary (Model B2), and tertiary (Model B3).
Independent variables were introduced into the regres-sion models using a stepwise approach. This procedure enabled us to observe changes in variances of random effects at hospital and prefecture levels. Variables exam-ined at the patient level included demographic charac-teristics of patients (age, sex, and ethnicity), medical insurance, and reasons for hospital admissions (principal diagnosis, comorbidity, admission condition, and sur-gery). Patients in China were entitled to three medical insurance programs subsidized by the government. Enrollees in the Basic Medical Insurance for Urban Em-ployees (including the retired) enjoyed the highest level of entitlements compared with enrollees of the other two: Basic Insurance for Urban Residents (those who were not employed by the formal public or private sec-tor) and New Rural Cooperative Medical Scheme (for rural residents). Comorbidity was captured in diagnoses other than the principal one. Admission condition was categorized as critical, urgent or non-urgent by the treat-ing medical doctor based on the seriousness of clinical conditions and the urgency for medical interventions at the time of admission. Variables examined at the hos-pital level included hoshos-pital capacity (accredited level) and hospital ownership (public vs. private). Variables ex-amined at the prefecture level included resources (eco-nomic zone) and hospital density (number of hospitals per square kilometer).
It is important to adjust for risks of patient transfer. There are several well-established instruments for risk-adjustments: Diagnosis Related Group (DRG) [20], Acute Physiology and Chronic Health Evaluation (APA-CHE) [21], Case Mix Index (CMI) [22], and Comorbidity Index. The most commonly used instrument is perhaps the DRGs. Unfortunately, a Chinese version of DRGs has not been rigorously contested yet. In this study, we chose the Charlson Comorbidity Index (CCI) [23], which
is easy to calculate and has been widely used to reflect the severity and death risk of disease conditions. Up to 17“other diagnoses”were weighted in the calculation of CCI (Table3) [24]. The IFTR was adjusted based on the CCI score distribution of all cases in this study.
All variables were arranged as dichotomous or cat-egorical for the purpose of Chi-square analyses and re-gression analyses. Patient age was coded into eight groups (0–4, 5–14, 15–29, 30–44, 45–59, 60–69, 70–79, 80+) in line with the categorization adopted in the WHO global burden of disease study [25]. Hospital density was divided into four levels based on quartile and median cut-off points (P25: percentile 25; P50: me-dian; P75: percentile 75) at the county level. CCI was di-vided into five groups: 0, 1, 2–4, 5–7, 8+ [26].
In the regression analyses, missing data in any of the above variables were denoted as “unknown” and coded as a separate category group. Some groups (such as diag-nostic groups or insurance groups) were merged because their IFTRs were similar.
Results
Characteristics of hospital patients
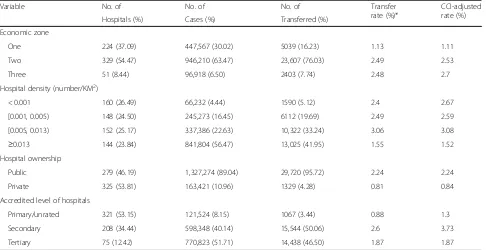
More than half (53.15%) of primary/unrated hospitals (n= 321) shared only 8.15% (n= 121,524) of all admitted cases. By contrast, a small number (n= 75, 12.41%) of tertiary hos-pitals shared 51.71% (n= 770,823) of all admitted cases (Table4).
[image:5.595.308.538.480.732.2]Gender distribution of the cases was almost equal (49.18% male vs. 50.79% female). The median age of pa-tients was 51 years. Of the admitted papa-tients, 92.70%
Table 3Weights assigned to comorbidity conditions
Condition Weights
Acute myocardial infarction 1
Congestive heart failure 1
Peripheral vascular disease 1
Cerebral vascular accident 1
Dementia 1
Pulmonary disease 1
Connective tissue disorder 1
Peptic ulcer 1
Liver disease 1
Diabetes 1
Diabetes complications 2
Paraplegia 2
Renal disease 2
Cancer 2
Metastatic cancer 6
Severe liver disease 3
were Han ethnicity; 71.03% recorded no comorbidity (n = 1,058,825); 5.67% (n= 84,529) had a CCI greater than two (see Additional file 1).
Inter-facility transfer of patients
Inter-facility transfer initiated by doctors only accounted for 2.08% of all admitted cases. In addition, 5.05% cases were discharged against doctors’ advice. No data were recorded about whether those patients sought services from other health facilities.
A total of 195 (32.28%) hospitals recorded zero inter-facility transfer over the study period of the 3 months, 180 of which were primary/unrated; 153 (25.33%) had less than 1% inter-facility transfer; and 10 hospitals had more than 10% inter-facility transfer (the highest was 50.26%).
Factors associated with inter-facility transfer of patients
Univariate analyses
Hospitals located in Economic Zone One had the lowest IFTR. Counties in the P50-P75 hospital density range had the highest IFTR. Public hospitals were more likely to ini-tiate inter-facility patient transfer than their private coun-terparts. Secondary hospitals recorded the highest IFTR (2.60%); whereas the lowest transfer was found in pri-mary/unrated hospitals. The regional and across-hospital differences in inter-facility transfer of patients became greater after adjusting for CCI (Table4).
At the patient level, male patients (2.31%) were more likely to be transferred than females (1.86%). The 45–59,
60–69, and 70–79 age groups had a relatively higher IFTR (2.27, 2.42, and 2.38% respectively) while the 15– 29 age group had the lowest IFTR (1.60%). The transfer rates of patients who were referred from other facilities (3.04%), and those with critical conditions (4.31%), had no surgery (2.38%), and with a mid-range CCI of 2–4 (3.03%) were higher than the others. Undiagnosed condi-tions (not elsewhere classified) had the highest IFTR (5.64%) among all diagnosis groups (see Additional file1).
Patients enrolled with the New Rural Cooperative Medical Scheme (NRCMS) and the Urban Resident Basic Medical Insurance (URBMI) had higher IFTRs (2.37 and 2.15% respectively) than those enrolled with the Urban Employee Basic Medical Insurance (UEBMI) (1.84%) and those with no medical insurance coverage (1.70%). Commercial insurance members recorded an IFTR of 3.91%. A small percentage (1.41%) of patients were covered by“other social insurance”(such as repro-ductive insurance or work safety insurance). They had the highest IFTR (8.70%), but most were reported from one hospital (see Additional file1).
Multivariate analyses
[image:6.595.57.543.99.349.2]Model A (Table 5) produced similar results to those of univariate analyses. Most variables identified by the univariate analyses remained statistically significant, ex-cept for “ethnicity” and “economic zone”. The odds of inter-facility patient transfer in secondary and tertiary hos-pitals were 3.55 (p< 0.0001) and 2.45 (p< 0.0001) times greater than those in primary hospitals, respectively. Such
Table 4Inter-facility transfer of patients by location and context of hospitals
Variable No. of No. of No. of Transfer
rate (%)*
CCI-adjusted rate (%)
Hospitals (%) Cases (%) Transferred (%)
Economic zone
One 224 (37.09) 447,567 (30.02) 5039 (16.23) 1.13 1.11
Two 329 (54.47) 946,210 (63.47) 23,607 (76.03) 2.49 2.53
Three 51 (8.44) 96,918 (6.50) 2403 (7.74) 2.48 2.7
Hospital density (number/KM2)
< 0.001 160 (26.49) 66,232 (4.44) 1590 (5.12) 2.4 2.67
[0.001, 0.005) 148 (24.50) 245,273 (16.45) 6112 (19.69) 2.49 2.59
[0.005, 0.013) 152 (25.17) 337,386 (22.63) 10,322 (33.24) 3.06 3.08
≥0.013 144 (23.84) 841,804 (56.47) 13,025 (41.95) 1.55 1.52
Hospital ownership
Public 279 (46.19) 1,327,274 (89.04) 29,720 (95.72) 2.24 2.24
Private 325 (53.81) 163,421 (10.96) 1329 (4.28) 0.81 0.84
Accredited level of hospitals
Primary/unrated 321 (53.15) 121,524 (8.15) 1067 (3.44) 0.88 1.3
Secondary 208 (34.44) 598,348 (40.14) 15,544 (50.06) 2.6 3.73
Tertiary 75 (12.42) 770,823 (51.71) 14,438 (46.50) 1.87 1.87
Table 5Factors associated with inter-facility patient transfer: results of the multi-level logistic regression analyses
Variables Model A
(All hospitals)
Model B1
(primary/unrated hospitals)
Model B2
(secondary hospitals)
Model B3 (tertiary hospitals)
Fixed effects
Individual level
Age (years)(vs. 0–4)
5–14 1.48 (1.37, 1.60)** 0.77 (0.29, 2.02) 1.13 (1.02, 1.26) 2.10 (1.86, 2.38)**
15–29 2.06 (1.93, 2.19)** 1.44 (0.69, 2.97) 1.49 (1.37, 1.63)** 3.15 (2.85, 3.48)**
30–44 2.22 (2.10, 2.36)** 1.19 (0.58, 2.40) 1.57 (1.45, 1.70)** 3.52 (3.21, 3.85)**
45–59 2.41 (2.28, 2.54)** 1.17 (0.58, 2.33) 1.77 (1.65, 1.90)** 3.69 (3.39, 4.01)**
60–69 2.26 (2.14, 2.40)** 1.12 (0.56, 2.24) 1.64 (1.52, 1.76)** 3.53 (3.24, 3.85)**
70–79 2.04 (1.92, 2.16)** 1.21 (0.60, 2.43) 1.50 (1.39, 1.62)** 3.08 (2.82, 3.37)**
80+ 1.63 (1.52, 1.75)** 1.47 (0.72, 2.99) 1.17 (1.07, 1.29)** 2.40 (2.15, 2.67)**
Female (vs. male) 0.85 (0.83, 0.87)** 0.79 (0.68, 0.91)* 0.82 (0.79, 0.86)** 0.88 (0.85, 0.91)**
Minority (vs. Han ethnicity) 1.03 (0.95, 1.12) 0.99 (0.47, 2.07) 0.94 (0.83, 1.07) 1.10 (0.99, 1.22)
Admission type (vs. Emergency department)
Outpatient clinic 0.82 (0.79, 0.86)** 0.93 (0.74, 1.17) 0.81 (0.77, 0.85)** 0.83 (0.78, 0.88)**
Transferred 3.39 (2.92, 3.93)** 0.71 (0.16, 3.14) 1.36 (1.00, 1.85)* 5.46 (4.63, 6.44)**
Other type or missing 0.94 (0.85, 1.05) 0.37 (0.19, 0.72)* 0.98 (0.85, 1.12) 0.98 (0.84, 1.14)
Condition at admission (vs. non-severe)
Critical 3.20 (3.03, 3.37)** 4.03 (2.87, 5.68)** 3.26 (3.04, 3.50)** 2.96 (2.74, 3.19)**
Urgent 1.67 (1.61, 1.74)** 1.27 (1.05, 1.54) 1.55 (1.48, 1.64)** 1.82 (1.71, 1.93)**
CCI (score) (vs. 0)
1 1.18 (1.14, 1.22)** 0.98 (0.80, 1.20) 1.12 (1.07, 1.18)** 1.25 (1.19, 1.32)**
2–4 1.34 (1.29, 1.40)** 1.17 (0.91, 1.50) 1.23 (1.15, 1.30)** 1.45 (1.37, 1.53)**
5–7 1.18 (1.05, 1.32)* 1.72 (0.88, 3.36) 1.52 (1.24, 1.86)** 1.05 (0.91, 1.22)
≥8 1.01 (0.54, 1.88) 1.23 (0.13, 11.2) 2.01 (0.85, 4.70) 0.57 (0.21, 1.56)
Surgical operations (vs. Yes) 1.58 (1.52, 1.64)** 2.38 (1.69, 3.35)** 2.11 (1.97, 2.25)** 1.39 (1.33, 1.46)**
Diagnosis (vs. Not elsewhere classified)
Infectious/Blood/Endocrine 0.51 (0.47, 0.55)** 0.45 (0.28, 0.73)* 0.43 (0.39, 0.48)** 0.61 (0.55, 0.68)**
Nervous/Perinatal/Circularly/Fatal accident 0.41 (0.38, 0.44)** 0.37 (0.24, 0.56)** 0.40 (0.36, 0.43)** 0.43 (0.39, 0.48)**
Neoplasms/Respiratory/Digestive/Congenital/Injury/ services
0.35 (0.32, 0.37)** 0.31 (0.21, 0.47)** 0.31 (0.29, 0.34)** 0.38 (0.35, 0.42)**
Mental/Eye/Ear/Skin/Muscle/Genitourinary/Pregnancy 0.24 (0.22, 0.26)** 0.21 (0.13, 0.32)** 0.23 (0.21, 0.26)** 0.25 (0.23, 0.28)**
Medical insurance (vs. UEBMI)
URBMI/NRCMS 1.12 (1.07, 1.16)** 0.98 (0.80, 1.20) 1.10 (1.04, 1.17)** 1.17 (1.11, 1.24)**
Commercial insurance 0.91 (0.82, 1.02) 1.41 (0.45, 4.37) 0.95 (0.82, 1.10) 0.85 (0.72, 1.01)
No insurance payment 1.13 (1.07, 1.20)** 1.28 (0.93, 1.75) 1.09 (1.00, 1.19) 1.22 (1.13, 1.31)**
Other social insurance 0.78 (0.72, 0.84)** 0.70 (0.37, 1.33) 1.55 (1.26, 1.90)** 0.75 (0.69, 0.81)**
Other 0.96 (0.90, 1.02) 0.91 (0.66, 1.25) 0.96 (0.87, 1.06) 1.03 (0.95, 1.11)
Hospital level
Accredited level (vs. primary/unrated)
Secondary 3.55 (2.63, 4.79)** – – –
Tertiary 2.45 (1.67, 3.59)** – – –
Hospital ownership (vs. public) – 0.57 (0.27, 1.17) 0.74 (0.48, 1.14) 0.96 (0.05, 15.5)
Region level
an association was influenced by hospital ownership. Be-cause of the collinearity between hospital ownership and accredited levels of hospitals, hospital ownership was ex-cluded from Model A. Patients without medical insurance coverage (OR = 1.13, p< 0.0001) and those covered by URBMI/NRCMS (OR = 1.12,p< 0.0001) were more likely to be transferred than those covered by UEBMI. The dif-ference of IFTR between commercial insurance members and UEBMI members was not statistically significant.
Model B2 (for secondary hospitals) and B3 (for tertiary hospitals) revealed similar patient factors predicting IFTRs. However, for primary/unrated hospitals (Model B1), medical insurance and CCI became statistically in-significant in predicting patient transfer. Hospital owner-ship was no longer a factor predicting patient transfer in Models B1, B2 and B3.
The effects of economic zone on patient transfer var-ied by level of hospital: for primary/unrated hospitals (Model B1), Zone Two had lower odds (OR = 0.45, p= 0.004) than Zone One; for secondary hospitals (Model B2), Zone Three had higher odds (OR = 2.45, p= 0.009) than Zone One; for tertiary hospitals (Model B3), there was no significant difference across economic zones.
The random effects of IFTRs across hospitals were large, with an estimated variance of 2.31 for primary/un-rated hospitals (p< 0.0001), 1.20 for secondary hospitals (p< 0.0001) and 1.88 for tertiary hospitals (p< 0.0001). This was not entirely explicable by the characteristics of patients and hospitals.
Discussion
Main findings
Overall, patient transfer rates are low in general hospitals in Sichuan. On average, 2.08% (31,049) of ad-mitted patients were transferred to other facilities. The
CCI-adjusted IFTRs ranged from 1.30% in primary/un-rated hospitals, to 1.87% in tertiary hospitals and 3.73% in secondary hospitals. Among these transferred cases, there may be some emergency transfers initiated imme-diately by the emergency department, which may not ne-cessarily reflect the THCDS arrangements. So the actual transfer rate under the THCDS may be even lower. A national study in the United States revealed that, on average, 4.19% of hospital patients experienced a medical transfer from 2008 to 2011 [27]. Tarima and colleagues found that non-trauma centers in the US transferred 98% of their pediatric patients, even those with very low Injury Severity Score (ISS) [28]. Transfer rates for pa-tients with acute myocardial infarction (AMI) admitted to community hospitals reached 50% in the US [29]. A study using the American National Emergency Depart-ment Sample from 2006 to 2012 revealed a 33.71% transfer rate for 1–21 year-old male patients with tes-ticular torsion [30].
[image:8.595.58.538.98.247.2]The low IFTRs in Sichuan are perhaps associated with the freedom of patient choice of facilities and the lack of trust of patients in primary care facilities. The current healthcare system in China allows patients to choose a tertiary hospital without referral from primary care or a lower level of health provider. Studies show that patients prefer to choose the “right provider” upfront without “being troubled to transfer” at a later stage [31]. Natur-ally, better-equipped hospitals (often tertiary hospitals) become a preferred option. In a health system where pa-tients trust primary care and use primary care as their first point of contact, patient referral/transfer rates in primary care facilities are usually higher and the lowest patient transfer rate can be found in the higher level health facilities. In the US and UK, for example, inter-hospital patient transfers are a routine and Table 5Factors associated with inter-facility patient transfer: results of the multi-level logistic regression analyses(Continued)
Variables Model A
(All hospitals)
Model B1
(primary/unrated hospitals)
Model B2
(secondary hospitals)
Model B3 (tertiary hospitals)
Zone two 0.80 (0.47, 1.35) 0.45 (0.26, 0.77)* 1.27 (0.80, 2.02) 1.20 (0.54, 2.66)
Zone three 1.33 (0.61, 2.92) 0.43 (0.08, 2.28) 2.45 (1.24, 4.87)* 0.49 (0.07, 3.44)
Hospital density (number/km2)(vs. < 0.004)
[0.004, 0.006) 0.69 (0.38, 1.25) 0.38 (0.06, 2.10) 0.70 (0.41, 1.21) 0.27 (0.01, 4.60)
[0.006, 0.009) 0.64 (0.34, 1.18) 0.39 (0.07, 2.07) 0.71 (0.38, 1.30) 0.26 (0.02, 3.27)
≧0.009 0.47 (0.25, 0.89) 0.30 (0.06, 1.55) 0.57 (0.30, 1.09) 0.15 (0.01, 2.26)
Random effect†
Level 3 region (σ2
v0)‡ 0.06 (0.05) – – –
Level 2 hospital (σ2
u0) 1.72 (0.13)** 2.31 (0.33)** 1.20 (0.137)** 1.88 (0.32)**
Notes - Presented by OR (odds ratio) and its 95% CI (confidence intervals); Each diagnosis group was presented with only one word, while complete terms were presented in the supplementary data (see Additional file1).UEBMIUrban Employee Basic Medical Insurance,URBMIUrban Resident Basic Medical Insurance,
NRCMSNew Rural Cooperative Medical Scheme *P< 0.01, **P< 0.001
†Estimate and SE
essential part of care in community hospitals [32]. Non-trauma centers, non-teaching hospitals and hospi-tals in rural areas have higher patient transfer rates than other facilities. Compared with primary care facilities, higher level facilities are more likely to obviate consider-ations for patient transfer care [13, 33]. Unfortunately, such a system is absent in China.
The low IFTRs could also be an indication of structural problems and a lack of cooperation across health facilities. Health resources have been concentrated in large hospitals in China. China has, on average, 38 hospital beds per 10,000 of the population, compared with 39 in Australia. Despite the high proportion of out-of-pocket payment, China has achieved a 15% hospital admission rate, almost equivalent to Australia’s 16.7% (free in public hospitals) [34, 35]. However, a large proportion (close to half ) of these services is provided by tertiary hospitals. Health fa-cilities at lower levels (county and below) are often left under-resourced and under-used. Although the govern-ment has recently put great efforts into strengthening pri-mary care, it takes time to get pripri-mary care facilities to a status that can attract more patients. For now, hospitals still have strong incentives to compete for patients and in-crease volumes of services. Tertiary hospitals have greater advantages over their secondary and primary counterparts in the market [8].
This study shows that the severity and complexity of patient conditions could be the major factors associated with the inter-facility patient transfer. Despite differences across different levels of hospitals, higher IFTRs were found consistently for patients who had critical or ur-gent conditions, or had uncertain diagnoses and patients who were admitted through emergency departments or referred from other facilities. These results are consistent with findings of studies undertaken elsewhere [27, 36]. It is reasonable to predict that it is unlikely that primary and secondary hospitals will refuse to transfer patients whom they are not able to manage properly, and enhancing THCDS may force tertiary hospitals to focus more on the treatment of difficult cases.
Some commentators call for policy incentives for ter-tiary hospitals to strengthen bonds with secondary and primary hospitals. However, it remains unclear whether the monopoly of tertiary hospitals can be broken through the current policy and insurance interventions [37]. Policies that are put in place for the development of THCDS often include higher insurance reimburse-ment rates for patients referred from lower levels of health facilities. It is assumed that patients, especially those with limited ability to pay, would take precautions to choose tertiary hospitals as a preferred provider. However, the maximum gap in reimbursement rates among hospitals at different levels is only 7% for UEBMI members and 15% for URBMI/NRCMS members. It is
argued that this gap may not be strong enough to en-courage patients to divert from tertiary hospitals to sec-ondary or primary hospitals [37].
It seems that higher insurance entitlements discourage inter-facility transfer of inpatients in China. We found that patients without insurance (OR = 1.13) and URBMI/ NRCMS members (OR = 1.12) were more likely to ex-perience inter-facility transfer than their UEBMI coun-terparts. This finding is different from a study in the US using a Nationwide Inpatient Sample (NIS), which found the lowest transfer rate in uninsured patients [36]. An-other study in the US using the emergency department database reached the same conclusion [13]. In this study, we found that primary hospitals had the lowest IFTRs. In China, URBMI/NRCMS programs have less funds available and their members enjoy lower levels of entitle-ments than those enrolled with UEBMI. Patients in China prefer to make tertiary hospitals their first choice of providers. The higher level of insurance entitlements actually enhances the ability of patients to pay for more expensive tertiary hospital services. This helps them realize their first choice, but reduces the possibility of patient transfer from primary hospitals to secondary/ter-tiary hospitals. Previous studies in China showed con-sumers are not aware of the policies in relation to THCDS and there is a lack of trust in primary care pro-viders. This further exaggerates patient preference for tertiary hospitals [31].
Strengths
To our knowledge, this is the first study of its kind in China to examine inter-facility patient transfer using a large sample of inpatient records. We performed multi-level modelling, analyzing variables that are associated with patient transfer at three levels: patient characteristics (age, gender, insurance, admission pattern, diagnoses, medical procedures), hospital characteristics (ownership and accredited level), and location of hospitals (economic and resources). The study has policy implications for the development of THCDS.
Limitations and further study
considered a limited number of comorbidity. Future studies should explore more complicated methods of risk adjustments. Finally, patient care outcomes were not included in data analyses due to difficulties to link patient identity with medical records across hospitals.
Conclusion
International experience shows that a primary-care-domi-nated THCDS is the most cost efficient and cost effective service. The health system reform in China is heading in the right direction but is facing great challenges. The current system is still dominated by tertiary hospitals. There is a shortage of inter-facility cooperation and pa-tient transfer. The development of social health insurance, which covers over 96% of the population, and increased insurance benefits have failed to encourage patients to choose primary and secondary facilities as their preferred providers. There is a concern that the different social in-surance programs may widen the inequity in hospital care. As shown in this study, patients enrolled in the most gen-erous insurance scheme, UEBMI, are more likely to be ad-mitted to tertiary hospitals and least likely to transfer to other facilities compared with their URBMI/NRCMS counterparts and those without insurance.
Strengthening the capacity of primary and secondary fa-cilities is critical in the development of THCDs. However, it is equally important, if not more, to align insurance pol-icies with the goals of THCDs. The capacity control of ter-tiary hospital services should be considered, either through stronger planning or through reforms of funding mechanisms (such as a casemix payment system) or both. Patient support is also essential.
Additional file
Additional file 1:Table S1.Patient characteristics associated with inter-facility patient transfer. (DOCX 26 kb)
Abbreviations
95% CI:95% confidence interval; AMI: Acute myocardial infarction; APACHE: Acute Physiology and Chronic Health Evaluation; UEBMI: Urban Employee Basic Medical Insurance; URBMI: Urban Resident Basic Medical Insurance; CCI: Charlson Comorbidity Index; CMI: Case Mix Index; DRG: Diagnosis Related Group; IFTR: Inter-facility transfer rate; ISS: Injury Severity Score; NRCMS: New rural cooperative medical scheme; OR: Odds ratio; P25: Percentile 25; P50: Median; P75: Percentile 75; THCDS: Tiered health care delivery system
Acknowledgements
We are grateful to the doctors, nurses and other health workers who have put efforts into gathering, reporting and managing the medical records data. We also thank Yan Ren, Mengyun Liu and Nan Chen for their valuable comments to improve the manuscript.
Funding
This study was supported by the China Medical Board [16–252] and the Provincial Scientific Research Institute Achievement Transformation Project of Sichuan Province [15010112]. The funding sources had no role in the study
design, data collection, data analysis, interpretation of data or in writing the manuscript.
Availability of data and materials
Not applicable.
The medical records data were gathered by the government which do not have open access.
Authors’contributions
All authors were involved in the study design. LXL performed data analyses and drafted the paper. JPP and ZQD collected and extracted data for the study, and helped to interpret results. MY supervised data analyses and made critical contributions to interpretation of results and writing of the paper. CJL made critical contributions to articulation of the conceptual framework, interpretation of results and writing of the manuscript. All authors read all drafts of the manuscript. All authors read and approved the final manuscript.
Authors’information
None.
Ethics approval and consent to participate
Not applicable.
This study was based on the second-hand data which came from the Med-ical Records Information System of Sichuan province. All data were de-identified and the manuscript does not contain any individual person’s data, so this study was exempted from ethics approval.
Consent for publication
Not applicable.
Competing interests
The authors declare that they have no competing interests.
Publisher’s Note
Springer Nature remains neutral with regard to jurisdictional claims in published maps and institutional affiliations.
Author details
1West China School of Public Health, Sichuan University, Chengdu, Sichuan,
People’s Republic of China.2School of Psychology and Public Health, La Trobe University, Melbourne, VIC 3086, Australia.3Health and Family Planning
Information Centre of Sichuan Province, Chengdu, Sichuan, People’s Republic of China.4West China School of Public Health, West China Research Center
for Rural Health Development, Sichuan University, Chengdu 610041, Sichuan, People’s Republic of China.5Faculty of Health, Arts and Design, Swinburne
University of Technology, Melbourne, Australia.
Received: 17 January 2018 Accepted: 8 May 2019
References
1. Pickering A, Cooper K, Harnan S, Sutton A, Mason S, Nicholl J. Impact of prehospital transfer strategies in major trauma and head injury: systematic review, meta-analysis, and recommendations for study design. J Trauma Acute Care Surg. 2015;78(1):164–77.
2. Kudlow P, Burns KE, Adhikari NK, Bell B, Klein DJ, Xie B, Friedrich JO, Wald R. Inter-hospital transfers and outcomes of critically ill patients with severe acute kidney injury: a multicenter cohort study. Crit Care. 2014;18(5):1–7. 3. Clinical Excellence Commission (N.S.W.). Retrieval and Inter-hospital Transfer:
Clinical Focus Report : from Review of Root Cause Analysis And/or Incident Information Management System (IIMS) Data. 2013.http://trove.nla.gov.au/ work/189995069?selectedversion=NBD52683270. Accessed Mar 2016. 4. The State Council. Outline of Chinese National Health Care Service System
Plan (2015–2020). Beijing; 2015. http://www.gov.cn/zhengce/content/2015-03/30/content_9560.htm. Accessed Oct 2015.
6. Yip CYCM, Hsiao W, Meng QY, Wen C, Sun XM. Realignment of incentives for health-care providers in China. Lancet. 2010;375(9720):1120–30. 7. Wang HH, Wang JJ, Wong SY, Wong MC, Mercer SW, Griffiths SM. The
development of urban community health centres for strengthening primary care in China: a systematic literature review. Brit Med Bull. 2015;116(1):139. 8. Wang H, Gusmano MK, Cao Q. An evaluation of the policy on community health organizations in China: will the priority of new healthcare reform in China be a success? Health Policy. 2011;99(1):37.
9. The state council. Opinions on deepening the reform of medical and health system. 2009.http://www.gov.cn/test/2009-04/08/content_1280069.htm. Accessed Oct 2015.
10. Gao K, Gan X. Behavioral decision in two-way referral and its influencing factors in China. Chin Gen Pract. 2015;18(28):3393–5.
11. The State Council. Guiding opinions on promoting the constuction of tiered healthcare system. 2015.http://www.gov.cn/zhengce/content/2015-09/11/ content_10158.htm. Accessed Oct 2015.
12. Gan X, Gao K. Reviewing the literatures on referrals in medical service system. Chin Health Serv Manage. 2011;28:193–6.
13. Kindermann DR, Mutter RL, Cartright-Smith L, Rosenbaum S, Pines JM. Admit or transfer? The role of insurance in high-transfer-rate medical conditions in the emergency department. Ann Emerg Med. 2014;63(5):561. 14. Li D, Du X, Li F. Management and influential factors of the two-way referral:
from the perspective of patients and doctors. Chin Gen Pract. 2013;36:3590–3. 15. Wang Z. Study on two-way referral under basic medical insurance system.
Huazhong University of Science and Technology, 2010.
16. Zheng X, Hu J. The study on the medical resources allocation of 2020 in Sichuan Province. China Sci Technol Achiev. 2009;13:46–9.
17. Health and family planning commission of Sichuan Province. Opinion on establishing and perfecting the tiered healthcare system. 2014.http://wsjkw. sc.gov.cn/xx/gsgg/201410/t20141029_7342.html. Accessed May 2019. 18. Health and family planning Commission of Sichuan Province. Further
strengthen the monitoring and evaluation work of the tiered health care system. 2015.http://wsjkw.sc.gov.cn/wj/zcwjjjd/zcwj/201507/t20150708_ 9014.html. Accessed May 2019.
19. Yang M, Li X. Multilevel model for medicine and public Health Research. 1st ed. Beijing: Peking University Medical Press; 2007.
20. Romano PS, Chan BK. Risk-adjusting acute myocardial infarction mortality: are APR-DRGs the right tool? Health Serv Res. 2000;34(7):1491.
21. Knaus WA, Zimmerman JE, Wagner DP, Draper EA, Lawrence DE. APACHE-acute physiology and chronic health evaluation: a physiologically based classification system. Crit Care Med. 1981;9(8):591–7.
22. Zhang Y, Xu Y. Case mix method of hospital statistics and medical output (I). Chin J Hosp Stat. 1998;3(02):108–10.
23. Charlson ME, Pompei P, Ales KL, Mackenzie CR. A new method of classifying prognostic comorbidity in longitudinal studies: development and validation. J Chronic Dis. 1987;40(5):373–83.
24. Sundararajan V, Henderson T. New ICD-10 version of the Charlson comorbidity index predicted in-hospital mortality. J Clin Epidemiol. 2004; 57(12):1288–94.
25. Yang G, Wang Y, Zeng Y, Gao GF, Liang X, Zhou M, Wan X, Yu S, Jiang Y, Naghavi M. Rapid health transition in China, 1990-2010 : findings from the global burden of disease study 2010. Lancet. 2013;381(9882):1987–2015. 26. Charlson M, Wells MT, Ullman R, King F, Shmukler C. The Charlson
comorbidity index can be used prospectively to identify patients who will incur high future costs. PLoS One. 2014;9(12):e112479.
27. Reimer AP, Schiltz N, Koroukian SM, Madigan EA. National Incidence of medical transfer: patient characteristics and regional variation. J Health Human Serv Adm. 2015;38(4):509.
28. Tarima S, Ertl A, Groner JI, Cassidy LD. Factors associated with patients transferred from undesignated trauma centers to trauma centers. J Trauma Acute Care. 2015;79(3):378–85.
29. Roe MT, Chen AY, Delong ER, Boden WE, Calvin JE Jr, Cairns CB, Smith SC Jr, Pollack CV Jr, Brindis RG, Califf RM, et al. Patterns of transfer for patients with non-ST-segment elevation acute coronary syndrome from community to tertiary care hospitals. Am Heart J. 2008;156(1):185–92.
30. Lodwick DL, Cooper JN, Minneci PC, Deans KJ, McLeod D. Factors affecting pediatric patient transfer in testicular torsion. J Surg Res. 2016;203(1):40–6. 31. Li J, Gong L, Gao B, Wang Y, Hu C. An investigation on Residents’awareness
and satisfaction of two-way referral in Cangxi County, Sichuan Province. World Latest Med Inf. 2015;15(68):142–3.
32. Bosk EA, Veinot T, Iwashyna TJ. Which patiens, and where: a qualitative study of patient transfers from community hospitals. Med Care. 2011;49(6): 592–8.
33. Gomez D, Haas B, Mestral CD, Sharma S, Nathens AB. Institutional and provider factors impeding access to trauma center care: an analysis of transfer practices in a regional trauma system. J Trauma Acute Care Surg. 2012;73(5):1288–93.
34. National Bureau of Statistics of China. China statistical yearbook 2016. Beijing: China Statistics Press; 2016.
35. Australian Institute of Health and Welfare. Australia hospital statistics 2012– 13. Canberra; 2014.http://www.aihw.gov.au/publication-detail/?id= 60129546922. Accessed May 2016.
36. Hanmer J, Lu X, Rosenthal GE, Cram P. Insurance status and the transfer of hospitalized patients: an observational study. Ann Intern Med. 2014;160(2):81–90. 37. Zhu H, Zan X, Lin Q. How to make health insurance assisting the establishment