T E C H N I C A L N O T E
Open Access
Performance of a simple chromatin-rich
segmentation algorithm in quantifying basal cell
carcinoma from histology images
Kyle Lesack
1and Christopher Naugler
2*Abstract
Background:The use of digital imaging and algorithm-assisted identification of regions of interest is revolutionizing the practice of anatomic pathology. Currently automated methods for extracting the tumour regions in basal cell carcinomas are lacking. In this manuscript a colour-deconvolution based tumour extraction algorithm is presented.
Findings:Haematoxylin and eosin stained basal cell carcinoma histology slides were digitized and analyzed using the open source image analysis program ImageJ. The pixels belonging to tumours were identified by the
algorithm, and the performance of the algorithm was evaluated by comparing the pixels identified as malignant with a manually determined dataset.
The algorithm achieved superior results with the nodular tumour subtype. Pre-processing using colour deconvolution resulted in a slight decrease in sensitivity, but a significant increase in specificity. The overall sensitivity and specificity of the algorithm was 91.0% and 86.4% respectively, resulting in a positive predictive value of 63.3% and a negative predictive value of 94.2%
Conclusions:The proposed image analysis algorithm demonstrates the feasibility of automatically extracting tumour regions from digitized basal cell carcinoma histology slides. The proposed algorithm may be adaptable to other stain combinations and tumour types.
Background
The interpretation of digital histology images by pathol-ogists (so called ‘tele-pathology’) is revolutionizing the practice of anatomic pathology [1,2]. A natural exten-sion of this use of digital images in histology interpreta-tion is the addiinterpreta-tion of digital analysis tools to aid in diagnosis or the completion of time-consuming tasks. A prime example of the success of this approach is the uti-lization of algorithm-assisted identification of abnormal cells in cytology preparations [3].
In terms of histology, a number of studies have recently looked at image classification algorithms. One recent use of automated image analysis and processing has been as a part of algorithms used to classify breast
cancer tissue. Using a supervised learning method, Petu-shi et al. developed an algorithm capable of classifying breast cancer carcinomas based on histological tissue micro-texture and spatial position [4]. Using the com-mercial software packages Matlab, and LNKnet, the algorithm classified the micro-tissue types as nuclear, extra-cellular, or adipose. The algorithm further classi-fied the nucleus into three separate types, each repre-senting a different nuclear morphology. Similarly, an algorithm developed by Karaçali and Tözeren was used to classify breast tissue images based upon tissue texture and spatial distribution [5]. This algorithm was used to classify the tissue images based on the quantity of chro-matin and collagen, in addition to a measure of the tis-sue’s spatial heterogeneity. Another breast cancer image analysis algorithm was developed by Hall et al. [6]. This algorithm was developed to assess human epidermal growth factor receptor 2 (HER2) expression in breast cancer tissue. The team used the open source image
* Correspondence: [email protected]
2Department of Pathology and Laboratory Medicine, University of Calgary and Calgary Laboratory Services, C414, Diagnostic and Scientific Centre 9, 3535 Research Road NW, Calgary, AB T2L 2 K8, Canada
Full list of author information is available at the end of the article
processing software ImageJ to separate the diaminoben-zidine and haematoxylin stains from each other. This was followed by the extraction of the membrane regions from the digitized breast cancer slides. The HER2 score generated using this method was based upon the extracted membrane pixels. Other automated image analyses include oral epithelial dysplasia and squamous cell carcinoma [7], and melanoma [8-11]. However, the application of these pattern recognition algorithms involves complex programming and may serve to assist only in narrow scopes of diagnostic practice.
The aim of our study is to define the operational char-acteristics (sensitivity and specificity) of a simple colour-based segmentation algorithm for quantifying basal cell carcinoma from photomicrographs. The basis of this algorithm is the observation from anatomic pathology practice that cells with dense chromatin (including many cancer cells) have a different colour spectrum than surrounding normal tissues. Our hypothesis was that the operational characteristics would differ among common basal cell carcinoma subtypes (superficial, nod-ular and infiltrative) with the subtypes exhibiting more compact chromatin (superficial and nodular) demon-strating better operational characteristics than the infil-trative subtypes.
Basal cell carcinoma was chosen to examine this ques-tion as this cancer presents with a well-defined range of histological subtypes and occurs in association with non-neoplastic chromatin-rich cells present in the epi-dermis and epi-dermis. Finally, because basal cell carcino-mas are the most common malignant neoplasm in humans [12], access to clinical material was not a limit-ing factor. Although basal cell carcinomas are highly curable by surgical intervention, their sheer number (over one million new cases per year in the United States [13]) translates into a heavy burden for health care systems. The only previous study that explored the automated analysis of BCCs was performed by Gutierez et al. [14]. By modelling the visual recognition process, the algorithm used a supervised learning approach to identify regions of interest (ROI). The ROIs identified by the algorithm were found to coincide highly with those selected manually by a pathologist.
Image analysis overview
In order to extract and analyse features of a digital image, it is first necessary to identify and separate the ROIs. Image segmentation involves dividing an image into regions of similar characteristics based on features such as brightness or morphology [15]. Ideally the fore-ground of the resulting image contains the desired regions. A simple technique for image segmentation involves segmenting grayscale images based on their pixel intensities [16]. By filtering out pixels above or
below a certain threshold value, grayscale images may be segmented into regions of similar brightness. The resulting segmentation can be stored as a new image containing only the black and white values that corre-spond to the foreground/background regions. More complex thresholding methods are also available. These include the use of multiple thresholds, as well as adap-tive thresholding, where the local threshold values are determined according to their neighbouring regions [17]. Further segmentation methods also exist, including seed growing, and boundary based techniques [18]. Prior to feature extraction and analysis, further proces-sing may be required once the image has been segmen-ted. For example, disconnected regions of images may be filled in using morphological operations. This may be accomplished by performing a binary closing operation. Another common operation is noise reduction, fre-quently achieved by applying mean or median filters [19].
The slides evaluated with this algorithm were stained with haematoxylin and eosin (H&E). Although H&E stains are easily distinguished visually by colour, digitally separating regions containing stain co-localisation is dif-ficult. Separation via colour deconvolution provides a means of separating stains with overlapping regions. The basis of this method is to separate the component stains by performing an ortho-normal transformation of the image’s RGB information [20]. Several recent studies have used stain separation by colour deconvolution prior to analyzing cancerous tissue [21-23].
Methods
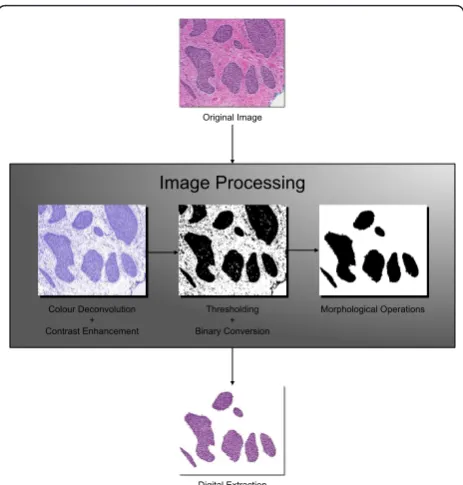
The algorithm used to extract the BCC tumours con-sisted of four steps: pre-processing, segmentation, mor-phological operations, and feature extraction (see Figure 1). A copy of the algorithm used is available as a macro in Additional file 1. The macro also provides the specific parameters used in the algorithm. During pre-proces-sing, colour deconvolution was used to separate the hae-matoxylin stain from each of the images. The resulting image was then segmented based upon pixel intensities. Subsequently, morphological operations were performed to connect the discontinuous regions that resulted from the segmentation process. Finally, area-based particle analysis was used to extract and quantify the ROIs from the image. This analysis allowed the performance of the algorithm to be evaluated.
Case selection/image acquisition
Sections containing BCC were stored using the JPEG for-mat (1072 × 902 pixels).
Software
The open source image processing and analysis program ImageJ was used in this study. First released in 1997 by software developer Wayne Rastban, ImageJ is an open source program based on the National Institutes of Health’s NIH Image. Current features consist of numer-ous image processing and analysis operations, including image segmentation and extraction, noise reduction, image transformations, and particle analysis. These fea-tures are further expanded upon by an active user base. There are currently hundreds of downloadable user plu-gins and macros [24]. Additional benefits of this soft-ware include the support of numerous file formats, and platform independence [25]. As a result of being plat-form independent, ImageJ is capable of running on mul-tiple operating systems, including MS Windows, Apple OS, and Linux. The algorithm described below was used in conjunction with version 1.44 of ImageJ. With the exception of the colour deconvolution plugin, all of the processes performed are available using the default Ima-geJ commands.
Digital image processing and analysis Colour deconvolution
The colour deconvolution plugin by Gabriel Landini [26] was used to separate the BCC images into separate images containing the haematoxylin and eosin stain
components using the built-in H&E vector. The plugin creates an additional image corresponding to the com-plement of the haematoxylin and eosin stains. Because the chromatin-rich basophilic (nuclear) regions were of interest, only the 8-bit Haematoxylin images were retained. The colour deconvolution process was fol-lowed by contrast enhancement in order to facilitate the segmentation process.
Segmentation
Thresholding was then used to segment the pixels dar-ker than the threshold value. The ImageJ isodata algo-rithm [27] was used along with the automatic thresholding option. This algorithm This process resulted in a binary file containing only black and white pixels, where the black pixels corresponded to the regions above the threshold value.
Morphological operations
Due to the lack of intense haematoxylin staining in the non-basaloid cell regions, the binary images produced during the segmentation process frequently contained holes and disconnected regions in the tumour nests. As a result, morphological operations were performed on the segmented images. Hole filling was achieved using a combination of median filtering and binary closing operations. Initially a median filter was applied to the
bright outliers using the ImageJRemove Outliers
com-mand. This was followed by a binary closing operation, and median filtering of the dark outliers.
Feature extraction
As other baseloid and chromatin-rich features (e.g. sin-gle lymphocytes, hematoxylin stain precipitates, micro-calcifications, etc.) could produce false positive results, we attempted to remove these features through a filter-ing step usfilter-ing the ImageJ particle analyzer feature. A minimum particle size of 750 pixels was used in order to exclude non-tumour nest particles. The extracted tumour was then obtained by removing all particles out-side of the ROIs.
Analysis
The evaluation of a given algorithm is inherently subjec-tive and biased towards the author’s preferences, as standard methods for evaluating the algorithm do not exist [28]. For the purpose of this analysis a manual eva-luation of tumor nests was used as the ground truth dataset.
To accomplish this, one of us (CN) manually evalu-ated printed photomicrographs of the 30 basal cell carci-noma images: 10 each of nodular, infiltrative and superficial subtypes. For each of these images, all tumour nests present were manually delineated with a black marker, scanned and analyzed with a manual approach. The main challenges in evaluating an extrac-tion algorithm are determining the true dataset (ground truth), and the appropriate performance metrics [29,30].
Original Image
Digital Extraction
Image Processing
Thresholding + Binary Conversion Colour Deconvolution
+ Contrast Enhancement
[image:3.595.58.290.87.330.2]Morphological Operations
A further challenge is the lack of standardized image extraction algorithms, seeing that most existing algo-rithms are optimized for a specific task. This causes a further problem for evaluating the algorithm, and the colour deconvolution approach in particular. In order to assess the effect of using colour deconvolution, the same set of histology slides were analyzed using grayscale based thresholding in place of the colour deconvolution step. In the comparison algorithm, the image was first converted to an 8-bit grayscale image, and the colour deconvolution step was omitted. The remaining steps were carried out as described by the proposed algorithm.
The binary images of the algorithmically extracted tumour nests were subtracted from the binary images obtained by manual evaluation. The resulting image, containing the areas of the image not extracted by the algorithm, was considered to contain only false negative (FN) pixels. Similarly, the binary images of the manually extracted tumours were subtracted from the algorithmi-cally extracted ones. The resulting image quantified the pixels considered to be false positives (FP). In addition, the number of true pixels (TP) was calculated by sub-tracting the total number of pixels identified by the algorithm from those deemed to be false positives. Finally, the number of true negative (TN) pixels was cal-culated by subtracting the total number of pixels in the image by the number of pixels identified by the algo-rithm, and by the number of false negatives.
Four different metrics were calculated to assess the performance of the algorithm. The sensitivity of the test evaluates the capability of the algorithm to identify pix-els belonging to the tumour nests. The sensitivity was calculated as follows:
Sensitivity(SE) = TP
TP + FN· 100%
The specificity of the test evaluates the capability of the algorithm to correctly identify the pixels not belong-ing to the tumour nests. The specificity was calculated as follows:
Sensitivity(SP) = TN
TN + FP · 100%
The proportion of the histology slide occupied by the BCC may vary significantly between different slides. In general, superficial tumours occupy a smaller fraction of the slide compared to the nodular and infiltrative sub-types. For this reason the positive and negative predic-tive values were calculated. The posipredic-tive predicpredic-tive value (PPV) of the test indicates the probability that a posi-tively identified pixel belongs to an actual tumour. As a result, images containing a lower tumour to non-tumour
ratio result in lower PPVs. Conversely, the negative pre-dictive value (NPV) is an indication of the probability of a negatively identified pixel actually belonging to non-tumour tissue. The PPV and NPV were calculated as follows:
Positive Predictive Value (PPV) = TP
TP + FP · 100%
Negative Predictive Value (NPV) = TN
TN + FN · 100%
Results
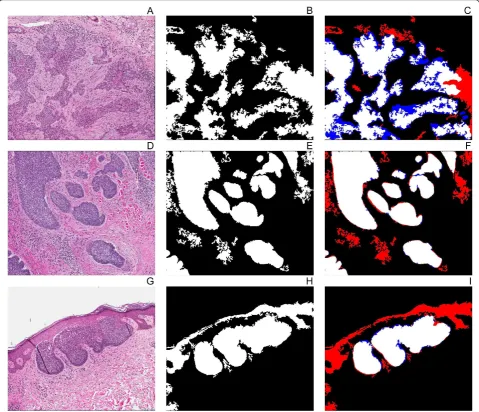
The metrics shown in Table 1 quantify the performance of the algorithm. Overall, the mean sensitivity and speci-ficity of the 30 test images was 91.0% and 86.4% respec-tively. Furthermore, the mean PPV and NPV of the test images was 63.3% and 94.2%. The algorithm perfor-mance depended significantly on the tumour subtype. We hypothesized that the algorithm would perform best on the superficial and nodular basal cell carcinoma sub-types, as these appear to be subjectively more“baseloid” than the infiltrative subtype. This was only partly sup-ported by the data. The superficial subtype had the highest sensitivity (98.1%), but also the lowest specificity (82.5%). The lower specificity value resulted primarily from the extraction of the normal epidermal basal cell layer, in addition to the tumour nests. Consequently, this also resulted in a lower mean PPV (34.3%) for the superficial subtype. The infiltrative subtype had the low-est sensitivity (78.9%). On the other hand, the algorithm was more specific for the infiltrative subtype (87.2%). The algorithm performed the best with the Nodular subtype. The corresponding sensitivities and specificities were 95.8% and 89.3%, resulting in mean PPV and NPV values of 84.5% and 95.0%. A sample extraction of each subtype is shown in Figure 2.
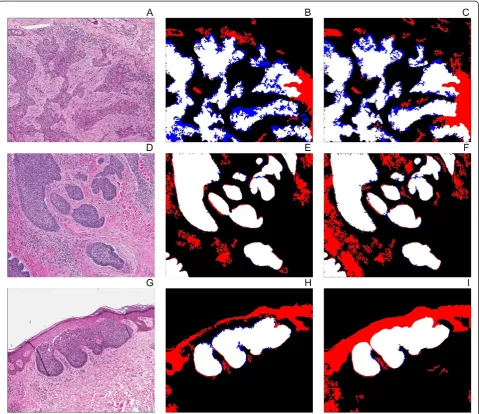
[image:4.595.305.539.615.684.2]Surprisingly, when compared to grayscale based seg-mentation (Table 2), the use of colour deconvolution resulted in a slightly lower mean sensitivity (91.0% with
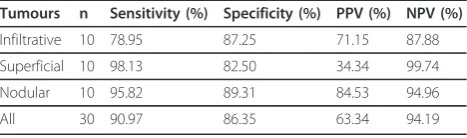
Table 1 Evaluation of the tumour extraction algorithm in BCC histology slides
Tumours n Sensitivity (%) Specificity (%) PPV (%) NPV (%)
Infiltrative 10 78.95 87.25 71.15 87.88
Superficial 10 98.13 82.50 34.34 99.74
Nodular 10 95.82 89.31 84.53 94.96
All 30 90.97 86.35 63.34 94.19
colour deconvolution; 91.6% with grayscale based seg-mentation), but increased the mean specificity (86.4% with colour deconvolution; 74.6% with grayscale based segmentation). The use of colour deconvolution prior to
[image:5.595.58.538.90.502.2]segmentation resulted in an improved PPV (63.3% with colour deconvolution; 52.6% with grayscale based seg-mentation) and NPV (94.2% with colour deconvolution; 93.9% with grayscale based segmentation). Sample
Figure 2Application of the tumour extraction algorithm to different basal cell carcinoma subtypes. The algorithm was applied basal cell carcinoma images of the infiltrative (A), nodular (D), and superficial (G) subtypes. The white pixels correspond to the regions identified by the algorithm as tumour nests (B, E, H). The performance of the algorithm was evaluated by identifying pixels containing true positive pixels (white), false negative pixels (blue), and false positive pixels (red) in each image (C, F, I).
Table 2 Evaluation of the tumour extraction algorithm without colour deconvolution in BCC histology slides
Tumours Sensitivity (%) Specificity (%) PPV (%) NPV (%)
Infiltrative 81.25 68.72 53.57 87.87
Superficial 98.46 74.20 27.34 99.78
Nodular 95.11 80.92 76.90 93.92
All 91.61 74.61 52.60 93.86
[image:5.595.56.535.642.709.2]extractions with and without colour deconvolution are shown in Figure 3.
Discussion
This study evaluated a method for digitally extracting the tumour regions from basal cell carcinoma histo-pathology slides. A combination of colour deconvolution and intensity based thresholding was used with the goal of extracting the tumour nests from the image. The algorithm was evaluated with 3 separate subtypes of basal cell carcinomas: infiltrative, nodular, and superfi-cial. For comparison, the algorithm was repeated using
only grayscale based segmentation in place of the colour deconvolution step.
[image:6.595.59.539.253.667.2]The performance of the algorithm varied significantly between the subtypes. The best results were achieved with the nodular subtype, while inferior performance was achieved with the superficial and infiltrative sub-types. One problem encountered with the superficial and infiltrative subtypes was the identification of false positives. This occurred in large part due to the pre-sence of the normal epidermal basal layer in some of the slides which showed similar spectral characteristics to areas of BCC. Because the algorithm uses intensity
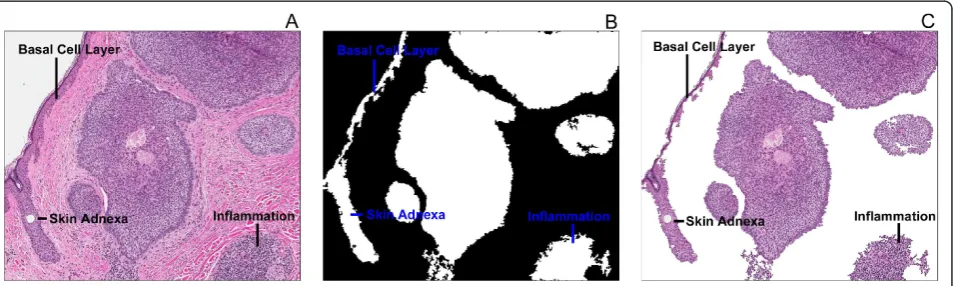
based segmentation following the colour deconvolution step, regions with similar intensities to the tumour cells were also extracted. Lowering the threshold value would decrease the number of false positives, but would also come at the expense of lower sensitivity. Additional false positives occurred due to the presence of other basaloid elements such as skin adnexae, inflammation, and eccrine glands. A further source of false positives occurred due to blue dye used to mark the deep surgical resection margin of some specimens. Example false posi-tives are displayed in Figure 4.
Another challenge for digital feature extraction algo-rithms is false negatives. In this study, false negatives resulted mainly from two causes: poor contrast between the tumour nest and its surrounding tissue, as well as inadequate hole filling. Although contrast enhancement was performed, some of the images still contained poor contrast between the tumour and its adjacent tissue. This may have been due in part to variation in the intensities of H&E staining of the original sections. One possible approach to this would be to explore the deli-neation of the tumour based on morphological features, rather than pixel intensities. One possibility would be to use the active contours method in order to evolve a curve representing the boundaries from the ROI [31]. Recently, this method has been explored in order to seg-ment histology images [32-34]. One potential drawback when using active contours is that some implementa-tions require the user to manually specify an initial boundary. Another possible approach would be to use region growing based segmentation [35]. This method works by adding pixels that surround, and are similar to a given seed pixel. The process is then repeated for each added pixel [18]. Similar to the active contours method, many region growing algorithms are not fully auto-mated, as the given implementation may require the
user’s input to specify the seed for the algorithm.
However, as we stated in the introduction, our intent was to examine the performance of a simple chromatin-rich segmentation algorithm and so these more complex approaches were not evaluated in the current study.
Similar to the false positives, the rate of false negatives could be decreased by changing the threshold value. Conversely, lower false negative rates could be achieved at the expense of specificity. Example false negatives are shown in Figure 5.
Superior results were achieved by using a colour decon-volution prior to segmentation. Although using colour deconvolution resulted in a slightly lower mean sensitivity, a significant improvement in specificity was gained. This resulted in superior PPV and NPV values. In general, the colour deconvolution decreased the incidence of false positives. This was likely a result of the stain separation achieved using the colour deconvolution plugin.
Overall, however, the sensitivities of the colour-based approach were not better than a grayscale-based thresh-olding approach.
Conclusions
[image:7.595.62.539.552.695.2]This study reports the operational characteristics of a simple colour-based segmentation algorithm using the open-source image analysis program ImageJ. As pre-dicted, the algorithm generally performed best with examples of the nodular basal cell carcinoma subtype. The specificity was unexpectedly low for the superficial basal cell carcinoma examples due to false positive clas-sification of pixels associated with skin adnexae and the normal basal cell carcinoma of the epidermis. However, overall, the finding that the sensitivity of this colour-based approach was not better than a grayscale thresh-olding approach to the same images suggests that simple colour-based algorithms without the inclusion of more sophisticated texture feature segmentation may have limited utility.
Availability of supporting data
The ImageJ algorithm we used is available as an Addi-tional file to this manuscript.
Additional material
Additional file 1: ImageJ Algorithm.
Acknowledgements
KL was supported by an O’Brien summer studentship from the University of Calgary and a research grant to CN from the University of Calgary.
Author details
1Room G503, O’Brien Centre for the BHSc, 3330 Hospital Drive N.W., Calgary, Alberta T2N 4N1, Canada.2Department of Pathology and Laboratory Medicine, University of Calgary and Calgary Laboratory Services, C414, Diagnostic and Scientific Centre 9, 3535 Research Road NW, Calgary, AB T2L 2 K8, Canada.
Authors’contributions
CN devised the original study design. KL designed the algorithm and evaluated the algorithm performance. Both authors participated in drafting the manuscript. Both authors have read and approved the final manuscript.
Competing interests
The authors declare that they have no competing interests.
Received: 7 November 2011 Accepted: 17 January 2012 Published: 17 January 2012
References
1. Pantanowitz L:Digital images and the future of digital pathology.J Pathol Infor2010,1:15.
2. Gabril MY, Yousef GM:Informatics for practicing anatomical pathologists: marking a new era in pathology practice.Mod Pathol2010,23:349-358. 3. Dawson AE:Can we change the way we screen?: the ThinPrep Imaging
System.Cancer2004,102:340-4.
4. Petushi S, Garcia FU, Haber MM, Katsinis C, Tozeren A:Large-scale computations on histology images reveal grade-differentiating parameters for breast cancer.BMC Med Imaging2006,6:14. 5. Karaçali B, Tözeren A:Automated detection of regions of interest for
tissue microarray experiments: an image texture analysis.BMC Med Imaging2007,7:2.
6. Hall BH, Ianosi-Irimie M, Javidian P, Chen W, Ganesan S, Foran DJ: Computer-assisted assessment of the human epidermal growth factor
receptor 2 immunohistochemical assay in imaged histologic sections using a membrane isolation algorithm and quantitative analysis of positive controls.BMC Med Imaging2008,8:11.
7. Safadi RA, Musleh AS, Al-Khateeb TH, Al-Hadi Hamasha A:Analysis of immunohistochemical expression of k19 in oral epithelial dysplasia and oral squamous cell carcinoma using color deconvolution-image analysis method.Head and neck Pathol2010,4:282-9.
8. LeAnder R, Chindam P, Das M, Umbaugh SE:Differentiation of melanoma from benign mimics using the relative-color method.Ski Res Technol 2010,16:297-304.
9. Iyatomi H, Oka H, Celebi ME, Hashimoto M, Hagiwara M, Tanaka M, Ogawa K:An improved Internet-based melanoma screening system with dermatologist-like tumor area extraction algorithm.Comput Med Imaging and Graphics2008,32:566-79.
10. Abbas Q, Celebi ME, García IF:Skin tumor area extraction using an improved dynamic programming approach.Skin Res Technol2011, 11:1-10.
11. Silveira M, Nascimento JC, Marques JS, Marcal ARS, Mendonca T,
Yamauchi S, Maeda J, Rozeira J:Comparison of segmentation methods for melanoma diagnosis in dermoscopy images.IEEE J Sel Topics in Signal Process2009,3:35-45.
12. Miller SJ:Biology of basal cell carcinoma (part I).J Am Acad Dermatol 1991,24:1-13.
13. Miller DL, Weinstock MA:Nonmelanoma skin cancer in the United States: Incidence.J Am Acad Dermatol1994,30:774-778.
14. Gutiérrez R, Gómez F, Roa-Peña L, Romero E:A supervised visual model for finding regions of interest in basal cell carcinoma images.Diagn Pathol2011,6:26.
15. Dougherty G:Image segmentation.Digital Image Process Med Appl.1 edition. Cambridge: Cambridge University Press; 2009, 309-312.
16. Russ JC:Segmentation and thresholding.The Image Processing Handbook. 4 edition. Boca Raton: CRC Press; 2002, 333-335.
17. Dougherty G:Image segmentation.Digital Image Processing for Medical Applications.1 edition. Cambridge: Cambridge University Press; 2009, 317-321.
18. Dougherty G:Image segmentation.Digital Image Processing for Medical Applications.1 edition. Cambridge: Cambridge University Press; 2009, 321-326.
19. Dougherty G:Image restoration.Digital Image Processing for Medical Applications.1 edition. Cambridge: Cambridge University Press; 2009, 52-253.
20. Ruifrok AC, Johnston DA:Quantification of histochemical staining by color deconvolution.Anal Quant Cytol Histol2001,23:291-299.
21. Konsti J, Lundin M, Joensuu H, Lehtimäki T, Sihto H, Holli K, Turpeenniemi-Hujanen T, Kataja V, Sailas L, Isola J, Lundin J:Development and evaluation of a virtual microscopy application for automated assessment of Ki-67 expression in breast cancer.BMC Clin Pathol2011,11:3.
[image:8.595.56.539.89.224.2]22. Shah M, Bhoumik A, Goel V, Dewing A, Breitwieser W, Kluger H, Krajewski S, Krajewska M, DeHart J, Lau E, Kallenberg DM, Jeong H, Eroshkin A, Bennett DC, Chin L, Bosenberg M, Jones N, Ronai ZA:A Role for ATF2 in
Regulating MITF and Melanoma Development.PLoS Genet2010,6: e1001258.
23. Wang CW:Robust automated tumour segmentation on histological and immunohistochemical tissue images.PLoS One2011,6:e15818. 24. Collins T:ImageJ for Microsc BioTech2007,43:S25-S30.
25. Abràmoff MD, Magalhaes P, Ram S:Image processing with ImageJ. Biophotonics Int2004,11:36-43.
26. Landini G:Colour deconvolution plugin v 1.5.[http://www.dentistry.bham. ac.uk/landinig/software/cdeconv/cdeconv.html].
27. The ImageJ information and documentation portal.[http://imagejdocu. tudor.lu/doku.php?id=faq:technical:
what_is_the_algorithm_used_in_automatic_thresholding].
28. Zhang H, Fritts J, Goldman S:Image segmentation evaluation: A survey of unsupervised methods.Comput Vision and Image Understanding2008, 110:260-280.
29. Cardoso JS, Corte-Real L:Toward a generic evaluation of image segmentation.IEEE Trans Image Process2005,14:1773-82. 30. Udupa JK, Leblanc VR, Zhuge Y, Imielinska C, Schmidt H, Currie LM,
Hirsch BE, Woodburn J:A framework for evaluating image segmentation algorithms.Comput Med Imaging and Graphics2006,30:75-87.
31. Kass M, Witkin A, Terzopoulos D:Snakes: Active contour models.Int J Comput Vis1988,1:321-331.
32. Xu J, Janowczyk A, Chandran S, Madabhushi A:A high-throughput active contour scheme for segmentation of histopathological imagery.Med Image Anal2011,15:851-62.
33. Fatakdawala H, Xu J, Basavanhally A, Bhanot G, Ganesan S, Feldman M, Tomaszewski JE, Madabhushi A:Expectation-maximization-driven geodesic active contour with overlap resolution (EMaGACOR): Application to lymphocyte segmentation on breast cancer histopathology.IEEE Trans Biomed Eng2010,57:1676-89.
34. Hiremath PS, Iranna YH:Fuzzy rule based classification of microscopic images of squamous cell carcinoma of esophagus.Int J Comput Appl 2011,25:30-33.
35. Mat-Isa N, Mashor M, Othman N:Seeded region growing features extraction algorithm; its potential use in improving screening for cervical cancer.Int J Comput Internet and Manage2005,13:61-70.
doi:10.1186/1756-0500-5-35
Cite this article as:Lesack and Naugler:Performance of a simple chromatin-rich segmentation algorithm in quantifying basal cell carcinoma from histology images.BMC Research Notes20125:35.
Submit your next manuscript to BioMed Central and take full advantage of:
• Convenient online submission
• Thorough peer review
• No space constraints or color figure charges
• Immediate publication on acceptance
• Inclusion in PubMed, CAS, Scopus and Google Scholar
• Research which is freely available for redistribution