Open Access
Research article
Technical efficiency of peripheral health units in Pujehun district of
Sierra Leone: a DEA application
Ade Renner
1, Joses M Kirigia*
2, Eyob A Zere
3, Saidou P Barry
2,
Doris G Kirigia
4, Clifford Kamara
5and Lenity HK Muthuri
6Address: 1World Health Organization, Country Office, Freetown, Sierra Leone, 2World Health Organization, Regional Office for Africa, B.P. 06,
Brazzaville, Congo, 3World Health Organization, Country Office, Windhoek, Namibia, 4University of New South Wales, School of Public Health
and community medicine, Australia, 5Department of Planning and Information, Ministry of Health and Sanitation, Freetown, Sierra Leone and 6School of Public Health, Department of Health Sciences, Kenyatta University, Nairobi, Kenya
Email: Ade Renner - [email protected]; Joses M Kirigia* - [email protected]; Eyob A Zere - [email protected]; Saidou P Barry - [email protected]; Doris G Kirigia - [email protected]; Clifford Kamara - [email protected]; Lenity HK Muthuri - [email protected]
* Corresponding author
Abstract
Background: The Data Envelopment Analysis (DEA) method has been fruitfully used in many countries in Asia, Europe and North America to shed light on the efficiency of health facilities and programmes. There is, however, a dearth of such studies in countries in sub-Saharan Africa. Since hospitals and health centres are important instruments in the efforts to scale up pro-poor cost-effective interventions aimed at achieving the United Nations Millennium Development Goals, decision-makers need to ensure that these health facilities provide efficient services. The objective of this study was to measure the technical efficiency (TE) and scale efficiency (SE) of a sample of public peripheral health units (PHUs) in Sierra Leone.
Methods: This study applied the Data Envelopment Analysis approach to investigate the TE and SE among a sample of 37 PHUs in Sierra Leone.
Results: Twenty-two (59%) of the 37 health units analysed were found to be technically inefficient, with an average score of 63% (standard deviation = 18%). On the other hand, 24 (65%) health units were found to be scale inefficient, with an average scale efficiency score of 72% (standard deviation = 17%).
Conclusion: It is concluded that with the existing high levels of pure technical and scale inefficiency, scaling up of interventions to achieve both global and regional targets such as the MDG and Abuja health targets becomes far-fetched. In a country with per capita expenditure on health of about US$7, and with only 30% of its population having access to health services, it is demonstrated that efficiency savings can significantly augment the government's initiatives to cater for the unmet health care needs of the population. Therefore, we strongly recommend that Sierra Leone and all other countries in the Region should institutionalise health facility efficiency monitoring at the Ministry of Health headquarter (MoH/HQ) and at each health district headquarter.
Published: 14 December 2005
BMC Health Services Research 2005, 5:77 doi:10.1186/1472-6963-5-77
Received: 31 May 2005 Accepted: 14 December 2005
This article is available from: http://www.biomedcentral.com/1472-6963/5/77
© 2005 Renner et al; licensee BioMed Central Ltd.
Background
"Public health is the science and art of preventing disease, pro-longing life and promoting health and efficiency through organized community effort." [1]
Located in West Africa, Sierra Leone has a population of 4.6 million and a total fertility rate of 6.5. Its health indi-cators are poor. For example, life expectancy at birth is 34.2 years; the probability of dying (per 1000 live births) before the age of 5 years is 313 and between 15 and 59 years is 619 [2]. The number of maternal deaths per 100000 live births is 2000 [3]. These dismal health indi-cators are a reflection of poor governance [4], poor macr-oeconomic performance [5] and poor national health system performance [6].
The total expenditure on health as a percentage of the gross domestic product (GDP) increased from 2.6% in 1996 to 4.3% in 2000 [2]. General government expendi-ture on health constituted 60% of the total expendiexpendi-ture on health; the remaining 40% came from private households and out-of-pocket spending. The fact that health indica-tors had continued to decline [7] in spite of health expenditure increases could be partly due to an inefficient public health system.
Peripheral health units (PHUs) are a vital part of Sierra Leone's public health system. Given their strategic loca-tion in the midst of communities, they constitute an inval-uable vehicle for 'organizing community effort for the sanitation of the environment, the control of communica-ble infections, the education of the individual in personal hygiene and the organization of medical and nursing serv-ices for the early diagnosis and preventive treatment of disease' [1]. PHUs are instrumental in efforts to scale up
pro-poor package of cost-effective interventions aimed at achieving the U.N. Millennium Development Goals [8,9].
We concur with the father of public health, C.E.A. Wins-low [1], that a part of the mandate of the public health dis-cipline ought to be promotion of efficiency, i.e. to maximize the benefit of health interventions (promotion, prevention and preventive treatment) to communities at large from available resources. Therefore, decision-makers need to ensure that PHUs (and all other branches of the public health system) provide services efficiently.
In Sierra Leone no studies of the efficiency of health facil-ities have been conducted using Data Envelopment Anal-ysis (DEA). This study will therefore be significant in assessing efficiency using more robust techniques and generate information that will be useful for policy, plan-ning and operational management.
The objectives of this study were: (i) to measure the tech-nical and scale efficiency among a sample of public PHUs in Sierra Leone employing the DEA method; and (ii) to demonstrate how its results could be used in the pursuit of the public health objective of promoting efficiency in health facilities.
Methods
Overview of Sierra Leone health care delivery system
The Ministry of Health and Sanitation (MOHS) provides about 50% of health care services. The remainder is pro-vided by the private sector (private-for-profit institutions and traditional healers) and national (e.g. Christian Health Association of Sierra Leone) and international (e.g. German Leprosy Rehabilitation Association and
[image:2.612.55.563.101.284.2]Medecins Sans Frontieres) NGOs [10].
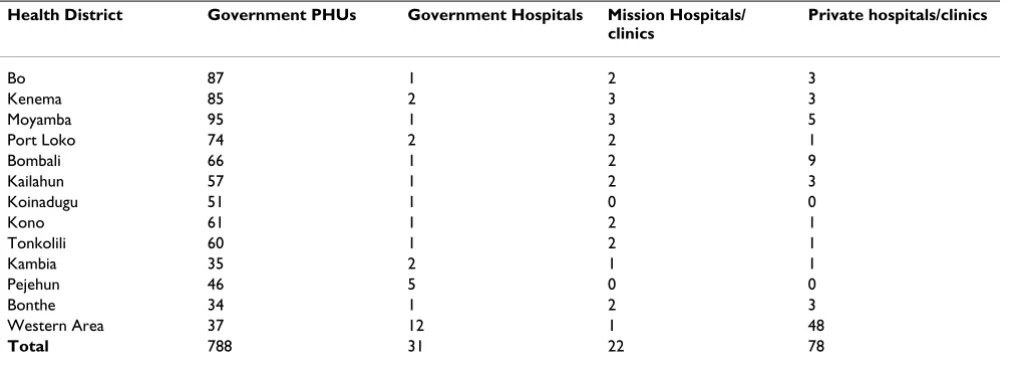
Table 1: Functioning PHUs and hospitals
Health District Government PHUs Government Hospitals Mission Hospitals/ clinics
Private hospitals/clinics
Bo 87 1 2 3
Kenema 85 2 3 3
Moyamba 95 1 3 5
Port Loko 74 2 2 1
Bombali 66 1 2 9
Kailahun 57 1 2 3
Koinadugu 51 1 0 0
Kono 61 1 2 1
Tonkolili 60 1 2 1
Kambia 35 2 1 1
Pejehun 46 5 0 0
Bonthe 34 1 2 3
Western Area 37 12 1 48
Total 788 31 22 78
The country has 13 health districts, each with a District Health Management Team responsible for the implemen-tation, supervision and monitoring of health programmes in the district. Sierra Leone has a total of 31 government hospitals, 22 mission hospitals/clinics, 78 private hospi-tals/clinics and a network of 788 PHUs. As indicated in Table 1, there are geographical inequities in the distribu-tion of health facilities in the country [10].
Table 2 provides estimates of the number and ratio of human resources for health in 2002. Approximately 63% of the health workers were employed by the government and the remaining by NGOs and private-for-profit institu-tions.
Data
Input and output data were analysed for the year 2000. Due to research resource constraints, the planning and information department at the MOHS decided to choose one health district for the study of PHUs. The choice of the study district was done using a simple random sampling technique. This process led to the choice of Pujehun Dis-trict. Even though there are 46 PHUs in Pujehun today, in the year 2000 there were only 39 PHUs. The data were col-lected by Pujehun District Health Team using the primary health care facility efficiency analysis data collection instrument of the WHO Regional Office for Africa [11].
Overview of a public health system
Turnock [12] developed a conceptual framework that ties together the mission and functions of public health to the inputs, processes, outputs and outcomes of the system (see Figure 1). He stated that health systems combine inputs (human, organizational, informational, financial and other resources) to produce outputs (programmes or
services or interventions) intended to ultimately yield health or quality-of-life outcomes. In terms of measurabil-ity, the author posits that many inputs such as human, financial and organizational resources are easily counted or measured. He further explains that outputs (e.g. number of antenatal care visits, number of immuniza-tions provided, number of people who receive health edu-cation and number of condoms distributed) are also generally easy to recognize and count. Following Turnock [12], a public health practice, such as a health centre, employs multiple inputs to produce multiple outputs.
DEA (a non-parametric method) defines efficiency as the ratio of the weighted sum of outputs of a health centre to its weighted sum of inputs [13]. It is particularly useful in public sector organizations (e.g. health facilities) that lack the profit maximization motive and employ a multiple input, multiple output production process. The technical efficiency (TE) of PHUs was found by solving the follow-ing linear programmfollow-ing problem for each health unit in the sample:
Subject to:
Max h u yr rj
r s
0
1 0
= =
∑
v x
u y v x j n
u v
i ij i
m
r rj i ij r
s
r i 0
1
1
1
0 1
0
=
=
∑
∑
∑
=
− ≤ =
≥
, , ,
,
[image:3.612.56.558.101.293.2]…
Table 2: Estimated number and ratio of health personnel in 2002
Categories of Human Resources
Number employed by Government
Number employed by NGOs & Private sector
Total number of human resources
Population per health worker
Doctors 169 131 300 15290 Nurses 406 200 606 7569 Other nursing personnel 1655 1500 3155 1454 Pharmacists 11 - 11 417000 Dispensing technicians 124 - 124 36992 Environmental health
officers
168 36 204 22485 Endemic disease control
assistant
Where:
yrj = amount of output r from health centre j
xij = amount of input i to health centre j
ur = weight given to output r
vi = weight given to input i
n = number of hospitals
s = number of outputs
m = number of inputs
This mathematical programming technique establishes a production possibilities frontier based on relatively effi-cient health centres and measures how far the ineffieffi-cient health centres are from this 'best' practice frontier [14]. The efficient health centres lie on the frontier and are assigned a score of 1 or 100%. Inefficient health centres are allocated a score that is less than 1 (or 100%). The higher the score, the greater the efficiency, and vice versa.
Model specification
The variable returns to scale (VRS) model was estimated to facilitate the estimation of scale efficiency. It assumed that changes in inputs would lead to disproportionate changes in outputs. In other words, a percentage increase in input can yield less than a percentage change in output signifying diseconomies of scale, or more than a percent-age increase of output implying existence of economies of
scale. The scale efficiency (SE) is the ratio of constant returns to scale technical efficiency (TECRS) to variable returns to scale technical efficiency (TEVRS), i.e. SE = (TECRS)/(TEVRS) [15]. All the analysis was undertaken using DEAP, the software developed by Coelli [16].
Output orientation
The output-oriented DEA model was used for the analysis because the management of PHUs had no control over inputs, especially the deployment of human resources. However, given their public health orientation, PHU staff had a duty to induce demand (through health promotion strategies) for preventive health care services such as ante-natal care, family planning services, immunizations, etc. Through their outreach public health work among munities, PHU staff were also supposed to mobilize com-munity efforts and other resources to provide clean water and hygienic human waste disposal facilities, e.g. vented improved pit latrines, especially in rural areas and slums.
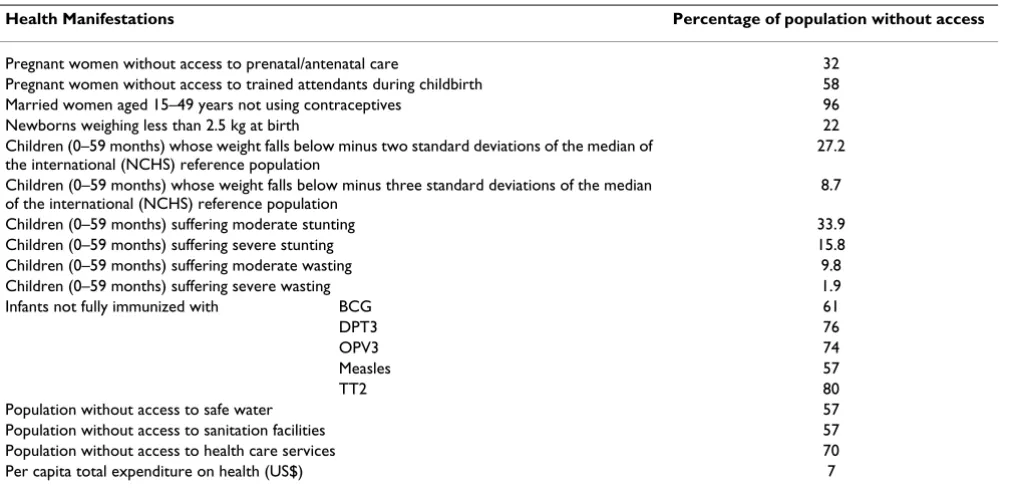
As one can see in Table 3, there is serious population under-coverage of the various interventions in Sierra Leone. This is mainly due to critical resource constraints, e.g. per capita total expenditure on health is only US$7 compared to the US$34 per person recommended by the WHO Commission for Macroeconomics and Health [8]. This implies that although there is a large unmet need for primary health care among communities, severe budget-ary constraints make it difficult to increase inputs, even assuming that PHUs have control over inputs (which they do not have). Even where inputs (e.g. labour) might be under utilized, it is not within their power to dispose of excess inputs. We felt that output maximization is the Relationship between inputs and the production process and resulting outputs
Figure 1
Relationship between inputs and the production process and resulting outputs.
PHU
Services
1. Antenatal + post natal
care
2. Babies delivered
3. Nutrition/growth
monitoring visits
4. Family planning visits
5. Under 5’s immunized
+ pregnant women
immunized
6. Health education
1. Technical staff
(vaccinator, community
health nurse, emergency
and humanitarian officer,
maternal and child health
aide)
2. Sub-ordinate staff
(TBA, porter, watchman)
3. Materials & supplies
4. Capital inputs
most appropriate orientation for health centres which are given a fixed input and requested to produce as much out-put as possible. Thus, an outout-put-oriented approach focused on the amount by which health unit outputs could be expanded with the same level of inputs.
Furthermore, the output- and input-oriented models will estimate exactly the same frontier, and therefore, by defi-nition identify the same set of PHUs (firms) as being effi-cient. It is only the efficiency measures associated with the inefficient firms that may differ between the two methods [16]. In fact under the assumption of constant returns to scale, even the efficiency scores will not change. We, there-fore, feel that the choice of model is not going to affect the results significantly.
DEA inputs and outputs
[image:5.612.56.561.99.345.2]The DEA model was estimated with a total of eight varia-bles: six outputs and two inputs. The six outputs for each individual PHU were: (i) number of antenatal plus post-natal visits; (ii) number of child deliveries; (iii) nutri-tional/child growth monitoring visits; (iv) number of family planning visits; (v) number of children under the age of 5 years immunized plus pregnant women immu-nized with tetanus toxoid (TT); and (vi) total number of health education sessions conducted through home visits, public meetings, school lectures and outpatient depart-ment. PHUs in Sierra Leone did not provide curative care; they were dedicated fully to the provision of health pro-motion and disease prevention services. The two inputs were: (i) technical staff (community health nurse, vacci-nator and maternal and child health aide); and (ii) subor-dinate staff (including traditional birth attendants, porters
Table 3: Manifestations of inaccessibility to basic health services in Sierra Leone
Health Manifestations Percentage of population without access
Pregnant women without access to prenatal/antenatal care 32 Pregnant women without access to trained attendants during childbirth 58 Married women aged 15–49 years not using contraceptives 96 Newborns weighing less than 2.5 kg at birth 22 Children (0–59 months) whose weight falls below minus two standard deviations of the median of
the international (NCHS) reference population
27.2 Children (0–59 months) whose weight falls below minus three standard deviations of the median
of the international (NCHS) reference population
8.7 Children (0–59 months) suffering moderate stunting 33.9 Children (0–59 months) suffering severe stunting 15.8 Children (0–59 months) suffering moderate wasting 9.8 Children (0–59 months) suffering severe wasting 1.9 Infants not fully immunized with BCG 61
DPT3 76
OPV3 74
Measles 57
TT2 80
Population without access to safe water 57 Population without access to sanitation facilities 57 Population without access to health care services 70 Per capita total expenditure on health (US$) 7 Sources: UNICEF [19] and WHO/AFRO [20]
Table 4: Means and standard deviations for public PHUs outputs and inputs
Variables Total Mean Standard deviation Maximum Minimum
Outputs:
Antenatal plus postnatal care visits
25 099 678 749 4080 130 Number of deliveries 4 863 131 99 445 14 Nutrition/growth monitoring visits 29 633 801 1 045 4555 0 Family planning visits 2 958 80 55 252 10 Number of children under the age of 5 years and pregnant women fully
immunized
33 399 903 846 4422 193 Health education sessions 7 458 202 118 434 55
Inputs:Technical staff 78 2 1 5 1
[image:5.612.56.555.589.723.2]and watchmen). The choice of inputs and outputs was guided by the public health conceptual framework and past studies.
Results
Data for two of the sampled PHUs was incomplete, and thus analysis was based on data from 37 health units of Pujehun District. Table 4 presents descriptive statistics for the outputs and inputs of the 37 public PHUs.
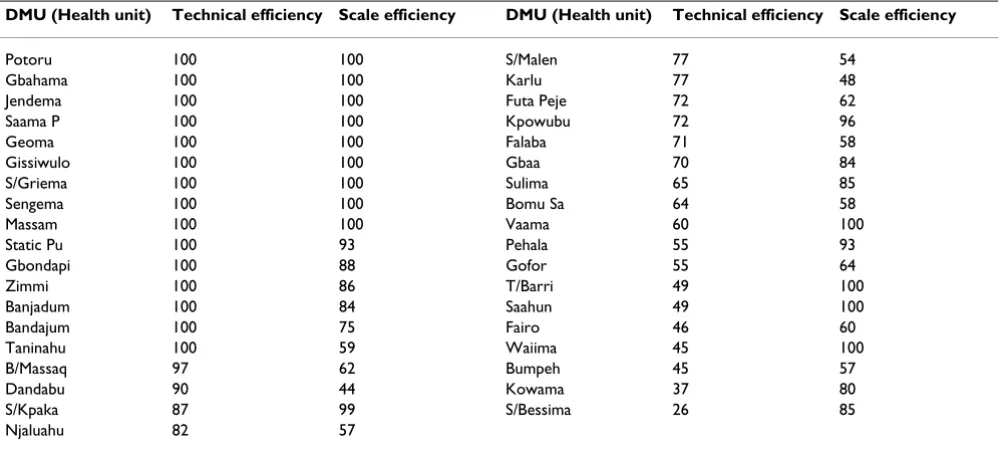
The TE and SE scores for individual PHUs are given in Table 5. Out of the 37 PHUs, 15 (41%) were found to be technically efficient with a TE score of 100%. The remain-ing 22 (59%) were technically inefficient since they had a TE score of less than 100%. Seven (47%) of the inefficient PHUs had a TE score of less than 50%. The overall sample average TE score was 78% (standard deviation (SD) = 23%). This implies that if the inefficient PHUs were to operate as efficiently as their peers on the efficient fron-tier, outputs can be increased by about 22% without changing the quantity of inputs used. The average TE score among the inefficient PHUs was 63% (SD = 18%).
About 65% of the PHUs were found to be scale inefficient, that is, they suffered from inefficiencies emanating from inappropriate size, i.e. being too small or too large. The average SE score for the sampled PHUs was 82%. This implies that if all PHUs had an optimal size, output would have increased by about 22% without increasing the input consumption. The scale inefficient PHUs had an average SE score of 72% (SD = 17%). Thirteen (35%) PHUs manifested constant returns to scale, 21 (57%)
decreasing returns to scale, and 3 (8%) increasing returns to scale.
Discussion
The findings of this study reveal that more than half of the PHUs are operating at less than optimal levels of pure technical and scale efficiency. The performance of some of the PHUs in the sample is actually observed to be very low, and raises much concern for planners and policy-makers. With the existing levels of inefficiency, the achievement of the health policy objectives and health-related global and regional targets such as the Millennium Development Goals (MDGs) and Abuja targets will be compromised. Hence, greater focus should be placed on efficient use of the existing resources.
The results obtained in Sierra Leone were similar to those obtained from the efficiency analysis of Kenyan health centres [17]. A study found 56% health centres in Kenya to be technically inefficient, with an average TE score of 65%. The average scale efficiency score among inefficient PHUs was 72% in Sierra Leone and 70% in Kenya. Sev-enty per cent of primary health care clinics in Kwazulu-Natal province in South Africa were found to be techni-cally inefficient and 84% scale inefficient [18].
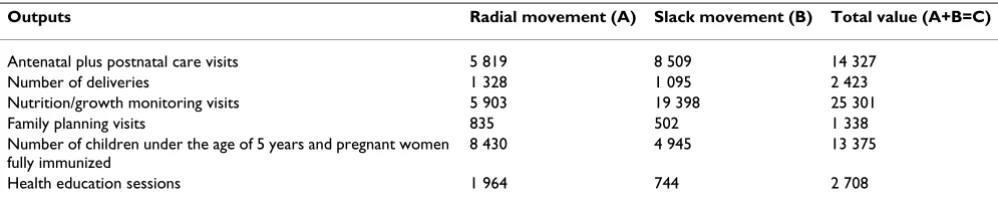
Table 6 shows the total output increases needed to make inefficient public PHUs efficient. In order to become effi-cient, the 22 inefficient PHUs combined would need to increase their current output levels by 57% more antena-tal and postnaantena-tal care visits, 50% more deliveries, 85% more nutrition/growth monitoring visits, 45% more
fam-Table 5: Technical and scale efficiency scores for public PHUs
DMU (Health unit) Technical efficiency Scale efficiency DMU (Health unit) Technical efficiency Scale efficiency
[image:6.612.56.560.101.327.2]ily planning visits, 40% more children and pregnant women who are fully immunized and 36% more health education sessions. This potential of providing more pre-ventive health services to those currently without access, at no extra cost, would be of great public health impor-tance in a poor country like Sierra Leone where large num-bers of women do not have access to contraceptives, antenatal care and trained attendants during childbirth; where a large percentage of children are underweight, stunted and wasted; and where a large proportion of chil-dren do not have access to the Expanded Programme on Immunization (EPI) that targets diphtheria, tetanus, whooping cough, polio, tuberculosis and measles (Table 3). Also, over 50% of the population in the country does not have access to safe water, sanitation facilities and health care services. Thus, it is irrational, immoral and unethical to deny needy people access to essential health services through inefficiencies.
The predominant form of scale inefficiency is decreasing returns to scale, which is also known as diseconomies of scale. A PHU operating at decreasing returns to scale has an inefficiently large size. A percentage increase in all inputs is followed by less than a percentage change in out-puts. To improve the efficiency of the inefficiently large PHUs, there is a need to have more health units of a rela-tively smaller size.
Judging from the various statements contained in the national health policy and plan, and the health sector reforms that the Ministry of Health has been implement-ing; there is clearly a willingness to optimise the use of the scarce health resources.
While the scope for staff reduction in Pujehun District of Sierra Leone was almost non-existent as revealed by this study, there was certainly scope for providing essential public PHUs to a significantly larger number of people than the health units were actually providing. This could be achieved through a conscious pursuit of health promo-tion strategies [21] to create or induce demand for essen-tial preventive public health services that were being
under-utilized. Examples of such demand-inducing strat-egies might include:
(i) Health information: Improve people's ability to access health information to increase their capacity to make informed choices concerning their health-related behav-iours, e.g. availing at community level information on the benefits of antenatal care, family planning, use of con-doms to prevent HIV infection or transmission, immuni-zation, safe water, hygienic sanitation facilities, abstinence from use of addictive substances (e.g. tobacco, alcohol and illicit drugs), physical activity and healthy diet. This strategy was important for primary prevention, which aimed at keeping a disease from ever developing or a trauma from ever occurring [22].
(ii) Health education: Communicating information con-cerning the underlying social, economic and environmen-tal conditions impacting on health as well as individual risk factors and risk behaviours and use of the health sys-tem. In addition, health education was meant to foster motivation, skills and confidence among communities to take action to improve their health [21].
(iii) Screening and individual risk assessment: Identifying and assisting individuals at special risk to seek secondary prevention, which involve early detection and early inter-vention against disease before it developed fully, e.g. cer-vical cancer screening (pap smears) to identify pre-malignant cell changes [22], screening for intestinal nem-atode infections, ascariasis, trichuriasis, hookworm disease or tropical diseases (e.g. trypanosomiasis, schistosomia-sis, lymphatic filariasis and onchocerciasis).
[image:7.612.55.554.100.202.2](iv) Social marketing: Attempting to influence communi-ties living in the vicinity of health units on how to think and behave (with respect to utilization of preventive health services) by using marketing techniques [21]. The object of social marketing would be to cultivate positive attitudes, values and behaviours towards participation in disease prevention services.
Table 6: Total output increases needed to make inefficient public PHUs efficient
Outputs Radial movement (A) Slack movement (B) Total value (A+B=C)
Antenatal plus postnatal care visits 5 819 8 509 14 327 Number of deliveries 1 328 1 095 2 423 Nutrition/growth monitoring visits 5 903 19 398 25 301 Family planning visits 835 502 1 338 Number of children under the age of 5 years and pregnant women
fully immunized
The findings indicate that the amount of outputs could be increased tremendously without increasing the quantity of inputs used. As can be seen from Table 6, each of the outputs exhibits a tremendous increase – more than 50% in some cases. This includes both radial and slack move-ments. Radial movements indicate the proportional increase in outputs, that is, an increase without changing the mix of the outputs. The slack movements, which arise because of the sections of the piece-wise linear frontier that run parallel to the axes are also reported in order to give an accurate indication of the technical efficiency of the health centres. It should, however, be noted that sometimes slacks are treated as issues of allocative effi-ciency and therefore the focus is on the radial effieffi-ciency score. Thus, with the potential increase in outputs from the current sample of health centres, it is possible for the health system to significantly increase coverage by the dif-ferent health interventions and contribute to the achieve-ment of the various national and global health targets.
The extent to which the PHUs can increase their outputs depends on whether the health workers contract renewal and remunerations (especially annual increments) are linked to their performance. Currently, the health workers are paid salaries, which are not linked to performance. Efforts to improve health facility efficiency will need to be undertaken in tandem with reforms in health workers terms of employment. Such reforms are contemplated
within the on-going public sector reforms, which are being supported by bilateral and multilateral develop-ment partners.
Limitations of the study
Our study had some limitations. Firstly, in this study we used total number of health education sessions conducted through home visits, public meetings, school lectures and outpatient department as a proxy for health promotion. By so doing we may have underestimated the health pro-motion work that is done by health centre staff within communities, e.g. public health inspection of commercial food outlets, coaching of communities on personal hygiene, advise to communities on the protection of water sources and construction of vented improved pit latrines (in rural areas and shanties), etc.
Secondly, the inputs and outputs data were collected for only one time period; thus, it was not possible to deter-mine whether the health sector reforms had any impact on the efficiency of PHUs. Thirdly, data on drug expendi-ture at many PHUs were missing; as a result we were forced to drop the variable from the analysis, which may result in shifting the frontier because of outlier figures. Fourthly, we did not manage to collect information on input prices, and thus, we could not estimate the alloca-tive efficiency of the PHUs. Fifthly, given that the study were conducted in only one district, it would not be
advis-Table 7: Ranking of WHO African Region countries on the basis of overall health system goal attainment (out of 191 WHO Member States in 2000)
Member State Ranking Member State Rank
[image:8.612.65.552.109.377.2]able to generalize the findings to the whole country. Thus, it is recommended that the study should be replicated in the remaining twelve districts. Lastly, DEA has been criti-cized for attributing any deviation from the estimated frontier to inefficiency since it is deterministic or non-sto-chastic [23,24]. In other words, it does not capture ran-dom noise, e.g. epidemics, civil war and natural and technological disasters.
To increase the relevance of the study for management purposes, it would have been useful to undertake a second stage analysis of the factors influencing inefficiency using a Tobit – censored dependent variable model – regression analysis. However, because of the absence of good quality data on the factors often hypothesized to influence ineffi-ciency it was not possible to undertake the analysis.
Implications for further applications of DEA in sub-Saharan Africa
A national health system performs the functions of stew-ardship (oversight), health financing (revenue collection, pooling of resources and sharing of financial risk, pur-chasing of health services), creating resources/inputs (including human resources for health) for producing health, and providing health services with a view to improving responsiveness to people's non-medical expec-tations, ensuring fair financial contribution to health sys-tems and ultimately improving health (the three being goals of health system) [6].
The World Health Report 2000 ranked the 191 Member States on the basis of their overall health system goal per-formance. Table 7 provides the ranking of the 46 coun-tries in the WHO African Region: 3 councoun-tries were ranked between 83 and 99; 9 countries were ranked between 118 and 147; and the remaining countries were ranked between 151 and 191. The Sierra Leone health system per-formed the worst.
After the publication of these macro-performance results, countries in the Region have been asking what they can do to improve the performance of their health systems, or even performance of their individual hospitals and health centres which absorb over 80% of recurrent and capital/ development budgets of the Ministries of Health. The starting point in addressing the poor health system per-formance, is measuring which decision-making units (ter-tiary hospitals, provincial hospitals, health centres, clinics/health posts, programmes) (DMU) of the present system are operating efficiently. These measurements can help identify: efficient DMUs, whose practise can be emu-lated by the inefficient DMUs; inefficient DMUs, whose performance need to be improved; the inputs that are being wasted and the magnitude of waste; and the output increases needed to make inefficient DMUs efficient. This
kind of evidence would empower health policy makers and managers to develop concrete strategies for boosting efficiency of DMUs. As demonstrated in the current study, DEA is a useful tool/approach for analysing the efficiency of complex DMUs (e.g. hospitals, health centres) that employ multiple inputs to produce multiple outputs, with a view to generating the evidence mentioned above.
Efficiency improvement is a major strategy for mobilizing more domestic resources for the massive expansion in the coverage of health interventions envisaged in the Millen-nium Development Goals. Thus, while striving to mobi-lize more domestic and external resources, it is important to ensure that the available resources are optimally used, i.e. ensure that it is not possible by reallocation of availa-ble resources to make one person's health status better off without making another person's health status worse off (this situation is called by economists Pareto-optimality). If it is possible through reallocation of resources to improve at least one person's health status without reduc-ing health status of another person, then there is waste within the health system, health facility or programme.
Conclusion
DEA has been fruitfully used in many countries in Asia [25,26] and Europe [27-32] and in the United States [33-37] to shed light on the efficiency of health facilities and programmes. The current study adds to this literature. The study has revealed the prevalence of high levels of com-bined pure technical and scale inefficiencies. In a country with very low levels of per capita expenditure on health (US$7) and very limited access to health services, the cur-rent levels of inefficiency would seriously impede the gov-ernment's initiatives to increase the population's access to quality health care services. Furthermore, progress towards the achievement of the cherished health policy objectives, and global and regional health targets would be seriously hampered.
It is therefore recommended that the causes of the ineffi-ciencies be unpacked and necessary efficiency measures be instituted to augment the government's efforts to address the health care access issues in the country. To estimate the level of efficiency savings in the overall health system, it is also advisable to undertake a similar study in all types of health facilities in the country.
In any efficiency analysis studies to be conducted in Sierra Leone in the future, more emphasis should be laid on col-lecting information on the quantities of all the main out-puts and inout-puts (including drugs) and the average or median prices per unit of each input, from all public and private health facilities (health centres and hospitals), to facilitate measurement of total economic efficiencies (i.e. technical plus allocative efficiencies). Furthermore, in order to aid monitoring and evaluation of the effects of different health care reforms [38] on the efficiency of indi-vidual health care facilities over time through the
Malmquist Productivity Index analysis [16,39], it would be necessary to collect data for a year (or more) before the introduction of specific reforms, and for subsequent years. The Malmquist Productivity Index helps to measure explicitly total factor productivity. It decomposes produc-tivity growth into efficiency change and technical change. The former component is considered to be evidence of catching up to the efficiency frontier, while the latter com-ponent is considered to be evidence of innovation [39].
Competing interests
The author(s) declare that they have no competing inter-ests.
Authors' contributions
AR supervised data collection and participated in writing of sections of the manuscript. JMK analysed the data, par-ticipated in developing the conceptual framework, litera-ture review and writing various sections of the manuscript. EZA participated in developing the
concep-tual framework and writing various sections of the manu-script. SB participated in the literature review and writing sections of the manuscript. DGK and LHKM contributed to various sections of the manuscript and wrote aspects of the discussion on health promotion strategies. CK coordi-nated the entire study and wrote the subsections entitled "overview of Sierra Leone health care delivery system" and "data".
Acknowledgements
We owe profound gratitude to the Sierra Leone MoHS for authorizing and facilitating this study. Pujehun District Health Team collected the data. We received commendable editorial support from A Kochar. We are immensely grateful to Dr Robert Rosenman, Dr Antonio Giuffrida and Dr Ken Stein (the three peer reviewers) for their constructive criticism, com-ments and suggestions that helped to improve the quality of our manu-script. We are indebted to Jehovah Shamah for all round support and guidance at all stages of the study. The findings, interpretations and conclu-sions contained in this paper and any remaining errors are entirely those of the authors and should NOT be attributed in any manner to the MoHS, the World Health Organization, the University of New South Wales, the Ken-yatta University or any of the acknowledged. All authors read and approved the final manuscript.
References
1. Winslow CEA: The untilled field of public health. Modern Medi-cine 1920, 2:183-191.
2. World Health Organization: The World Health Report 2002: Reducing Risks, Promoting Healthy Life. Geneva 2002.
3. World Health Organization: The World Health Report 2005: Make every mother and child count. Geneva 2005.
4. UNDP: Human Development Report 2003: Millennium Development Goals: a compact to end human poverty. New York 2003.
5. The World Bank: World Development Report 2003. Washington DC
2003.
6. World Health Organization: The World Health Report 2000 – Improving Performance of Health Systems. Geneva 2000.
7. World Health Organization: The World Health Report 2001 – Mental Health. Geneva 2000.
8. World Health Organization: Macroeconomics and health: Investing in health for economic development. Geneva 2001.
9. United Nations Organization: Millennium Development Goals. New York
2000.
10. World Health Organization Regional Office for Africa: WHO country cooperation strategy: Sierra Leone. Brazzaville 2005.
11. World Health Organization Regional Office for Africa: Primary Health Care Facility Economics Efficiency Analysis Data Collection Instrument. Brazzaville 2001.
12. Turnock BJ: Public health: what it is and how it works Gaithersburg: Aspen Publishers; 1997.
13. Charnes A., Cooper WW, Rhodes E: Measuring the efficiency of decision-making units. European Journal of Operations Research
1978, 2(6):429-444.
14. Hollingsworth B, Parkin D: The efficiency of the delivery of neo-natal care in UK. Journal of Public Health Medicine 2001,
23(1):47-50.
15. Linna M, Nordblad A, Koivu M: Technical and cost efficiency of oral health care provision in Finnish health centers. Social Sci-ence and Medicine 2002, 56:343-353.
16. Coelli TJ: A guide to DEAP Version 2.1: A Data Envelopment Analysis Programme. CEPA Working Paper 96/8, University of New England, Department of Econometrics 1996.
17. Kirigia JM, Emrouznejad A, Sambo LG, Munguti N, Liambila W: Using Data Envelopment Analysis to Measure the Technical Effi-ciency of Public Health Centers in Kenya. Journal of Medical Sys-tems 2004, 28(2):155-166.
Publish with BioMed Central and every scientist can read your work free of charge
"BioMed Central will be the most significant development for disseminating the results of biomedical researc h in our lifetime."
Sir Paul Nurse, Cancer Research UK
Your research papers will be:
available free of charge to the entire biomedical community
peer reviewed and published immediately upon acceptance
cited in PubMed and archived on PubMed Central
yours — you keep the copyright
Submit your manuscript here:
http://www.biomedcentral.com/info/publishing_adv.asp
BioMedcentral
19. UNICEF [http://http:/www.childinfo.org/]
20. World Health Organization Regional Office for Africa: Basic Indica-tors 2002: Health situation in the WHO African Region. Braz-zaville 2002.
21. Egger G, Spark R, Lawson J: Health promotion strategies and methods
Sydney: McGraw-Hill Book Company.
22. Jenkins CD: Building better health: a handbook of behavioural change
Washington DC: Pan African Health Organization; 2003.
23. Lovell CAK: Production frontiers and productive efficiency, The measure-ment of productivity efficiency: techniques and application Edited by: Fried HO, Lovell CAK, Schimdt SS. New York: Oxford University Press; 1993.
24. Zere EA, Addison T, McIntyre D: Hospital efficiency in sub-Saha-ran Africa: Evidence from South Africa. South African Journal of Economics 2000, 69(2):336-358.
25. Chang H: Determinants of hospital efficiency: the case of cen-tral government-owned hospitals in Taiwan. Omega Interna-tional Journal of Management Science 1998, 26(2):307-317.
26. Wan TTH, Hsu N, Feng R, Ma A, Pan S, Chou M: Technical effi-ciency of Nursing Units in a tertiary care hospital in Taiwan. Journal of Medical Systems 2002, 26(1):21-27.
27. Salinas-Jimenez J, Smith P: Data envelopment analysis applied to quality in primary health care. Annals of Operational Research
1996, 67:141-161.
28. Giuffrida A, Gravelle H: Measuring performance in primary care: econometric analysis and DEA. Applied Economics 2001,
33:163-175.
29. Zavras AI, Tsakos G, Economou C, Kyriopoulos J: Using DEA to evaluate efficiency and formulate policy within a Greek national primary health care network. Journal of Medical Systems
2002, 26(4):285-292.
30. Ersoy K, Kavuncubasi S, Ozcan YA, Harris JM II: Technical efficien-cies of Turkish hospitals: DEA Approach. Journal of Medical Sys-tems 1997, 21(2):67-74.
31. Jacobs R: Alternative methods to examine hospital efficiency: data envelopment analysis and stochastic frontier analysis. Health Care Management Science 2001, 4:103-115.
32. Johnston K, Gerard K: Assessing efficiency in the UK breast screening programme: does size of screening unit make a difference? Health Policy56:21-32.
33. Chattopadhy S, Ray CS: Technical, Scale, and Size efficiency in Nursing home care: a nonparametric analysis of Connecticut homes. Health Economics 1996, 5:363-373.
34. Shroff HFE, Gulledge TR, Haynes KE, Oneill MK: Siting efficiency of long-term health care facilities. Socio-Economic planning Science
1998, 32(1):25-43.
35. White KR, Fache RN, Ozcan YA: Church ownership and hospital efficiency. Hospital and Health Services Administration 1996,
41(3):297-310.
36. Harris J, Ozgen H, Ozcan YA: Do mergers enhance the perform-ance of hospital efficiency? Journal of the Operational Research Soci-ety 2000, 51:801-811.
37. Pai C-W, Ozcan YA, Jiang HJ: Regional variation in physician practice pattern: an examination of technical and cost-effi-ciency for treating sinusitis. Journal of Medical Systems 2000,
24(2):103-117.
38. Lambo E, Sambo LG: Health sector reform in sub-Saharan Africa: a synthesis of country experiences. East African Medical Journal 2003, 80(6):S1-S20.
39. Fare R, Grosskopf S, Norris M, Zhang Z: Productivity, technical progress, and efficiency change in industrialized countries. American Economic Review84(1):66-83.
Pre-publication history
The pre-publication history for this paper can be accessed here: