Open Access
Short Report
Parallel changes in gene expression in peripheral blood
mononuclear cells and the brain after maternal separation in the
mouse
Johan H van Heerden
1, Ana Conesa
2, Dan J Stein
3, David Montaner
2,
Vivienne Russell
4and Nicola Illing*
1Address: 1Department of Molecular and Cell Biology, University of Cape Town, Rondebosch, 7701. South Africa, 2Bioinformatics Department, Centro de Investigación Principe Felipe, Valencia, Spain, 3Department of Psychiatry, University of Cape Town, Rondebosch, 7701, South Africa and 4Department of Human Biology, University of Cape Town, Rondebosch, 7701, South Africa
Email: Johan H van Heerden - [email protected]; Ana Conesa - [email protected]; Dan J Stein - [email protected]; David Montaner - [email protected]; Vivienne Russell - [email protected]; Nicola Illing* - [email protected] * Corresponding author
Abstract
Background: The functional integration of the neuro-, endocrine- and immune-systems suggests that the transcriptome of white blood cells may reflect neuropsychiatric states, and be used as a non-invasive diagnostic indicator. We used a mouse maternal separation model, a paradigm of early adversity, to test the hypothesis that transcriptional changes in peripheral blood mononuclear cells (PBMCs) are paralleled by specific gene expression changes in prefrontal cortex (PFC), hippocampus (Hic) and hypothalamus (Hyp). Furthermore, we evaluated whether gene expression profiles of PBMCs could be used to predict the separation status of individual animals.
Findings: Microarray gene expression profiles of all three brain regions provided substantial evidence of stress-related neural differences between maternally separated and control animals. For example, changes in expression of genes involved in the glutamatergic and GABAergic systems were identified in the PFC and Hic, supporting a stress-related hyperglutamatergic state within the separated group. The expression of 50 genes selected from the PBMC microarray data provided sufficient information to predict treatment classes with 95% accuracy. Importantly, stress-related transcriptome differences in PBMC populations were paralleled by stress-related gene expression changes in CNS target tissues.
Conclusion: These results confirm that the transcriptional profiles of peripheral immune tissues occur in parallel to changes in the brain and contain sufficient information for the efficient diagnostic prediction of stress-related neural states in mice. Future studies will need to evaluate the relevance of the predictor set of 50 genes within clinical settings, specifically within a context of stress-related disorders.
Published: 25 September 2009
BMC Research Notes 2009, 2:195 doi:10.1186/1756-0500-2-195
Received: 3 August 2009 Accepted: 25 September 2009
This article is available from: http://www.biomedcentral.com/1756-0500/2/195
© 2009 Illing et al; licensee BioMed Central Ltd.
Background
The application of microarray techniques has provided insights into the multi-dimensional molecular nature of complex neuropsychiatric disorders. Studies have high-lighted the value of using peripheral tissue targets [1,2], an approach based on the functional integration of neural-, endocrine- and immune-systems [3]. Regulatory exchanges between components of these systems provide a foundation for using peripheral tissue targets as indica-tors of neuropsychiatric states.
One of the earliest demonstrations that gene expression changes in peripheral blood mononucleoctyes (PBMCs) reflected disease states in the brain, was based on a rat model, where acute neural assaults resulted in gene expression changes in PBMCs within 24 hours [4]. Recent studies have focused on human neuropsychiatric disor-ders with more subtle disruptions in neurophysiology. Segman et al [1] were able to predict the onset and pro-gression of post-traumatic stress disorder (PTSD), in recently traumatised patients. Similarly, Tsuang et al [2] showed that the microarray analysis of peripheral blood samples discriminated between patients clinically diag-nosed with schizophrenia or bipolar disorder and healthy controls. Nevertheless, it remains to be established whether gene expression changes in peripheral tissue tar-gets are paralleled by specific transcriptional alterations in neural tissues [1].
We have used the model of maternal separation, which is known to induce long term alterations in neurophysiol-ogy and stress-related behaviours in adult rodents [5,6] to investigate i) whether parallel changes occur in gene expression in three brain regions (the prefrontal cortex, hippocampus, and hypothalamus) and PBMCs and ii) whether gene expression changes in PBMCs could be used to predict the animal treatment group.
Methods
Animals and treatment
Maternal separation was carried out on C57BL/6 mice as previously described [6] with some modifications. Briefly, MS litters were separated from dams for 3 h a day, starting at 12 h 00 and ending at 15 h 00, from postnatal day (PND) 1 to 14. SH animals underwent brief daily han-dling. All subsequent procedures were carried out using males only, as the consequences of separation are gender specific [6].
Acute restraint stress, sacrifice, blood collection and brain dissections
Mice (NMS = 30, NSH = 30) were subjected to 10 min of acute restraint stress and allowed to recover for 20 min prior to sacrifice. Restraint stress was chosen as a means of acutely activating the Hypothalamic-Pituitary-Adrenal
(HPA) axis (HPAA), which allowed for an assessment of possible differences in plasma corticosterone profiles (van Heerden et al, submitted manuscript). All mice were sac-rificed, by means of cervical dislocation, immediately fol-lowed by decapitation and collection of trunk blood. Neural tissues: the (1) prefrontal cortex (PFC), (2) hip-pocampus (Hic) and (3) hypothalamus (HYP) were immediately dissected and submerged in RNALater®
(Qia-gen Inc., USA).
Microarray processing and data analysis
Fifty-five samples, 15× PFC (8× MS and 7× SH), 10× Hic and 10× Hyp (5× MS and 5× SH, each and 20× PBMC (10× MS and 10× SH) were used for microarray process-ing, with a two-colour common reference design. Samples were matched, so that 10 individuals (5× MS and 5× SH) were completely represented in all tissues. A common ref-erence pool was constructed by combining equal amounts (0.75 μg) of PFC and Hic RNA from both groups. Com-mercial pre-spotted, full mouse genome, microarray slides (OpArray™) were sourced from Operon (Operon Biotech-nologies, Germany). Full details of RNA labelling, micro-array hybridization, image capture and micromicro-array data processing are given in Additional file 1: Supplementary Methods. Microarray data are available in the ArrayEx-press database http://www.ebi.ac.uk/arrayexArrayEx-press under accession number E-MEXP-2101.
Data normalization was done in R, using the Limma pack-age [7]. Pre-processing and removal of batch effects were done using GEPAS http://www.gepas.org and ASCA-genes [8] respectively. Differentially expressed genes were iden-tified using a concordance strategy [9], based on overlap between three statistically divergent approaches. Genes that had a P-value < 0.05, using both the Info statistic, from the ScoreGenes software package http:// www.cs.huji.ac.il/labs/compbio/scoregenes/, and the Tusher et al [10] Significance Analysis of Microarrays (SAM) implementation in the T-Rex module of GEPAS http://www.gepas.org, in addition to an absolute fold-change > 1.2 (where fold fold-change is defined as the fold dif-ference between MS and SH), were considered to be differ-entially expressed (DE).
The efficiency of PBMC gene expression profiles at pre-dicting the treatment class of samples (i.e. MS or SH) was evaluated with the Prophet module in GEPAS http:// www.gepas.org[13] using both the K-nearest neighbour (KNN) and Support Vector machine (SVM) algorithm options. Leave-one-out cross validation was used to coun-ter selection bias whilst simultaneously assessing predic-tion efficacy.
Results and Discussion
Microarray data comparing the response of control and MS adult mice to stress was used to investigate the pres-ence of a functional link between gene expression changes in the brain and PBMCs. In the first instance data was ana-lysed to characterise the transcriptional response of three brain regions, the prefrontal cortex, the hippocampus and hypothalamus to stress, and to investigate whether a co-ordinated change in glutamatergic and GABAergic systems occurred in MS mice. Corresponding differences in gene expression in PBMCs of MS mice compared to control mice were also identified. Importantly, these differences could be used to predict the treatment status of mice.
Microarray analysis
After normalization, replicate merging, removal of flagged features and imputation, the number of genes expressed in each tissue was: (1) PFC, 15 760; (2) Hic, 17 344; (3) Hyp, 15 794 and (4) PBMC, 13 306.
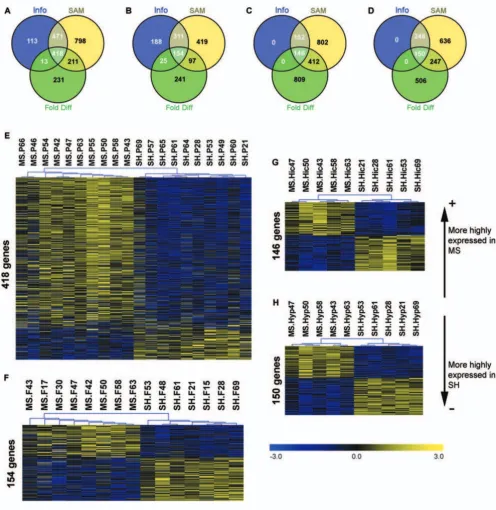
MS produced gene expression differences in all tissues Differentially expressed (DE) genes were identified in all tissues (Figure 1A-D). A summary of all DE genes is pro-vided in [see Additional file 2 Table S2], [see Additional file 3 Table S3], [see Additional file 4 Table S4], and [see Additional file 5 Table S5]. The unsupervised hierarchical sample clustering of differentially expressed genes, pro-duced clear group (MS or SH) separations within all tis-sues (Figure 1E-H). No single gene was differentially expressed across all tissues.
Gene set enrichment analysis revealed significant functional themes
The FatiScan analysis revealed the significant enrichment of functional terms, in all tissues (Figure 2 and Figure 3). In PBMC samples (Figure 3B), over-expressed terms could be grouped, generally, into signalling- (GO:0004872, GO:0051606, GO:0005887, GO:0007165, GO:0007154), immune- (GO:0006955, GO:0006952, GO:0005856, GO:0007275) and, interestingly, neurolog-ically-related (GO:0008188, GO:0050877) classes. On the other hand, under-expressed terms all displayed a metabolic theme, with terms related to RNA and protein processing (GO:0003735, GO:0016070, GO:0044267, GO:0009058, GO:0009059, GO:0015031, GO:0006412, GO:0005840, GO:0003676 and GO:0043021) and
energy metabolism (GO:0005739, GO:0051187 and GO:0006099). These results suggest a functional shift in the immune system in PBMCs in MS mice, characterised by the coordinated down-regulation of energy requiring processes, such as protein synthesis and transport. This functional shift might reflect the well characterised mobi-lisation of energy and inhibition of further storage in response to stress [14].
Response of the glutamergic and GABergic systems in neural tissues after stress
DE genes and enriched functional terms from the PFC datasets highlighted the importance of the glutamatergic and GABAergic systems in the stress-related response of the MS mice. These two neurotransmitter systems consti-tute the major stimulatory (glutamate) and inhibitory (GABA) mechanisms of neurotransmission, and work counteractively to ensure optimal neuronal activity after stress [15]. Glutamatergic signalling was enhanced in MS mice possibly as a consequence of deficiencies in GABAer-gic mediated inhibitory mechanisms.
DE genes whose products are involved in the modulation of glutamatergic and GABAergic signalling included P2yr4
and Npvf (Figure 4). The activation of P2yr4 positively reg-ulates glutamate release [16], whereas Npvf is an impor-tant inhibitor of GABAergic neurotransmission [17]. The over-expression of both these genes in the MS PFC tissue, points to a hyperactive glutamatergic system. Supporting this observation is the under-expression of Myo6 in the MS samples. Myo6 is crucial for the efficient endocytosis of postsynaptic glutamate receptors, with deficiencies result-ing in increased excitatory neurotransmission [18]. Htr3a
func-Differential gene expression results Figure 1
FatiScan gene set enrichment results Figure 2
FatiScan gene set enrichment results. Shown are significant co-ordinately expressed GO terms within whole gene sets for (A) PFC and (B) Hic. The normalized percentage of genes annotated with a specific term is indicated for each group. Red indicates coordinated over-expression in MS group and Blue coordinated over-expression SH group (or under-expression in MS group). Colour intensity denotes how strongly a term is over- or under-expressed.
FatiScan gene set enrichment results Figure 3
tionally enriched terms of the hypothalamus dataset, under-expression of cortistatin may be relevant insofar as cortistatin signalling inhibits glutamate induced responses in hypothalamus [21] (Figure 4).
These findings are consistent with the central role of gluta-mate in the stress-response, in structures such as PFC and hippocampus. Stressors such as acute restraint have been shown to produce dramatic and rapid increases in gluta-mate levels primarily in the PFC, which ultigluta-mately culmi-nates in HPAA activation and glucocorticoid secretion. In addition, the hippocampus is a major site of stress-associ-ated glutamate action. The mechanisms which regulate glutamate action and release within this region function downstream of prefrontal cortical processes, constituting a secondary stress-response phase, which, unlike the PFC, is sensitive to neuroendocrine modulation [22]. The glutamatergic signature found here in both the PFC and hippocampus is therefore consistent with previous work.
Functional significance of gene expression changes in PBMC tissues
A large number of genes (418) were found to be differen-tially expressed between MS and SH individuals and included several genes whose products are important modulators of immune system function. Examples include Foxp3, an essential modulator of T cell function [23]; IL-17ra, the receptor target for the IL-17 mediated inflammatory pathway [24]; and Ccl5 (also known as
Rantes), which regulates the activity of several cellular populations within the immune system [25].
The evidence obtained from the neural transcriptomes (combined with corticosterone and behavioural profiles; van Heerden et al Submitted Manuscript) indicates that pre-weaning treatment (MS or SH) result in differential stress-related profiles. Given this context, the gene expres-sion information derived from the PBMC samples was evaluated in terms of its ability to derive accurate predic-tions of pre-weaning status of individuals.
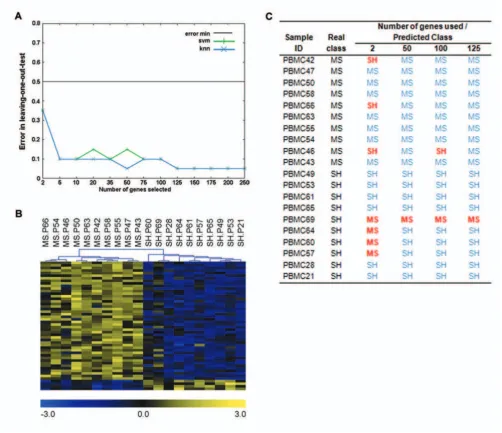
PBMC gene expression profiles accurately predict sample classes
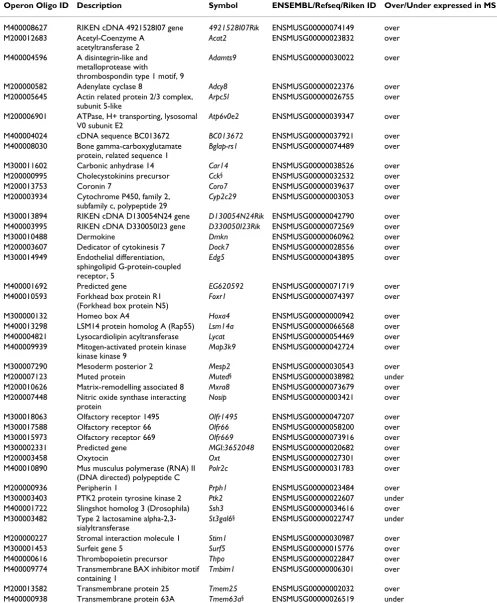
The classification and prediction of sample classes (MS or SH) using PBMC gene expression values, were found to be highly efficient. Using KNN (with 4 neighbours), 50 genes (Figure 5; Table 1) were sufficient to accurately identify sample classes 19 out of 20 times. Most of the genes included in the predictor were over-expressed (Figure 5B). SVM, however, only achieved this success rate using a minimum of 125 genes (with linear and radial kernels). Importantly, this 125 gene set consisted of the 50 genes included in Table 1, in addition to 75 other genes, which were the same for both algorithms (data not shown).
Of the 50 genes included in the predictor, 46 were func-tionally annotated. Of particular interest was the identifi-cation of 3 genes, Oxt, Cck and Adcy8 (all over-expressed), whose products are known to be important mediators of stress- and anxiety-associated behaviours (Table 1) [26-28]. Both Oxt and Cck are neuroactive hormones with previously described endogenous immunomodulatory properties [29,30]. These results confirm that the tran-scriptional profiles of peripheral immune tissues do indeed contain sufficient information for the efficient diagnostic prediction of stress-related neural states in mice. Products of these genes may participate in pathways that are particularly sensitive to stress-induced regulation of the immune system.
Competing interests
The authors declare that they have no competing interests.
Authors' contributions
JHvH carried out the animal studies, microarray experi-ments, data analysis and drafted the manuscript. NI designed and supervised the study, and assisted with the writing of the manuscript. DM and AC assisted with the analysis of the microarray data. DJS and VR contributed to the conception and design of the study, and assisted in the editing of the final versions of the manuscript. All the authors read and approved the final manuscript.
Schematic summary of neural gene expression results in sup-port of a stress-related hyperglutamatergic state in MS brain samples
Figure 4
Table 1: Summary of 50 gene predictor set, which classified samples with 95% accuracy*
Operon Oligo ID Description Symbol ENSEMBL/Refseq/Riken ID Over/Under expressed in MS
M400008627 RIKEN cDNA 4921528I07 gene 4921528I07Rik ENSMUSG00000074149 over M200012683 Acetyl-Coenzyme A
acetyltransferase 2
Acat2 ENSMUSG00000023832 over
M400004596 A disintegrin-like and metalloprotease with thrombospondin type 1 motif, 9
Adamts9 ENSMUSG00000030022 over
M200000582 Adenylate cyclase 8 Adcy8 ENSMUSG00000022376 over M200005645 Actin related protein 2/3 complex,
subunit 5-like
Arpc5l ENSMUSG00000026755 over
M200006901 ATPase, H+ transporting, lysosomal V0 subunit E2
Atp6v0e2 ENSMUSG00000039347 over
M400004024 cDNA sequence BC013672 BC013672 ENSMUSG00000037921 over M400008030 Bone gamma-carboxyglutamate
protein, related sequence 1
Bglap-rs1 ENSMUSG00000074489 over
M300011602 Carbonic anhydrase 14 Car14 ENSMUSG00000038526 over M200000995 Cholecystokinins precursor Cck§ ENSMUSG00000032532 over
M200013753 Coronin 7 Coro7 ENSMUSG00000039637 over M200003934 Cytochrome P450, family 2,
subfamily c, polypeptide 29
Cyp2c29 ENSMUSG00000003053 over
M300013894 RIKEN cDNA D130054N24 gene D130054N24Rik ENSMUSG00000042790 over M400003995 RIKEN cDNA D330050I23 gene D330050I23Rik ENSMUSG00000072569 over M300010488 Dermokine Dmkn ENSMUSG00000060962 over M200003607 Dedicator of cytokinesis 7 Dock7 ENSMUSG00000028556 over M300014949 Endothelial differentiation,
sphingolipid G-protein-coupled receptor, 5
Edg5 ENSMUSG00000043895 over M400001692 Predicted gene EG620592 ENSMUSG00000071719 over M400010593 Forkhead box protein R1
(Forkhead box protein N5)
Foxr1 ENSMUSG00000074397 over
M300000132 Homeo box A4 Hoxa4 ENSMUSG00000000942 over M400013298 LSM14 protein homolog A (Rap55) Lsm14a ENSMUSG00000066568 over M400004821 Lysocardiolipin acyltransferase Lycat ENSMUSG00000054469 over M400009939 Mitogen-activated protein kinase
kinase kinase 9
Map3k9 ENSMUSG00000042724 over
M300007290 Mesoderm posterior 2 Mesp2 ENSMUSG00000030543 over M200007123 Muted protein Muted§ ENSMUSG00000038982 under
M200010626 Matrix-remodelling associated 8 Mxra8 ENSMUSG00000073679 over M200007448 Nitric oxide synthase interacting
protein
Nosip ENSMUSG00000003421 over
M300018063 Olfactory receptor 1495 Olfr1495 ENSMUSG00000047207 over M300017588 Olfactory receptor 66 Olfr66 ENSMUSG00000058200 over M300015973 Olfactory receptor 669 Olfr669 ENSMUSG00000073916 over M300002331 Predicted gene MGI:3652048 ENSMUSG00000020682 over M200003458 Oxytocin Oxt ENSMUSG00000027301 over M400010890 Mus musculus polymerase (RNA) II
(DNA directed) polypeptide C
Polr2c ENSMUSG00000031783 over
M200000936 Peripherin 1 Prph1 ENSMUSG00000023484 over M300003403 PTK2 protein tyrosine kinase 2 Ptk2 ENSMUSG00000022607 under M400001722 Slingshot homolog 3 (Drosophila) Ssh3 ENSMUSG00000034616 over M300003482 Type 2 lactosamine
alpha-2,3-sialyltransferase
St3gal6§ ENSMUSG00000022747 under
M200000227 Stromal interaction molecule 1 Stim1 ENSMUSG00000030987 over M300001453 Surfeit gene 5 Surf5 ENSMUSG00000015776 over M400000616 Thrombopoietin precursor Thpo ENSMUSG00000022847 over M400009774 Transmembrane BAX inhibitor motif
containing 1
Tmbim1 ENSMUSG00000006301 over
M400013169 Xin actin-binding repeat containing 2 isoform 2
Xirp2 ENSMUSG00000027022 over
M400014435 Zinc finger protein 84 Zfp84 ENSMUSG00000046185 over M400018008 Novel Protein Not assigned AC160535 over M400012711 Novel protein (I830077J02Rik) Not assigned AC121847 over M400017112 Uncharacterised Not assigned AK054246 over M400003712 Uncharacterised Not assigned AC122270 over M400008575 Uncharacterised Not assigned ENSMUSG00000064159 over *Genes are sorted by gene symbol; § Not included in differentially expressed gene list
[image:8.612.53.559.83.171.2]Sample classification and prediction results Figure 5
[image:8.612.55.557.211.644.2]Additional material
Acknowledgements
This work was supported by the following grants: a SA-Spain Collaboration Grant (UID 65229) held jointly by Dr Joaquin Dopazo (Bioinformatics Department, Centro de Investigación Principe Felipe, Valencia, Spain) and NI, and a National Research Foundations (NRF) Grant
(ICD2006071800016) held by NI. JvH was a holder of a NRF Scarce Skills Scholarship. The National Institute of Bioinformatics http://www.inab.org is a platform of Genoma España.
References
1. Segman RH, Shefi N, Goltser-Dubner T, Friedman N, Kaminski N, Shalev AY: Peripheral blood mononuclear cell gene expres-sion profiles identify emergent post-traumatic stress disor-der among trauma survivors. Mol Psychiatry 2005,
10(5):500-513.
2. Tsuang MT, Nossova N, Yager T, Tsuang MM, Guo SC, Shyu KG, Glatt SJ, Liew CC: Assessing the validity of blood-based gene expression profiles for the classification of schizophrenia and bipolar disorder: a preliminary report. Am J Med Genet B Neu-ropsychiatr Genet 2005, 133B(1):1-5.
3. Besedovsky HO, del Rey A: Immune-neuro-endocrine interac-tions: facts and hypotheses. Endocr Rev 1996, 17(1):64-102. 4. Tang Y, Lu A, Aronow BJ, Sharp FR: Blood genomic responses
dif-fer after stroke, seizures, hypoglycemia, and hypoxia: blood genomic fingerprints of disease. Ann Neurol 2001,
50(6):699-707.
5. Meaney MJ, Szyf M: Maternal care as a model for experience-dependent chromatin plasticity? Trends in Neurosciences 2005,
28(9):456-463.
6. Romeo RD, Mueller A, Sisti HM, Ogawa S, McEwen BS, Brake WG:
Anxiety and fear behaviors in adult male and female C57BL/ 6 mice are modulated by maternal separation. Horm Behav
2003, 43(5):561-567.
7. Smyth GK: Limma: linear models for microarray data. In Bio-informatics and Computational Biology Solutions using R and Bioconductor
Edited by: Gentleman R, Carey V, Dudoit S, Irizarry R, Huber W. New York: Springer; 2005:397-420.
8. Nueda M, Conesa A, Westerhuis J, Hoefsloot H, Smilde A, Talon M, Ferrer A: Discovering gene expression patterns in time course microarray experiments by ANAVO-SCA. Bioinfor-matics 2007, 23(14):8.
9. Guo L, Lobenhofer EK, Wang C, Shippy R, Harris SC, Zhang L, Mei N, Chen T, Herman D, Goodsaid FM, et al.: Rat toxicogenomic study reveals analytical consistency across microarray plat-forms. Nat Biotechnol 2006, 24(9):1162-1169.
10. Tusher VG, Tibshirani R, Chu G: Significance analysis of micro-arrays applied to the ionizing radiation response. Proc Natl Acad Sci USA 2001, 98(9):5116-5121.
11. Conesa A, Gotz S, Garcia-Gomez JM, Terol J, Talon M, Robles M:
Blast2GO: a universal tool for annotation, visualization and analysis in functional genomics research. Bioinformatics 2005,
21(18):3674-3676.
12. Al-Shahrour F, Arbiza L, Dopazo H, Huerta-Cepas J, Minguez P, Mon-taner D, Dopazo J: From genes to functional classes in the study of biological systems. BMC Bioinformatics 2007, 8:114. 13. Medina I, Montaner D, Tarraga J, Dopazo J: Prophet, a web-based
tool for class prediction using microarray data. Bioinformatics
2007, 23(3):390-391.
14. Sapolsky RM, Romero LM, Munck AU: How do glucocorticoids influence stress responses? Integrating permissive, suppres-sive, stimulatory, and preparative actions. Endocr Rev 2000,
21(1):55-89.
15. Olson R: GABA. In Neuropsychopharmacology: The Fifth Generation of Progress Edited by: Davis K, Charney D, Coyle J, Nemeroff C. Phila-delphia: Lippincott, Williams & Wilkins; 2002.
16. Wirkner K, Gunther A, Weber M, Guzman SJ, Krause T, Fuchs J, Koles L, Norenberg W, Illes P: Modulation of NMDA receptor current in layer V pyramidal neurons of the rat prefrontal cortex by P2Y receptor activation. Cereb Cortex 2007,
17(3):621-631.
17. Jhamandas JH, Simonin F, Bourguignon JJ, Harris KH: Neuropeptide FF and neuropeptide VF inhibit GABAergic neurotransmis-sion in parvocellular neurons of the rat hypothalamic par-aventricular nucleus. Am J Physiol Regul Integr Comp Physiol 2007,
292(5):R1872-1880.
18. Osterweil E, Wells DG, Mooseker MS: A role for myosin VI in postsynaptic structure and glutamate receptor endocytosis.
Journal of Cell Biology 2005, 168(2):329-338.
19. Puig MV, Santana N, Celada P, Mengod G, Artigas F: In vivo excita-tion of GABA interneurons in the medial prefrontal cortex through 5-HT3 receptors. Cereb Cortex 2004, 14(12):1365-1375. 20. Crestani F, Lorez M, Baer K, Essrich C, Benke D, Laurent JP, Belzung C, Fritschy JM, Luscher B, Mohler H: Decreased GABAA-recep-tor clustering results in enhanced anxiety and a bias for threat cues. Nat Neurosci 1999, 2(9):833-839.
21. Vassilaki A, Lanneau C, Dournand P, de Lecea L, Gardette R, Epel-baum J: Cortistatin affects glutamate sensitivity in mouse hypothalamic neurons through activation of somatostatin receptor subtype. Neuroscience 1999, 88(2):359-364.
22. Moghaddam B: Stress activation of glutamate neurotransmis-sion in the prefrontal cortex: implications for
dopamine-Additional file 1
Supplementary Methods. Detailed description of materials and methods, including a summary of RNA sample purity and integrity, and examples of box- and MA-plots from the PFC microarray dataset.
Click here for file
[http://www.biomedcentral.com/content/supplementary/1756-0500-2-195-S1.DOC]
Additional file 2
Table S2 Frontal Association Cortex differentially expressed genes. Summary of differentially expressed genes identified in frontal association cortex, including p-values for Info and SAM statistics, and log2 fold
differ-ences.
Click here for file
[http://www.biomedcentral.com/content/supplementary/1756-0500-2-195-S2.XLS]
Additional file 3
Table S3 Hippocampus differentially expressed genes. Summary of dif-ferentially expressed genes identified in hippocampus, including p-values for Info and SAM statistics, and log2 fold differences.
Click here for file
[http://www.biomedcentral.com/content/supplementary/1756-0500-2-195-S3.XLS]
Additional file 4
Table S4 Hypothalamus differentially expressed genes. Summary of dif-ferentially expressed genes identified in hypothalamus, including p-values for Info and SAM statistics, and log2 fold differences.
Click here for file
[http://www.biomedcentral.com/content/supplementary/1756-0500-2-195-S4.XLS]
Additional file 5
Table S5 Peripheral Blood Mononuclear Cells differentially expressed genes. Summary of differentially expressed genes identified in Peripheral Blood Mononuclear Cells, including p-values for Info and SAM statistics, and log2 fold differences.
Click here for file
Publish with BioMed Central and every scientist can read your work free of charge
"BioMed Central will be the most significant development for disseminating the results of biomedical researc h in our lifetime."
Sir Paul Nurse, Cancer Research UK
Your research papers will be:
available free of charge to the entire biomedical community
peer reviewed and published immediately upon acceptance
cited in PubMed and archived on PubMed Central
yours — you keep the copyright
Submit your manuscript here:
http://www.biomedcentral.com/info/publishing_adv.asp
BioMedcentral
associated psychiatric disorders. Biological Psychiatry 2002,
51:775-787.
23. Kasprowicz DJ, Smallwood PS, Tyznik AJ, Ziegler SF: Scurfin (FoxP3) controls T-dependent immune responses in vivo through regulation of CD4+ T cell effector function. J Immunol
2003, 171(3):1216-1223.
24. Gaffen SL: An overview of IL-17 function and signaling. Cytokine
2008, 43(3):402-407.
25. Grayson MH, Holtzman MJ: Chemokine complexity: the case for CCL5. Am J Respir Cell Mol Biol 2006, 35(2):143-146.
26. Ring R, Malberg J, Potestio L, Ping J, Boikess S, Luo B, Schechter L, Rizzo S, Rahman Z, Rosenzweig-Lipson S: Anxiolytic-like activity of oxytocin in male mice: behavioral and autonomic evi-dence, therapeutic implications. Psychopharmacology 2006,
185(2):218-225.
27. Schaefer ML, Wong ST, Wozniak DF, Muglia LM, Liauw JA, Zhuo M, Nardi A, Hartman RE, Vogt SK, Luedke CE, et al.: Altered stress-induced anxiety in adenylyl cyclase type VIII-deficient mice.
J Neurosci 2000, 20(13):4809-4820.
28. Windle RJ, Shanks N, Lightman SL, Ingram CD: Central oxytocin administration reduces stress-induced corticosterone release and anxiety behavior in rats. Endocrinology 1997,
138(7):2829-2834.
29. Csaba G, Pallinger E: In vitro effect of hormones on the hor-mone content of rat peritoneal and thymic cells. Is there an endocrine network inside the immune system? Inflamm Res
2007, 56(11):447-451.