RESEARCH NOTE
A pilot study of hot-wire, ultrasonic
and wedge-bellows spirometer inter-
and intra-variability
Marit E. Aardal
1, Lene L. Svendsen
1, Sverre Lehmann
1,2, Tomas M. Eagan
1,2and Ingvild Haaland
1,2*Abstract
Objective: The aim of this pilot study was to compare spirometric values obtained with different types of spirom-eters, spirometers of same type, and repeated measurements with the same spirometer in a pulmonary function laboratory setting.
Results: 12 healthy volunteers performed spirometry on four hot-wire (SensorMedics), two ultrasonic (Spirare) and one wedge-bellows (Vitalograph S) spirometers, according to ATS/ERS (American Thoracic Society/European Respira-tory Society) guidelines. Spirometric values were compared using linear mixed models analysis with a random inter-cept for subjects and a fixed effect for type of spirometer used. Confidence intervals and p values were adjusted for multiple comparisons. Mean ± SD (L) values for hot-wire, ultrasonic and wedge-bellows spirometers for FVC (forced vital capacity) were 4.02 ± 0.66, 3.69 ± 0.61 and 3.93 ± 0.69, and for FEV1 (forced expiratory volume in one second) 3.06 ± 0.44, 2.95 ± 0.44 and 3.10 ± 0.49. Significant differences were found between hot-wire and ultrasonic and between wedge-bellows and ultrasonic spirometers for FVC and FEV1, and between hot-wire and wedge-bellows spirometers for FVC but not for FEV1. There were no significant differences between spirometers of same type, and low mean differences in repeated measurements for all spirometers included. In conclusion, the pilot study shows systematically higher values for FVC and FEV1 for hot-wire and wedge-bellows compared to ultrasonic spirometers. Keywords: Spirometry, Spirometer comparison, Ultrasonic, Hot-wire, Wedge-bellows
© The Author(s) 2017. This article is distributed under the terms of the Creative Commons Attribution 4.0 International License (http://creativecommons.org/licenses/by/4.0/), which permits unrestricted use, distribution, and reproduction in any medium, provided you give appropriate credit to the original author(s) and the source, provide a link to the Creative Commons license, and indicate if changes were made. The Creative Commons Public Domain Dedication waiver (http://creativecommons.org/ publicdomain/zero/1.0/) applies to the data made available in this article, unless otherwise stated.
Introduction
Spirometry is an important tool to assist diagnosis, detect severity of lung disease, follow disease develop-ment, determine effects of and changes in treatdevelop-ment, and to assess preoperative risk [1]. Thus, accurate and reliable results from spirometry testing are necessary for opti-mal treatment of most patients with lung disease. Multi-ple factors are known to influence lung function testing, including conditions involving the patient, the instructor and the equipment used [2–7]. With the variety of spiro-metric equipment used across and within laboratories, differences in measurements between spirometers can be a challenge in patient diagnostics and follow-up, and
in research studies. Furthermore, despite meeting the ATS/ERS recommendations when tested with a standard forcing function like a waveform generator, spirometers may exhibit differences in measurements when applied to patients in the clinics. Our aim was therefore to compare the spirometer-subject system performance for different spirometers in a pulmonary function laboratory setting. We compared spirometric values from healthy subjects obtained with different types of spirometers, spirometers of same type, and repeated measurements with the same spirometer.
Main text Methods
We performed a quality assurance study at the Respira-tory Physiology LaboraRespira-tory, Haukeland University Hos-pital, Bergen, where 12 healthy volunteers performed
Open Access
*Correspondence: [email protected]
1 Department of Thoracic Medicine, Haukeland University Hospital, 5021 Bergen, Norway
spirometry on 7 different spirometers within a period of 14 days in 2012. The study was remit assessed by the Regional Ethics Committee (REK Vest; http://helsefor-skning.etikkom.no, Norwegian Ministry of Education and Research), which classified the study as quality assurance (REK Vest #2016/1552). The spirometers used were four hot-wire (Vmax Encore 22D, Carefusion, Vmax Encore 22D, Vmax Encore 22, Vmax Spectra 229, SensorMedics, referred to as HW1-HW4), two ultrasonic (Spirare SPS320 sensors, Diagnostica AS, referred to as US1 and US2), and one wedge-bellows (Vitalograph S, Vitalograph™ Limited, referred to as WB). All spirometers meet the ATS/ERS recommen-dations. The hot-wire and wedge-bellows spirometers were calibrated and verified daily with 3-L (hot-wire) or 1-L (wedge-bellows) certified calibration syringes. The ultrasonic spirometers were pre-calibrated from the company, but volume-checked in quality control mode. All spirometers were further volume-checked by testing 3-L calibration syringes in patient mode, where the calibration syringe was completely discharged in one second. Spirometry was conducted by four expe-rienced instructors according to ATS/ERS guidelines [8]. The tests were distributed equally among the four instructors, and both instructors and order of spirom-eters tested were randomized. Differences in repeated measurements with a spirometer were defined as dif-ferences between best and second best measurement in one test. Spirometric values were compared using lin-ear mixed models analysis with a random intercept for subjects and a fixed effect for the type of spirometer used. Repeated covariance structure was set to unstruc-tured to allow for heteroscedasticity. 95% confidence intervals and p values were adjusted for multiple com-parisons (Bonferroni correction). Bland–Altman plots with 95% limits of agreement were used to demonstrate systematic differences [9]. Statistical analysis was per-formed using IBM SPSS Statistics, version 24. The level of significance was set at 0.05. Figures were made using Graphpad Prism, version 6.0.
Results
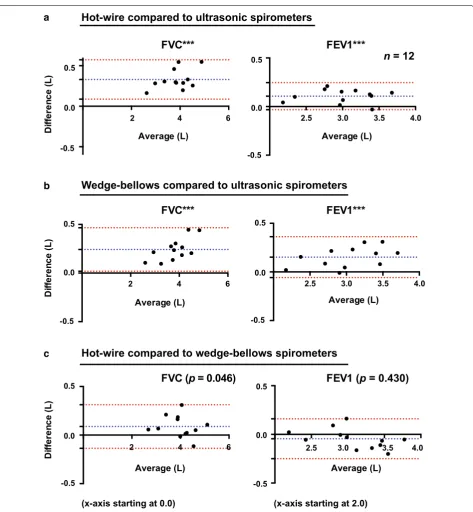
Spirometric values were compared for the different groups of spirometers; hot-wire (HW), ultrasonic (US), and wedge-bellows (WB), and results for FVC and FEV1 are shown by Bland–Altman plots in Fig. 1. Mean ± SD (L) values for HW, US and WB spirometers for FVC were 4.02 ± 0.66, 3.69 ± 0.61 and 3.93 ± 0.69, and for FEV1 3.06 ± 0.44, 2.95 ± 0.44 and 3.10 ± 0.49, respectively. Linear mixed models analysis demonstrated significant differences between HW and US for FVC (p < 0.001) and FEV1 (p < 0.001), between WB and US for FVC (p < 0.001) and FEV1 (p < 0.001), and between HW and
WB for FVC (p = 0.046), but not for FEV1 (p = 0.430). Mean differences, mean relative differences and Bland– Altman 95% limits of agreement for FVC and FEV1 are shown in Table 1. No significant differences were found between same type of spirometer (see Table 1). Mean ± SD (L) values for HW, US and WB spirometers for FEV6 were 3.91 ± 0.63, 3.63 ± 0.58 and 3.83 ± 0.65, with significant differences between HW and US (p < 0.001) and between WB and US (p < 0.01), but not between HW and WB (p = 0.104). Mean ± SD (L/min) values for PEF were 478 ± 79, 489 ± 99 and 479 ± 77, respectively (no significant differences). Mean differences with Bonferroni corrected 95% confidence intervals and p values from the linear mixed models analyses are shown for FVC, FEV1 and FEV6 for comparisons of dif-ferent types of spirometers and spirometers of same type (Fig. 2). For differences between best and second best measurement in one test, mean differences were rang-ing from 0.03 to 0.06 L (0.63–1.51%) for FVC and from 0.03 to 0.05 L (0.84–1.70%) for FEV1 for the different spirometers (Table 1). Results from testing 3-L syringes in patient mode, showed an average FVC of 3.05 L for Spirare sensors, 3.30 L for the Vitalograph, and 3.37 L for the hot-wire spirometers.
Discussion
The observed differences in measurements for FVC and FEV1 between the different types of spirometers could be caused by several factors. The SensorMedics instruments are flow-measuring devices with a mass flow sensor based on Kelvin-sensed hot-wire anemometer principles, the Spirare sensors use two-way ultrasound transit time to measure the speed of the airflow, and the Vitalograph measures volume directly by the use of a wedge-bellows [10]. The hot-wire and wedge-bellows spirometers were calibrated and verified daily with different calibration syringes, which may affect the accuracy of the spirometer [11]. The ultrasonic spirometers were pre-calibrated from the company, a procedure previously proved sufficient to retain long-term accuracy in comparable instruments [12].
used for testing patients, exhaled air is measured close to the mouth and there are no physical obstacles in the air channel. Thus, one could argue that variable cooling of air does not affect the results considerably. However,
the real-time BTPS correction applied by the hot-wire spirometers also takes into account variations in ambient temperature, pressure and humidity, possibly leading to increased accuracy.
-0.5 0.0 0.5 -0.5
0.0 0.5
Average (L)
FEV1***
Average (L)
Di
ffe
re
nc
e (L)
FVC***
-0.5 0.0 0.5
-0.5 0.0 0.5
Hot-wire compared to ultrasonic spirometers
Wedge-bellows compared to ultrasonic spirometers
V
E
F
*
*
*
C
V
F
1***
Hot-wire compared to wedge-bellows spirometers
n
= 12
2.5 3.0 3.5 4.0 2.5 3.0 3.5 4.0 2.5 3.0 3.5 4.0
2 4 6
2 4 6
2 4 6
0.0 0.5
-0.5
0.0 0.5
-0.5
Di
fferen
ce (L)
Average (L) Average (L)
FVC (
p
= 0.046)
FEV1 (
p
= 0.430)
Average (L) Average (L)
(x-axis starting at 0.0) (x-axis starting at 2.0)
Di
ffere
nc
e (L)
a
b
c
[image:3.595.63.537.83.596.2]There were also differences in the technique for per-forming spirometry. For the hot-wire spirometers, 3–4 times of tidal volume measurements were performed before maximal inspiration and forced expiration. For ultrasonic and wedge-bellows spirometers, maximal inspiration was performed before the patient connected to the mouthpiece. There was a tendency to increased difference with increased lung volumes for FVC (see
Bland–Altman plots) and FEV6 for hot-wire compared and wedge-bellows compared to ultrasonic, but not for hot-wire compared to wedge-bellows spirometers. Fur-thermore, there was only a small difference in FVC for hot-wire compared to wedge-bellows spirometers, and no difference in FEV6. These small differences could be caused by dissimilarities in the technique for perform-ing spirometry, while the larger proportional biases for
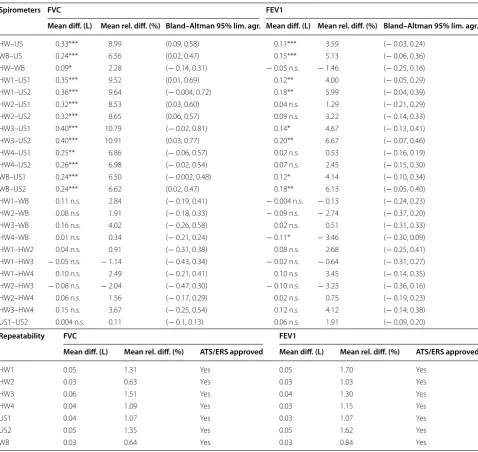
Table 1 Differences in measurements between different types of spirometers, spirometers of same type, and repeated measurements with a spirometer
Repeatability: difference between best and second best test, Mean difference: e.g. HW–US, Mean relative difference: e.g. HW–US/US*100 diff difference, HW hot-wire, lim. agr. limits of agreement, n.s. not significant, rel relative, US ultrasonic, WB wedge-bellows
* p < 0.05, ** p < 0.01,*** p < 0.001 (Bonferroni-corrected from linear mixed models, n = 12)
Spirometers FVC FEV1
Mean diff. (L) Mean rel. diff. (%) Bland–Altman 95% lim. agr. Mean diff. (L) Mean rel. diff. (%) Bland–Altman 95% lim. agr.
HW–US 0.33*** 8.99 (0.09, 0.58) 0.11*** 3.59 (− 0.03, 0.24) WB–US 0.24*** 6.56 (0.02, 0.47) 0.15*** 5.13 (− 0.06, 0.36) HW–WB 0.09* 2.28 (− 0.14, 0.31) − 0.05 n.s. − 1.46 (− 0.25, 0.16) HW1–US1 0.35*** 9.52 (0.01, 0.69) 0.12** 4.00 (− 0.05, 0.29) HW1–US2 0.36*** 9.64 (− 0.004, 0.72) 0.18** 5.99 (− 0.04, 0.39) HW2–US1 0.32*** 8.53 (0.03, 0.60) 0.04 n.s. 1.29 (− 0.21, 0.29) HW2–US2 0.32*** 8.65 (0.06, 0.57) 0.09 n.s. 3.22 (− 0.14, 0.33) HW3–US1 0.40*** 10.79 (− 0.02, 0.81) 0.14* 4.67 (− 0.13, 0.41) HW3–US2 0.40*** 10.91 (0.03, 0.77) 0.20** 6.67 (− 0.07, 0.46) HW4–US1 0.25** 6.86 (− 0.06, 0.57) 0.02 n.s. 0.53 (− 0.16, 0.19) HW4–US2 0.26*** 6.98 (− 0.02, 0.54) 0.07 n.s. 2.45 (− 0.15, 0.30) WB–US1 0.24*** 6.50 (− 0.002, 0.48) 0.12* 4.14 (− 0.10, 0.34) WB–US2 0.24*** 6.62 (0.02, 0.47) 0.18** 6.13 (− 0.05, 0.40) HW1–WB 0.11 n.s. 2.84 (− 0.19, 0.41) − 0.004 n.s. − 0.13 (− 0.24, 0.23) HW2–WB 0.08 n.s 1.91 (− 0.18, 0.33) − 0.09 n.s. − 2.74 (− 0.37, 0.20) HW3–WB 0.16 n.s. 4.02 (− 0.26, 0.58) 0.02 n.s. 0.51 (− 0.31, 0.33) HW4–WB 0.01 n.s. 0.34 (− 0.21, 0.24) − 0.11* − 3.46 (− 0.30, 0.09) HW1–HW2 0.04 n.s. 0.91 (− 0.31, 0.38) 0.08 n.s. 2.68 (− 0.25, 0.41) HW1–HW3 − 0.05 n.s. − 1.14 (− 0.43, 0.34) − 0.02 n.s. − 0.64 (− 0.31, 0.27) HW1–HW4 0.10 n.s. 2.49 (− 0.21, 0.41) 0.10 n.s 3.45 (− 0.14, 0.35) HW2–HW3 − 0.08 n.s. − 2.04 (− 0.47, 0.30) − 0.10 n.s. − 3.23 (− 0.36, 0.16) HW2–HW4 0.06 n.s. 1.56 (− 0.17, 0.29) 0.02 n.s. 0.75 (− 0.19, 0.23) HW3–HW4 0.15 n.s. 3.67 (− 0.25, 0.54) 0.12 n.s 4.12 (− 0.14, 0.38) US1–US2 0.004 n.s. 0.11 (− 0.1, 0.13) 0.06 n.s. 1.91 (− 0.09, 0.20)
Repeatability FVC FEV1
Mean diff. (L) Mean rel. diff. (%) ATS/ERS approved Mean diff. (L) Mean rel. diff. (%) ATS/ERS approved
HW1 0.05 1.31 Yes 0.05 1.70 Yes
HW2 0.03 0.63 Yes 0.03 1.03 Yes
HW3 0.06 1.51 Yes 0.04 1.30 Yes
HW4 0.04 1.09 Yes 0.03 1.15 Yes
US1 0.04 1.07 Yes 0.03 1.07 Yes
US2 0.05 1.35 Yes 0.05 1.62 Yes
[image:4.595.58.537.110.562.2]C V F
<0.001 <0.001 0.046 <0.001 <0.001 <0.001 <0.001 <0.001 <0.001 0.002 <0.001 <0.001 <0.001 0.464 1.000 0.413 1.000 1.000 1.000 0.885 1.000 1.000 0.478 1.000 p-value
HW vs US WB vs US HW vs WB HW1 vs US1 HW1 vs US2 HW2 vs US1 HW2 vs US2 HW3 vs US1 HW3 vs US2 HW4 vs US1 HW4 vs US2 WB vs US1 WB vs US2 HW1 vs WB HW2 vs WB HW3 vs WB HW4 vs WB HW1 vs HW2 HW1 vs HW3 HW1 vs HW4 HW2 vs HW3 HW2 vs HW4 HW3 vs HW4 US1 vs US2
-0.2 0.0 0.2 0.4 0.6
-0.2 0.0 0.2
0.4 FEV1
<0.001 <0.001 0.430 0.008 0.002 1.000 0.303 0.062 0.004 1.000 0.922 0.037 0.002 1.000 1.000 1.000 0.043 1.000 1.000 0.250 0.402 1.000 0.11
4
0.397
p-value a
b
c
-0.2 0.0 0.2 0.4 0.6
<0.001 <0.001 0.104 <0.001 <0.001 <0.001 <0.001 <0.001 <0.001 0.014 0.003 0.006 <0.001 0.698 1.000 0.472 1.000 1.000 1.000 0.503 1.000 0.964 0.197 0.393 p-value
hot-wire and wedge-bellows compared to ultrasonic spirometers are more likely to be caused by differences in measurements principles between the spirometers.
Patient and instructor variability may also interfere with the measurements [3, 4]. Nevertheless, the system-atically higher values for FVC and FEV1 for hot-wire and wedge-bellows compared to ultrasonic spirometers sug-gest that there are actual differences in measurements between the different types of instruments. Similar, but smaller differences have been observed in previous stud-ies of other hot-wire and ultrasonic spirometers [5, 6]. A strength of our pilot study is the inclusion of the Vitalo-graph, which is considered a gold standard in spirometry testing as it measures volume directly [13]. The Vita-lograph has also shown agreement with other types of spirometers, like the pneumotachograph [14].
In conclusion, the pilot study shows systematically higher values for FVC and FEV1 for hot-wire and wedge-bellows compared to ultrasonic spirometers. Techni-cians and physiTechni-cians involved in lung function testing and interpretation should be aware of the possible inter-variability between spirometers. The findings should be investigated in larger data sets including patients, instructors and spirometers within and across laborato-ries. The impact of spirometer inter-variability on con-clusions regarding the patient’s diagnosis and treatment should be explored. Furthermore, the results warrant dis-cussion on standardization of BTPS correction in order to improve agreement between spirometers.
Limitations
The pilot study demonstrates differences in measure-ments between spirometers for a small data set of 12 healthy individuals. In order to draw conclusions, larger cohorts including different groups of patients with a broad range of spirometric values should be investigated. Spirometry is a physiological test, where the testing pro-cedure and results are influenced by a number of differ-ent factors. We have not tested the performance of the spirometers with a waveform generator, as this equip-ment is not available at our laboratory. However, all spirometers were tested by the manufacturer and shown to meet the ATS/ERS recommendations. Moreover, we
could have tested each subject at several different time points for each spirometer to assess the variability within each subject. The instructor conducting the tests adds another well-known source of variability. In larger com-parison studies, it is not possible for one instructor to perform all tests. A randomized design for instructors in addition to order of spirometers tested is therefore cru-cial. Differences in techniques for performing spirom-etry for the different spirometers may also influence the results, and make it difficult to distinguish between dif-ferences in measurements caused by the technique com-pared the detection itself. Finally, in our mixed models analysis, we have not included adjustments for sex, age and height, as this is a small quality assurance study where these data were not available. These characteris-tics, together with size of lung volume, are also shown to affect the magnitude of the bias in spirometer compari-son studies [5], and should be included in future studies.
Abbreviations
ATPS: ambient temperature and pressure, saturated; ATS: American Thoracic Society; BTPS: body temperature and pressure, saturated; ERS: European Res-piratory Society; FEV1: forced exRes-piratory volume in one second; FEV6: forced expiratory volume in 6 second; FVC: forced vital capacity; HW: hot-wire; PEF: peak expiratory flow; US: ultrasonic; WB: wedge-bellows.
Authors’ contributions
MA, LS and IH designed the study. LS was responsible for the data collection. MA, IH and TE did the statistical analysis. MA, LS, SL, TE and IH interpreted data. MA, LS, SL, TE and IH participated in writing the manuscript. All authors read and approved the final manuscript.
Author details
1 Department of Thoracic Medicine, Haukeland University Hospital, 5021 Ber-gen, Norway. 2 Department of Clinical Science, University of Bergen, Bergen, Norway.
Acknowledgements
We would like to thank the volunteers and instructors participating in this pilot study.
Competing interests
The authors declare that they have no competing interests.
Availability of data and materials
The datasets used and analyzed during the current study are available from the corresponding author on reasonable request.
Consent for publication
Not applicable.
(See figure on previous page.)
• We accept pre-submission inquiries
• Our selector tool helps you to find the most relevant journal
• We provide round the clock customer support
• Convenient online submission
• Thorough peer review
• Inclusion in PubMed and all major indexing services
• Maximum visibility for your research
Submit your manuscript at www.biomedcentral.com/submit
Submit your next manuscript to BioMed Central
and we will help you at every step:
Ethics approval and consent to participate
The study was remit assessed by the Regional Ethics Committee (REK Vest; http://helseforskning.etikkom.no, Norwegian Ministry of Education and Research), which classified the study as quality assurance (REK Vest #2016/1552), without the need for written informed consent.
Funding
There was no funding for the study.
Publisher’s Note
Springer Nature remains neutral with regard to jurisdictional claims in pub-lished maps and institutional affiliations.
Received: 6 January 2017 Accepted: 30 September 2017
References
1. Lange NE, Mulholland M, Kreider ME. Spirometry: don’t blow it! Chest. 2009;136:608–14.
2. Miller MR, Crapo R, Hankinson J, Brusasco V, Burgos F, Casaburi R, Coates A, Enright P, van der Grinten CP, Gustafsson P, et al. General considerations for lung function testing. Eur Respir J. 2005;26:153–61.
3. Dillard TA, Reyes J, Johnson M, Baker R. Patient-based studies of agree-ment between spirometers. Respir Care. 2003;48:587–8.
4. Akhtar R, Wilson A. A comparison of spirometry in general practice and a pulmonary function laboratory. Prim Care Respir J. 2005;14:215–20. 5. Bridevaux PO, Dupuis-Lozeron E, Schindler C, Keidel D, Gerbase MW,
Probst-Hensch NM, Bettschart R, Burdet L, Pons M, Rothe T, et al. Spirometer replacement and serial lung function measurements in population studies: results from the SAPALDIA Study. Am J Epidemiol. 2015;181:752–61.
6. Gerbase MW, Dupuis-Lozeron E, Schindler C, Keidel D, Bridevaux PO, Kriemler S, Probst-Hensch NM, Rochat T, Kunzli N. Agreement between spirometers: a challenge in the follow-up of patients and populations? Respiration. 2013;85:505–14.
7. Liistro G, Vanwelde C, Vincken W, Vandevoorde J, Verleden G, Buffels J. Technical and functional assessment of 10 office spirometers: a multi-center comparative study. Chest. 2006;130:657–65.
8. Miller MR, Hankinson J, Brusasco V, Burgos F, Casaburi R, Coates A, Crapo R, Enright P, van der Grinten CP, Gustafsson P, et al. Standardisation of spirometry. Eur Respir J. 2005;26:319–38.
9. Bland JM, Altman DG. Statistical methods for assessing agreement between two methods of clinical measurement. Lancet. 1986;1:307–10. 10. de Jongh F. Spirometers. Breathe. 2008;4:251–4.
11. Madsen F. Validation of spirometer calibration syringes. Scand J Clin Lab Invest. 2012;72:608–13.
12. Skloot GS, Edwards NT, Enright PL. Four-year calibration stability of the EasyOne portable spirometer. Respir Care. 2010;55:873–7.
13. Moore VC. Spirometry: step by step. Breathe. 2012;8:232–40. 14. Marshall M, Jackson J, Cooper BG. Does it matter which type of