Theses Thesis/Dissertation Collections
2011
Page layout analysis and classification in complex
scanned documents
Mustafa Erkilinc
Follow this and additional works at:http://scholarworks.rit.edu/theses
This Thesis is brought to you for free and open access by the Thesis/Dissertation Collections at RIT Scholar Works. It has been accepted for inclusion in Theses by an authorized administrator of RIT Scholar Works. For more information, please [email protected].
Recommended Citation
PAGE LAYOUT ANALYSIS AND CLASSIFICATION
FOR COMPLEX SCANNED DOCUMENTS
by
Mustafa Sezer Erkilinc
A thesis submitted in partial fulfillment of the requirements for the degree of
M
ASTER OF
S
CIENCE
IN
E
LECTRICAL
E
NGINEERING
Approved by:
Prof.
Thesis Advisor– Dr. Eli Saber
Prof.
Thesis Committee Member– Dr. Sohail Dianat
Prof.
Thesis Committee Member– Dr. Ferat Sahin
Prof.
Department Head– Dr. Sohail Dianat
Department of Electrical and Microelectronic Engineering Kate Gleason College of Engineering
ROCHESTER INSTITUTE OFTECHNOLOGY Rochester, New York
Thesis Author Permission Statement
Title of Thesis: PAGE LAYOUT ANALYSIS AND CLASSIFICATION IN COMPLEX SCANNED DOCUMENTS
Author: Mustafa Sezer Erkilinc Degree: Master of Science Program: Electrical Engineering
College: Kate Gleason College of Engineering
I understand that I must submit a print copy of my thesis or dissertation to the RIT Archives, per current RIT guidelines for the completion of my degree. I hereby grant to the Rochester Institute
of Technology and its agents the non-exclusive license to archive and make accessible my thesis or dissertation in whole or in part in all forms of media in perpetuity. I retain all other ownership rights to the copyright of the thesis or dissertation. I also retain the right to use in future works (such as articles or books) all or part of this thesis or dissertation.
Print Reproduction Permission Granted:
I, Mustafa Sezer Erkilinc, hereby grant permission to the Rochester Institute of Technol-ogy to reproduce my thesis or dissertation in whole or in part. Any reproduction will not be for commercial use or profit.
Author: Date:
Inclusion in the RIT Digital Media Library Electronic Thesis & Dissertation (ETD) Archive:
I,Mustafa Sezer Erkilinc, additionally grant to the Rochester Institute of Technology Digital
Media Library (RIT DML) the non-exclusive license to archive and provide electronic access to my thesis or dissertation in whole or in part in all forms of media in perpetuity.
I understand that my work, in addition to its bibliographic record and abstract, will be available to the world-wide community of scholars and researchers through the RIT DML. I retain all other ownership rights to the copyright of the thesis or dissertation. I also retain the right to use in future works (such as articles or books) all or part of this thesis or dissertation. I am aware that the
Rochester Institute of Technology does not require registration of copyright for ETDs.
I hereby certify that, if appropriate, I have obtained and attached written permission statements from the owners of each third party copyrighted matter to be included in my thesis or dissertation. I certify that the version I submitted is the same as that approved by my committee.
iii
D
EDICATION
To my mother, ¸Sengül Ergünü, for her endless support in my decisions. To my father,Gürsel Erkılınç, for broadening my vision.
D
EDICATION
A
CKNOWLEDGEMENTS
I am elated to have completed my graduate study. I have gained valuable knowledge in two years of graduate study at RIT. This experience has presented opportunities to improve myself both academically and personally. In this regard, I am grateful to RIT and the Department of Electrical and Microelectronic Engineering.
I would like to acknowledge and extend my heartfelt gratitude to the following colleagues: Mustafa Jaber for sharing his valuable experiences, and always being optimistic, Abdul Haleem
Syed for his positive outlook on life and for our worthwhile discussions. I am also thankful to Mr. Peter Bauer, and the Hewlett Packard Company for their support and sponsorship for making this research possible.
I am very grateful to Dr. Drew Maywar who helped me discover a new world in electrical engineering. His knowledge and vision changed my point of view, and provided me with a new focus in an area of study which fascinates me. I also would like to thank to Dr. Ferat Sahin and
Prof. Sohail Dianat for agreeing to be committee members for my thesis, and sharing their valuable ideas and reviews.
And finally, special thanks to Prof. Eli Saber who gave me an opportunity to work on his ex-citing projects. This thesis could not have been written without his encouragement throughout my academic life at RIT. His exacting character motivated me to aspire to greater academic achieve-ments. He never accepted less than my best efforts, as he well knows. In addition to his academic support, he has always been there and willing to discuss my concerns, even if they are very
per-sonal. He taught me the significance of pushing myself, trying hard, and preserving.
Thank you Prof. Eli Saber for everything, it has been a pleasure and an honor being your student.
M. Sezer Erkilinc
A
BSTRACT
Page layout analysis has been extensively studied since the 1980‘s, particularly after computers
be-gan to be used for document storage or database units. For efficient document storage and retrieval
from a database, a paper document would be transformed into its electronic version. Algorithms
and methodologies are used for document image analysis in order to segment a scanned document
into different regions such as text, image or line regions. To contribute a novel approach in the
field of page layout analysis and classification, this algorithm is developed for both RGB space
and grey-scale scanned documents without requiring any specific document types, and scanning
techniques. In this thesis, a page classification algorithm is proposed which mainly applies wavelet
transform, Markov random field (MRF) and Hough transform to segment text, photo and
strong-edge/line regions in both color and gray-scale scanned documents. The algorithm is developed
to handle both simple and complex page layout structures and contents (text only vs. book cover
that includes text, lines and/or photos). The methodology consists of five modules. In the first
module, called pre-processing, image enhancements techniques such as image scaling, filtering,
color space conversion or gamma correction are applied in order to reduce computation time and
enhance the scanned document. The techniques, used to perform the classification, are employed
on the one-fourth resolution input image in the CIEL*a*b* color space. In the second module,
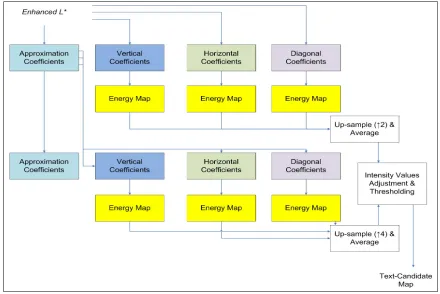
the text detection module uses wavelet analysis to generate a text-region candidate map which is
enhanced by applying a Run Length Encoding (RLE) technique for verification purposes. The
third module, photo detection, initially uses block-wise segmentation which is based on basis
vec-tor projection technique. Then, MRF with maximuma-posteriori(MAP) optimization framework
is utilized to generate photo map. Next, Hough transform is applied to locate lines in the fourth
module. Techniques for edge detection, edge linkages, and line-segment fitting are used to detect
strong-edges in the module as well. After those three classification maps are obtained, in the last
vii
the intersection regions and merge into one classification map with K-Means clustering. The
pro-posed technique is tested on several hundred images and its performance is validated by utilizing
Confusion Matrix (CM). It shows that the technique achieves an average of∼85% classification accuracy rate in text, photo, and background regions on a variety of scanned documents like
ar-ticles, magazines, business-cards, dictionaries or newsletters etc. More importantly, it performs
independently from a scanning process and an input scanned document (RGB or gray-scale) with
Dedication . . . iii
Dedication . . . iv
Acknowledgements . . . v
Abstract . . . vi
1 Introduction . . . 1
1.1 Objectives and Motivations . . . 1
1.2 Literature Review . . . 2
1.3 Contributions . . . 6
1.4 Potential Applications . . . 8
1.4.1 Content based document retrieval . . . 8
1.4.2 Optical character recognition . . . 10
1.5 Thesis Outline . . . 10
2 Background . . . 12
2.1 Wavelet Transform . . . 12
2.1.1 Fundamentals of wavelet transform . . . 12
2.1.2 Multiresolution analysis . . . 19
2.2 Markov Random Field Modeling . . . 21
2.2.1 Bayes estimation . . . 22
2.2.2 Modeling conditional probability distribution (likelihood) function . . . 24
2.2.3 Gibbs distribution . . . 25
2.2.4 Iterated conditional modes . . . 27
2.3 Hough Transform . . . 28
2.4 Run-Length Encoding Algorithm . . . 29
3 Proposed Algorithm . . . 31
3.1 Pre-processing Module . . . 31
3.1.1 Filtering and image re-scaling . . . 32
3.1.2 Color space transformation . . . 33
3.1.3 Gamma correction . . . 35
3.1.4 Morphological operations - dilation . . . 36
3.2 Text Detection Module . . . 36
3.2.1 Wavelet decomposition and energy sub-module . . . 36
3.2.2 Text region confirmation . . . 39
3.3 Photo Detection Module . . . 41
3.3.1 Block-wise segmentation based on basis vectors projection . . . 41
3.3.2 Markov random field: MAP segmentation . . . 45
3.3.3 Photo map enhancement process . . . 49
3.4 Strong Edge / Line Detection Module . . . 50
ix
3.5 Map Combination . . . 51
3.5.1 Training/Testing maps for text and photo regions . . . 52
3.5.2 Feature extraction . . . 53
3.5.3 K-Means algorithm minimizing Euclidean distance . . . 55
4 Results and Discussions . . . 57
4.1 Performance Analysis and Evaluation . . . 66
4.1.1 Confusion matrix (CM) . . . 66
4.1.2 Quantitative evaluation of the proposed classification technique on differ-ent type of scanned documdiffer-ents . . . 68
4.2 Comparison with the techniques in literature . . . 75
4.2.1 Comparison to work done by Duonget al.[26] . . . 75
4.2.2 Comparison to work done by Won [39] . . . 77
5 Conclusions and Future Work . . . 79
4.1 Sample confusion matrix. . . 66
4.2 Confusion matrix for ARTICLE document . . . 69
4.3 Confusion matrix for NEWSLETTER document . . . 70
4.4 Confusion matrix for CORRESPONDENCE document . . . 72
4.5 Confusion matrix for ADVERTISEMENT document . . . 73
4.6 Confusion matrix for MOD documents . . . 74
4.7 Confusion matrix for OTHER documents . . . 74
4.8 Performance comparison between Duonget al.[26] and Our classification technique 76
L
IST OF
F
IGURES
1.1 A hierarchy of document processing. [1] . . . 1
1.2 Overview of the proposed approach. . . 6
1.3 Content based document processing applications. . . 9
1.4 Optical character recognition system. . . 11
2.1 Replacing one scaling function instead of infinite a set of wavelets [41]. . . 17
2.2 Splitting 1-D signal spectrum with an iterated filter bank [42]. . . 18
2.3 Multiresolution image representation [43]. . . 20
2.4 Neighborhood systems and their associated clique types [50]. . . 26
2.5 The line parameters inθ−ρplane [52]. . . 28
2.6 Run length encoding along the X-axis, along the Y-axis, in 2-D tiles and in zig-zag fashion [53]. . . 30
3.1 Flowchart of the proposed algorithm. . . 31
3.2 Block diagram of the pre-processing module. . . 32
3.3 Scheme of image re-scaling. . . 32
3.4 CIEL*a*b* color space [58]. . . 33
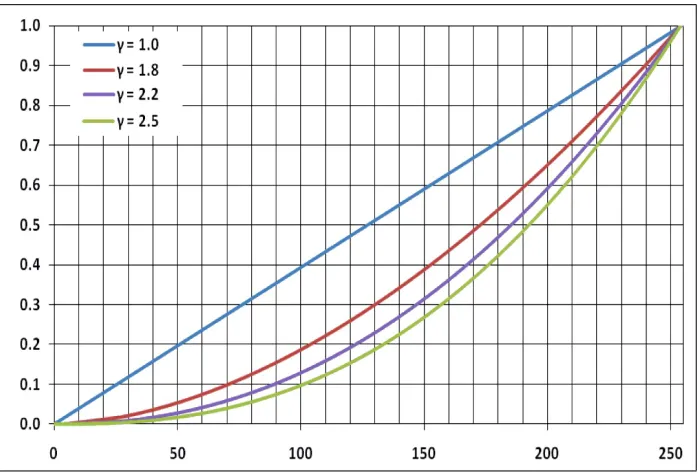
3.5 Plots for various values ofγ. . . 35
3.6 Block diagram of the wavelet decomposition and energy maps sub-module. . . 38
3.7 Initial text region classification. . . 39
3.8 Example of vertical and horizontal projections of text region. . . 40
3.9 Intermediate results of the algorithm. . . 40
3.10 Block diagram of photo detection module. . . 41
3.11 Basis vectors for the determination of the best fit for the region in the block [39]. . 43
3.12 Block-wise segmentation based on basis vectors projection. . . 45
3.13 Segmentation maps before post-processing. . . 48
3.14 Photo map enhancement process. . . 49
3.15 Segmentation maps for MRF-MAP and enhancement process. . . 50
3.16 Block diagram of the map combination module. . . 52
3.17 Map combination process . . . 52
3.18 Train maps. . . 53
3.19 Standard deviation of the train maps in horizontal direction. . . 54
3.20 Standard deviation of the train maps in vertical direction. . . 54
3.21 Entropy of the train maps. . . 55
3.22 K-Means. . . 56
4.1 Results for line detection:(a) Original image, (b) enhanced L channel, (c) pixel-and (d) box-wise final classification map. . . 58
4.2 Results for line detection: Document (a) without image, (b) and (c) with strong edge/line, text and photo. . . 60
4.3 Final classifications map for:(a) ADDRESS-LIST, (b) ADVERTISEMENT, (c) ARTICLE, (d) BUSINESS-CARD and (e) CHECK scanned document. . . 61
4.4 Final classification map for: (a) COLOR SEGMENTATION, (b) CORRESPON-DENCE, (c) DICTIONARY, (d) FORM and (e) MANUAL scanned document. . . 62
4.5 Final classification map for: (a) NEWSLETTER, (b) OUTLINE, (c) PHONE-BOOK, (d) STREET-MAP and (e) TERRAIN-MAP scanned document. . . 63
4.6 Before map combination module. . . 64
4.7 After map combination module. . . 65
4.8 Final classification map for three ARTICLE documents. . . 69
4.9 Final classification map for three NEWSLETTER documents. . . 70
4.10 Final classification map for three CORRESPONDENCE documents. . . 71
4.11 Final classification map for three ADVERTISEMENT documents. . . 72
xiii
4.13 Final classification map for OTHER documents. . . 75
1.1
Objectives and Motivations
In the late 1980’s, document databases started to shift from hard-copy to soft-copy with the
ap-pearance of fast computers, large computer memories, and inexpensive scanners. They were stored
digitally in large document databases and called document images. In the beginning of the 1990’s,
methodologies, algorithms and systems were invented and developed for document image
analy-sis in order to extract information from document images in a “human-like” fashion. Extracting
information from a document refers to locating and extracting line, photo or text regions
[image:15.612.97.559.355.579.2]hierarchi-cally [1]. A hierarchy of document processing is illustrated in Fig. 1.1.
Fig. 1.1:A hierarchy of document processing. [1]
Today, the outcomes of research in document processing can be seen in many applications.
Object-oriented rendering, extracting flowcharts and body diagrams from a scanned document for
computer storage, document retrieval, query-images/texts and optical character recognition (OCR).
Specifically, the millions of old paper volumes now in libraries will be replaced by computer
2
files in document images that can be searched for content. Signatures will be analyzed in the
software-world for verification and security access [1]. These type of document analysis systems
will enable to extract information without depending on the file formats. Automated mail-sorting
and address recognition will become quicker and more accurate with text information extraction in
the document. The number of mis-filed, mis-shelved or lost of material will be decreased by these
document analysis techniques [2]. These examples serve as motivations for exploring potential
solutions for document image analysis.
1.2
Literature Review
Document/Page segmentation is one of the topics researched in document processing to achieve
homogeneity criteria for the connected regions of text, graphics and space. It is preferably used as
an initial step for document structure analysis such as OCR [3, 4, 5] and document retrieval [6, 7, 8]
[see also [9, 10] for comprehensive surveys in OCR and document retrieval].
There are three-main approaches in document segmentation. The top-down approach looks for
global information on the page, such as black and white stripes, for the purpose of splitting the
document image into blocks, blocks into lines, and lines into words. Fisher et al. presented the
automatic segmenting of a document image which was enhanced by applying morphological
op-erations, skew correction and adaptive filtering [11]. Then, the process continued with Run length
encoding (RLE) algorithm to calculate the connected components’ locations and statistics.
Es-positoet al.utilized the page layout feature which consists of geometrical characteristics in order
to segment the image [12]. It was based on inductive generalization of a document layout style.
Haralick et al. extended the scope of algorithm in [12] by adding various document images in
the testing stage [13]. Automated text block extraction with image skew correction, which was
based on a growing procedure guided by local information in complicated layout documents, was
proposed by Zlatopolsky [14]. Sharma et al.also used a top-down approach by finding
image [15]. Shi et al. proposed a top-down approach by using local connectivity property for
document page segmentation [16].
The bottom-up approach starts with local information such as connected components in a
spe-cific region or block and first locates the words, then merges the words into lines, the lines into
blocks and the blocks into columns. Wahl et al.utilized from run length algorithm to divide the
page into rectangular regions [17]. Then, meaningful features are computed in these regions and
a linear adaptive classification scheme is constructed to discriminate text regions from others. The
Lam’set al.study employed a method which segments a newspaper document image into labeled
macro zones and filters connected components to determine the content of the zones as text or
non-text [18]. The drawback of [17] and [18] was that segmentation was achieved upon the assumption
that the document image consists of rectangular areas. Antonacopouloset al.proposed a technique
that used the structure of the background white space, surrounded by the printed zones [19]. The
benefit of the approach in [19] was that it did not make any assumptions about the shape or
struc-ture of the regions as opposed to [17] and [18]. It was capable of detecting complex shape regions
more accurately than the existing methods. Drivaset al.incorporated a bottom-up document
seg-mentation algorithm [20]. It utilized connected rectangular block based initial segseg-mentation and
then extracted simple histogram based features in order to determine textual and non-textual zones
in a document image. Simonet al.developed and generalized the Kruskal’s algorithm [21] and
ap-plied a special distance-metric between the components to construct a physical page structure [22].
The study reflected all the significant advantages of bottom-up systems such as being independent
from text spacing and different block alignments. Jain et al.used traditional bottom-up approach
based on the connected component extraction to achieve page segmentation and region
identifica-tion [23]. Grover et al.extracted textual regions separating from the graphics portion by utilizing
sharp edge features which were missing in image regions [24].
The hybrid approach achieves the document segmentation and classification based primarily
4
are computed. Jain et al. proposed a segmentation method for document images based on a
mul-tichannel filtering approach to texture segmentation [25]. Two-dimensional Gabor filters were
used to extract texture features for text and non-text (image) regions. Duong et al. presented a
document analysis system which segments the image as text and non-text zones [26]. The
method-ology retrieved a region of interest (ROI) from grey-scale document images via cumulative
gradi-ent considerations. Then, geometric and texture features are utilized in classification. In Randen
and Husoy’s study [27], a critically sampled filter bank was applied to the image, and local
sub-band energy features were extracted to classify text/image regions by using K-Means algorithm.
Fletcher et al. introduced a methodology which generated connected components [28]. Next, it
grouped the connected components by using Hough transform into logical character strings in
order to separate text from graphics. Tombre et al. extended the work in [28] to make it more
applicable for graphics-rich documents by extracting features from an histogram of the connected
components, filtering and thresholding [29]. Linet al.utilized five Grey Level Co-occurrence
Ma-trix (GLCM) that sub-divided the image into blocks to classify contents of document images as
graphics, text and space [30]. Then, according to those features, connected blocks are clustered by
applying K-Means.
Instead of selecting the features manually, they could be extracted by automatically which
was presented in the work by Wang et al. [31]. This approach was an efficient and forward
selection algorithm that iteratively constructed one linear feature at a time until a desired error
rate was achieved. Although the proposed approach was applicable to many databases in
liter-ature, it was strongly data-driven and restricted to linear features. They improved their work in
Wang’s et al. study by extracting more features and evaluating on different document databases
which contain images, graphics, handwriting and machine-printed text regions [32].
All the studies mentioned above solve the segmentation or classification problem in an
unsuper-vised way. In other words, they did not require anya-prioriinformation to achieve segmentation
end of the 80’s and the beginning of 90’s was the computation time issue. The training phase,
not surprisingly, was very time consuming stage with 90’s processor technology. However, this
computation time issue began to be addressed with 2000’s processor technology. Therefore, there
was also research literature involving supervised segmentation or classification to solve the page
segmentation problem. Chaudhury et al. presented a model-guided segmentation and document
layout extraction scheme [33]. The proposed system extracted features which consist of contextual
information and spatial configuration of a given document. It learned the relations between the
lay-out specifications using Hierarchical Conditional Random Fields (CRFs). Baird et al.developed
an automatically trainable methods for grey level and color document images which first obtained
the pixel-wise features, trained them and then classified the regions by utilizing k-Nearest
Neigh-bor (k-NN) learning technique [34]. Zheng et al. proposed a novel approach by treating noise
as a separate class, modeling it based on selected features and classifying the text regions with
trained Fisher classifiers [35]. Besides using Fisher classifiers, layout structure was obtained by
using Markov Random Field (MRF) as a post-processing stage. Decision-tree classifiers and
self-organizing maps were employed in the work of Shin et al.by using “visual similarity” of layout
structure features such as content regions, column structures, relative point sizes of fontsetc. [36]
Kumaret al. developed a novel approach for text segmentation in document images by applying
globally matched wavelet filters [37]. The framework broadened to detect picture and background
components in the image by combining multiple two-class Fisher classifiers and MRF
formulation-based pixel labeling scheme to utilize from contextual information. In the core of the methodology,
established by Caponettiet al., neuro-fuzzy supervised technique was incorporated to perform the
segmentation [38]. Initial segmentation was achieved by multi-scale processing, and a set of
clas-sical morphological operators was utilized for merging the pixels into coherent text, graphics or
background regions. However, supervised techniques discussed above were computationally
6
1.3
Contributions
In this thesis, a new unsupervised document classification algorithm is proposed. The benefits of
the algorithm are the followings:
1) Robust classification for complex color and grey-scale scanned documents.
2) Independence from a type of scanned documents.
3) Utilization of both a textual map and a non-textual map to classify intersection regions of the
text and photo map.
4) A potential solution that meets the computational efficiency constraint for most practical
ap-plications.
5) Independence from a scanning technique.
An overview of the proposed approach is shown in Fig. 1.2. The algorithm starts with a
pre-processing module which applies image enhancements techniques such as image sizing, color
space conversion, gamma correction and morphological operation. Sizing is applied to reduce
the computation time and increase the speed to achieve the algorithm in real-time environment.
Color-space conversion gamma correction are applied to color and grey-scale scanned documents,
respectively [see Fig. 1.2]. As a final stage in pre-processing module, to enhance the text
compo-nents such as characters in text regions, dilation, called morphological operation, is performed on
lightness (L*) component of CIEL*a*b* color space, called enhanced L* channel. All the steps
in the pre-processing module mentioned above, are explained explicitly in Section 3.1. Three
dif-ferent modules follow the pre-processing stage to detect text, photo/image and strong edge/line
regions. The modules process the enhanced L* component of the image separately. The main core
of the photo detection stage relies on blockwise segmentation, proposed by Won [39], and MRF
-maximuma-posteriori(MAP) optimization segmentation. Wavelet decomposition [40] is utilized
to extract features and classify text regions in the document image. For confirmation purpose,
Run-Length Encoding (RLE) is applied to obtain a final text map. Strong edge/line regions are
extracted by employing the Hough transform on the enhanced L* channel. The resultant three
sep-arate classification maps are combined with the K-Means clustering to classify the blocks/pixels
either text, photo or strong edge/line and merge into one final map. Although it converges to a local
solution, it has low computationally complexity and provides satisfying result. The fundamental
concept and detailed explanation of the modules can be found in Background [see Chapter 2] and
Proposed Algorithm [see Chapter 3] chapters.
The aforementioned procedure is applied to both simple and complex background document
images. In addition, it provides a solution for both color and grey-scale scanned documents. The
proposed algorithm is entirely implemented in MATLABR
and tested on a large database of∼700 document images which are scanned with 300dots per inch (dpi). The performance evaluations
show that the proposed algorithm is robust and accurate enough for the applications discussed in
Section 1.4, and less computationally complexity.
The work discussed in this thesis is published in the following organizations.
1) M. S. Erkilinc, M. Jaber, E. Saber, and P. Bauer, "Page layout analysis for complex scanned
documents", SPIE Opt. Eng. + Apps. Conf.: Apps. of Digital Image Proc. XXXIV, 2011.
8
SPIE Newsroom, Electronic Imaging and Signal Processing.
1.4
Potential Applications
Document segmentation has been widely used in OCR, document retrieval process where an
ef-ficient memory consumption and a quick retrieval are required. In addition, database update and
efficient cartridge usage while printing the documents in different resolutions are other typical
application. The proposed methodology is developed for a commercial purpose emphasizing
per-formance time and accuracy. In this section, a few applications are presented which could utilize
the proposed algorithm.
1.4.1 Content based document retrieval
One of the objectives of document classification application, and of document image analysis in
general, is to recognize and extract text and graphic components for use by people throughout the
world. Today, imaging systems, particularly scanners, are used to store great numbers of document
images in databases so they can be retrieved. Additionally, different resolutions can be embedded
while printing the documents by extracting text and graphic regions. This provides a better and
more efficient print quality. A typical document retrieval framework and a methodology for better
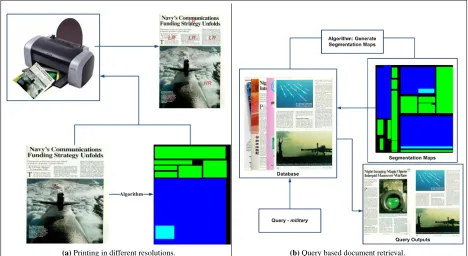
print quality, are demonstrated in Fig. 1.3.
The scanned document image printed is classified by using the proposed algorithm. Then, both
the classification map and the input image are sent to the printer to print the document image
in different resolutions. The proposed technique detects text, photo and strong egde/line regions.
While text regions are printed in low resolution (LR), photo and strong edge/line regions are printed
in high resolution (HR). The demonstration for the system is given in Fig. 1.3(a). There are five
text regions which cover almost half of the document, and one image which covers the rest of it
[see Fig. 1.3(a)]. By using low resolution to print the textual areas, a considerable amount of ink
(a)Printing in different resolutions. (b)Query based document retrieval.
Fig. 1.3:Content based document processing applications.
From a user perspective, high resolution is not required for text regions, because a reader or a
user does not need a high resolution to read them. The only requirement is that they are legible.
Since low resolution can meet this requirement, printing the regions in high resolution wastes ink.
On the other hand, photo and strong-edge/line regions should be printed in high resolution in order
to satisfy the user in terms of quality. The aim is to use printers more efficiently and prevent
cartridge or laser waste.
Furthermore, the same approach can be utilized for document retrieval, illustrated in Fig. 1.3(b)
in large databases. After classification is achieved, extracted components can be labeled with a
group name which best describes them. This yields to group the documents under the same group
name as well. The labeling process provides faster access to the documents in the database. In
other words, the several megabytes (MB) of raw data in the database can be culled in a much more
concise way by assigning semantic or logical description to the extracted components (textual and
graphical regions).
10
parts while the database stores the original document images with their classification maps. For
instance, over a million pieces of mail are handled in one day by the United States post office. The
proposed document classification method to perform sorting mail according to its image content
and/or address recognition (text content) would be especially useful for processing this volume of
mail more quickly, and accurately.
1.4.2 Optical character recognition
Two primary categories, presented in Fig. 1.1 sum up the entire field of document processing:
Textual processing deals with text zones (particularly achieving OCR) and finding columns,
para-graphs, text lines, and words. Besides this, graphical processing deals with images, photos, block
diagrams, tables and logos, etc. OCR is an electronic translation of scanned images of
handwrit-ten, typewritten or printed text into machine-encoded text. OCR techniques, presented in Fig. 1.4
below, are widely used in detecting and examining signatures at banks, converting books and
doc-uments into electronic files, or publishing text on a web-site.
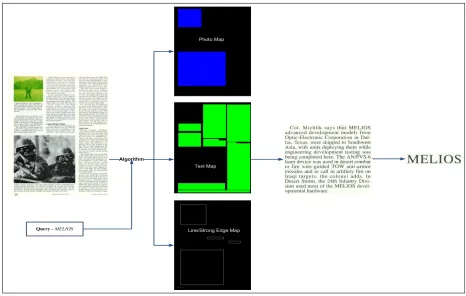
Three main modules, discussed in Chapter 3, generate three different classification maps. For
OCR, text map can be broken into paragraphs, words and text characters depending on the query.
For instance, the word “MELIOS” is considered as a query, and it is a military term. The hierarchal
order of how it is recognized is exhibited Fig. 1.4. The query can be anything as long as it can be
represented in a textual region. The framework is provided to edit the text, search for a word or
phrase, store it more compactly, and apply techniques such as machine translation, text-to-speech
and text mining to it.
1.5
Thesis Outline
The remainder of the thesis is organized as follows: Chapter 2, Background, a review of the
Fig. 1.4:Optical character recognition system.
methodology is introduced in Chapter 3 and consists of five sections: Pre-processing, Text
De-tection, Photo DeDe-tection, Line Detection and Map Combination. Section 3.1 explains the
pre-processing module that is performed before the main core of the algorithm to enhance the image,
increase accuracy of the algorithm and obtain lower computation time. Section 3.2, 3.3,and 3.4
describe how text, photo and strong edge/line map are obtained. Combination and merging
proce-dure of the maps are described in Section 3.5. Experimental results are presented and performance
of the segmentation algorithm is evaluated by confusion matrix methodology in Chapter 4.
C
HAPTER
2: B
ACKGROUND
This chapter clarifies some technical concepts, and provides technical background for the
algo-rithms that are employed in the proposed document classification technique. Wavelet transform
(WT), MRF, Hough transform and RLE algorithms, which are the main parts of text, photo and
strong edge/line detection modules, are discussed with their mathematical insight. First, wavelet
transform and MRF are discussed separately because of the individual roles they play in the art of
image processing. Moreover, the formulation of Hough transform and RLE algorithms, and how
they are applied to the images, is explained.
2.1
Wavelet Transform
In mathematics, a wavelet series is a representation of a square-integrable (real-or complex-valued)
function by certain orthonormal series generated by a wavelet. It is a powerful tool which can
de-compose a signal into various frequency bands. These bands are generally taken as horizontal,
vertical, and diagonal spatial frequency characteristics of the data. Basics of the wavelet transform
are presented in Section 2.1.1 to establish the foundation for multiresolution image representation.
Furthermore, discrete conversion of the theory and its performance in discrete domain are
ex-plained explicitly. Detailed mathematical analysis of initial multiresolution image representation
both in 1-D and 2-D, introduced by Mallat [41], is given in Section 2.1.2.
2.1.1 Fundamentals of wavelet transform
Every vector in a vector space can be represented as a linear combination of the basis vectors in
that vector space. This concept can be easily generalized to functions by replacing the basis vectors
with basis functions.
f(t) = X
k
µkφt(k), (2.1)
where f(t), andφt(k)the signal and basis function, respectively. µk is the corresponding basis
function coefficient. Furthermore, basis functions in any domain should both be orthogonal to span
the space completely and orthonormal for normalization purpose, as given in Eq. 2.2. Additionally,
it has sufficient properties for reconstruction, recovering the signal by inverse wavelet transform.
< f(t), g(t)> =Rb
af(t)g
∗(t)dt= 0,
< f(t), f(t)> =Rabf(t)f∗(t)dt= 1.
(2.2)
where∗denotes complex conjugation. According to the above definition of the inner product, the Continuous WT(CWT) can be written as the inner product of the signal and basis function(wavelet)
in Eq. 2.3.
CW TfΨ(τ, s) = ΓΨf(τ, s) =
Z b
a
f(t)Ψ∗τ,s(t)dt, (2.3)
where ΓΨ
f(τ, s) and Ψ(t) are the wavelet coefficient and mother wavelet, respectively. Mother
wavelet, defined in Eq. 2.4 , is the basic wavelet which is utilized to generate different wavelets by
scaling and translation operations [42].
Ψτ,s=
1
√
sΨ
t−τ s
, (2.4)
where s and τ are the scale and translation factors. The factor of s−1/2 stands for the energy normalization. Eq. 2.3 shows how a signal, f(t), is decomposed into a set of wavelets, Ψτ,s.
The variabless andτ are the new dimensions, scale and translation, after the wavelet transform. The expression for the CWT, given in Eq. 2.3, shows that the wavelet analysis is a measure of
similar frequency content between the wavelets, Ψτ,s, and the signal, f(t). CWT coefficients,
ΓΨ
f(τ, s), represent the degree of closeness of a signal to a wavelet. Thus, the inner product of a
wavelet and signal will give a relatively large number, corresponded to theΓΨf(τ, s)if the signal is represented better by the employed wavelet in the inner product operation in Eq. 2.3. As previously
14
and corresponding wavelets in the domain ofSandT, shown in Eq. 2.5 since WT is an invertible operation [42].
f(t) =
Z Z
s∈S τ∈T
ΓΨx(τ, s)Ψ∗τ,s(t)dτ dt. (2.5)
To enable the reconstruction without loss of information, square integrable functions (wavelets),
Ψ(t), should satisfy theadmissibility condition, given in Eq. 2.6.
F [Ψ(ω)] =
Z π
−π
|Ψ(ω)|2
|ω| dω =<+∞. (2.6)
In Eq. 2.6,F [Ψ(ω)]denotes for the Fourier transform (FT) of a wavelet. The admissibility condi-tion implies that the FT ofΨ(t)vanishes at the zero frequencies,i.e.
|Ψ(ω)| | ω=0
= 0. (2.7)
In other words, wavelets must have have a band-pass like spectrum. Eq. 2.7 also indicates that the
average value of the wavelet in the time domain must be zero,
Z ∞
−∞
Ψ(t)dt= 0. (2.8)
Therefore it must be oscillatory or awave. As shown in Eq. 2.3, the 1-D WT is fundamentally 2-D
because of the parameters, τ and s. Thus the 2-D WT is four-dimensional. The time-bandwidth product of the WT increases exponentially since the input signal is squared. Hence, a scale, denoted
bys, is added to ensure that the WT is decreasing rapidly [42].
Moreover, the wavelet function should have some smoothness and concentration in both time
and frequency domains. Regularity condition is explained by using the concept of vanishing
mo-ments. The wavelet transform, given in Eq. 2.3, can be defined by utilizing the Taylor series at
Γ(s,0) = √1
s
"
X
m=0
nf(m)(0)
Z tm
m!Ψ
t s
dt+O(n+ 1) #
, (2.9)
where f(m) is themth derivative of f and O(n + 1) stands for other orders in expansion. Also, moments of a waveletMmis defined in Eq. 2.10 as,
Mm =
Z
tmΨ(t)dt. (2.10)
So, Eq. 2.9 can be re-written by using Eq. 2.10,
Γ(s,0) = √q
s
f(0)M0s1+
f(1)(0)
1! M1s
2
+ f
(2)(0)
2! M2s
3
+· · ·+f
(n)(0)
n! Mns
n+1
+O(sn+2)
.
(2.11)
From the admissibility condition, it is already known that the0thmoment,M
0 = 0, so that Eq. 2.11
is simplified as shown in Eq. 2.12,
Γ(s,0) = √q
s
f(1)(0)
1! M1s
2+f(2)(0)
2! M2s
3+· · ·+f(n)(0)
n! Mns
n+1+O(sn+2)
. (2.12)
If a wavelet hasN vanishing moments, then the approximation order of the wavelet transform is also N since the moments up to Mn are very small values compared to N. Then, the wavelet
transform coefficients,Γ(s, τ), can diminish as fast assn+2for a smooth signal [44].
So far, the discussion has dealt with only continuous case. It is essential to convert it into
discrete case for practical purposes. Unlike continuous wavelets, discrete wavelets can only be
scaled and translated in discrete steps. This can be achieved by modifying the mother wavelet,
given in Eq. 2.4.
Ψæ,k(t) =
1 p
sjo
Ψ t−kτ0s
j
0
sj0
!
, (2.13)
16
on the dilation step. The effect of discretizing the wavelet is that the time domain is now sampled
at discrete intervals. s0 is usually chosen as 2 in order to correspond to the dyadic sampling for the sampling of a frequency axis. In the same manner, the translation factor,τ0, is assumed to be
1to have dyadic sampling of the time axis as well. These assumptions are reasonable for practical
applications involving computers [43].
A continuous signal can be represented as a series of discrete wavelet coefficients, called
wavelet series decomposition, but this decomposition is must be reversible. In other words, the
continuous signal can be reconstructed by its own wavelet series decomposed signals using its
own discrete wavelet coefficients. For stable reconstruction, the energy of the wavelet coefficients
should be bounded by two positive numbers, shown in Eq. 2.14.
Akfk2 ≤X j,k
|hf,Ψj,ki|2 ≤Bkfk2, (2.14)
wherekfk2is the energy off(t),A >0B <∞whileA, Bare independent off(t). In addition to stability condition, orthogonality and orthonormality conditions should be satisfied for
reconstruc-tion. As previously discussed, discrete wavelets can be represented in terms of mother wavelets so
that they can satisfy the condition given in Eq. 2.2 by adjusting scaling and translation constants in
mother wavelets [43].
Z
Ψj,k(t)Ψ∗m,n(t)dt =
1 ifj =m and k =n
0 otherwise
. (2.15)
If all the conditions mentioned above are satisfied, any type of signal can be reconstructed by the
linear combination of wavelet basis functions weighted by the wavelet coefficients.
Still, the process needs an infinite number of scaling and translation constants to calculate the
wavelet transform since the signal spectrum is infinite. Wavelets have a band-pass like spectrum
[see Eq. 2.7] which serves as a finite spectrum. Hence, an infinite set of wavelets with infinite
one wavelet can be seen as a band-pass filter, then a series of dilated wavelets can be seen as a
band-pass filter bank, which covers all spectra of the signal as well. The filter bank covers all
spectrum according to the center frequencies and the width of each filter spectrum depends on a
ratio, referred as thefidelity factor,Q. Eventually, if the wavelet transform is assumed to be a filter bank, then taking a wavelet transform of a signal can be considered as passing the signal through
this filter bank, calledsub-band coding. The output of each filter stage in the filter bank gives the
wavelet and scaling function transform coefficients. The technique discussed above is illustrated
in Fig. 2.1 [41].
Fig. 2.1:Replacing one scaling function instead of infinite a set of wavelets [41].
The sub-band coding scheme can be implemented in two ways. One approach is to build many
band-pass filters independently. Although it provides freedom in determining the width of each
band, all the filters should be designed separately to segment the spectrum into different frequency
bands. Thus, it requires extensive computation time. Another approach is to split the entire
spec-trum of the signal hierarchically into two equal parts, a low-pass and a high-pass part at each filter
stage. While the low-pass part is covering relatively flat or smooth surfaces, the high-pass part
cov-ers details such as edges or transition regions. As a continuation of the procedure, if the low-pass
part at a certain filter stage contains some details, not captured in the high pass part, the signal can
18
the signal or image. This explained scheme requires a design of only two filters. However, the filter
spectrum width is fixed in the process, unlike the previous coding scheme. The demonstration for
1-D signal is depicted in Fig. 2.2. In Fig. 2.2(a), splitting a 1-D signal spectrum into various bands
is represented and the corresponding filter operation is shown in Fig. 2.2(b).
[image:32.612.94.554.181.501.2](a)Spectrum representation. (b)Filter-bank representation.
Fig. 2.2:Splitting 1-D signal spectrum with an iterated filter bank [42].
In the previous paragraph, it is assumed that taking a wavelet transform of a signal is achieved
passing the signal through a filter bank. In this manner, while the wavelets provides the band-pass
bands, the scaling functions resultantly represent the low-pass band. Thus, a wavelet transform
is a sub-band coding scheme using a constant-Q filter bank. This decomposition technique is called multiresolution analysis, explained explicitly in Section 2.1.2, since it decomposes a signal
2.1.2 Multiresolution analysis
A set of wavelets can be estimated by employing a scaling function to cover the entire wavelet
spectra in discrete case as it is depicted in the previous section. In this purpose, if the scaling
function is treated as a signal, it can be decomposed into its wavelet components like in Eq. 2.16:
ψ(t) = X
j,k
Γ(j, k)Ψj,k(t). (2.16)
However, Eq. 2.16 still uses an infinite number of wavelets up to a certain scale j. If a wavelet spectrum is added to the scaling function spectrum, a new scaling function with a spectrum twice
as wide as the first is obtained. This expression is formulated in Eq. 2.17. The effect of this addition
can be expressed in terms of the first scaling function, shown in Eq. 2.16 by summing the second
scaling function with the first scaling function [41].
ψ(2jt) =X
k
hj+1(k)ψ(2j+1t−k). (2.17)
In Eq. 2.17, a set of wavelets can be also expressed in terms of the first scaling function so that a
set of wavelets in each decomposition level can be replaced by a translated scaling functions. The
wavelet at levelj can be written as;
Ψ(2jt) = X
k
gj+1(k)ψ(2j+1t−k), (2.18)
whereΨ(2jt)andg
j+1(k)are the wavelet and band-pass filter. Eq. 2.5 implies that a signal,f(t), can be expressed in terms of dilated (scaled) and translated wavelets up to a levelj−1. This yields the result that f(t)can be also expressed in terms of dilated and translated scaling function at a levelj.
Ψ(2jt) = X
k
gj+1(k)ψ(2j+1t−k) +
X
k
Γj−1(k)Ψ(2j−1t−k), (2.19)
where the first term, P
kgj+1(k)ψ(2
20
up to a levelj −1and the second term,P
kΓj−1(k)Ψ(2
j−1t−k), denotes the signal at levelj in
terms of wavelets. If the scaling functions,ψj,k(t)andΨj,k(t), are orthonormal to each other, then
the coefficients,λj−1(k)andΓj−1(k), can be found by using Eq. 2.20.
λj−1(k) =hf(t), ψj,k(t)i
Γj−1(k) = hf(t),Ψj,k(t)i
(2.20)
where the wavelet, Γj−1(k), and scaling function,λj−1(k), coefficients are expressed in a closed-form solution. By combining Eq. 2.17 and Eq. 2.18 with Eq. 2.20, open-closed-form solution can be
written as;
λj−1(k) =Pmh(m−2k)λj(m)
Γj−1(k) =Pmg(m−2k)Γj(m)
. (2.21)
These two equations indicate that the wavelet and scaling function coefficients on a certain scale
can be found by calculating a weighted sum of the scaling function coefficients from the previous
scale. Eq. 2.21 means that the weighting factors ofh(k)corresponds to a low-pass filter since the coefficients,λj(k), originates from the low-pass part of the splitted signal spectrum.
[image:34.612.92.549.447.658.2](a)Image representation (b)Filter-bank representation
The weighting factors of g(k) corresponds a high-pass filter since the coefficients, Γj(k),
origi-nates from the high-pass part of the splitted signal spectrum. From an digital signal processing
perspective, one stage of aniterated digital filter bank can be established by usingh(k)andg(k). In Fig. 2.3 above, implementation of the iterated digital filter bank is demonstrated by using 2-D
signal (image). In the figure, h(m −2k) and g(m −2k) in Eq. 2.21 are denoted as hL(k) and hH(k), respectively.
2.2
Markov Random Field Modeling
A random field is a 2-D sample sequence where each sample is a random variable. Each outcome
in the sample space produces a realization of the random field. MRF theory provides a useful and
consistent modeling for context dependent units such as image pixels. It characterizes the units
depending on the effect of neighborhood units using conditional MRF distributions. This theory
was established by Hammersley and Clifford [45] in 1971, and developed by Besag [46].
The joint distribution information is required for MRF modeling in most applications. However,
deriving the joint distribution from conditional distributions is a very difficult problem for MRFs.
Hence, Gibbs distribution (GD) is incorporated with MRFs, called MRF-GD theorem, to obtain the
joint distribution from conditional distributions. The theorem provides a mathematical convenience
in terms of statistical signal processing in applications such as image analysis [47].
The MRF theory is utilized to model aa-priori probability of context dependent patterns. A
particular MRF model favors its own labeled class of patterns by assigning larger probabilities than
other pattern classes. Maximuma-posteriori(MAP) probability is one of the most popular
statis-tical criteria for optimality. The MRF-MAP framework, introduced by Geman and Geman [48],
develops algorithms to solve various vision problems such as image and video processing using
probabilistic approach [49].
22
framework. The framework is constituted and the parameters are selected by using Bayes
for-mulation in which the objective function depends on the joint prior distribution of the labels, the
conditional probability of the observed data, and the probability of the observed data.
Section 2.2.1 outlines the fundamentals ofBayesestimation. The MRF-MAP modeling process
of the conditional probability of the observed data is discussed in Section 2.2.2, and Section 2.2.3
explains the joint prior distribution of the labels explicitly.
2.2.1 Bayes estimation
Bayes theorem is a fundamental theory in estimation theory. It points out that when both prior
distribution and the likelihood function of a pattern are known, the best estimation can be obtained
by Bayes labeling. The MAP optimization is a special case of the Bayes theorem. In Bayes
estimation, a risk is minimized in order to obtain the optimal estimate. The objective function,
risk, is defined as:
O(ˆx) = Z
xεF
C(ˆx, x)P(x|I)dx, (2.22)
whereI is the data,C(ˆx, x)is a cost function,P(x|I)is the conditional posterior distribution and
F is the 2-D field. By using the Bayes rule,P(x|I)can be calculated by using Eq. 2.23.
P(x|I) = p(I|x)P(x)
p(I) , (2.23)
whereP(x|I)isa-prioriprobability of labeling ofI, also referred as segmentation map in image processing,p(I|x)is thea-posterioriprobability or likelihood function ofxfor fixedIandp(I)is
thea-prioriprobability ofI, which is given and can be assumed as deterministic in the problem.
C(ˆx, x) =kxˆ−xk2. (2.24)
Second one, called(0−1), is given in Eq. 2.25,
C(ˆx, x) =
0 if kxˆ−xk ≤
1 otherwise
(2.25)
where > 0is any small constant. If Eq. 2.24 is placed in Eq. 2.22, the variance of the estimate can be writen as follows;
O(ˆx) = Z
xεF
kxˆ−xk2P(x|I)dx. (2.26)
The minimal variance estimate which is the mean of the posterior probability can be found by
letting δOδ(ˆˆxx) = 0,
ˆ
x= Z
xεF
xP(x|I)dx. (2.27)
For thecost function, the objective function becomes
O(ˆx) = 1−
Z
x:kxˆ−xk≤
P(x|d)dx, (2.28)
when→0. Furthermore, Eq. 2.28 can be approximated by
O(ˆx) = 1−ζP(x|d). (2.29)
whereζis the volume of the space containing all pointsxfor whichkxˆ−xk ≤. Minimizing the cost function, given in Eq. 2.29, corresponds to a maximization ofP(x|I);
ˆ
x=arg max
24
which is known as the MAP estimate. P(x|I)is proportional to the joint distribution, shown in Eq. 2.31 sincep(I)in Eq. 2.23 refers to an image whose probability is1,
P(x|I)∝P(x, I) = p(I|x)P(x). (2.31)
Then, the MAP estimate is equivalently found as follows:
ˆ
x=arg max
x∈F [p(I|x)P(x) ]. (2.32)
2.2.2 Modeling conditional probability distribution (likelihood) function
As mentioned in Bayes estimation section, P(x|I) is the posterior distribution of a MRF. The derivation of the distribution can start with a simple assumption. Let us assume that image surfaces
are flat, then joint prior distribution ofxcan be written as follows;
P(x) = 1
Qe
−E(x),
(2.33)
whereE(x) = P
i
P
j(xi−xj)
2is theprior energyfor a flat surface. The noise on this flat surface
can be also assumed as Gaussian noise, ωi = xi +ni, whereni ∼ N(µ, σ2)then the likelihood
distribution can be written as shown in Eq. 2.34.
p(I|x) = 1
QM
i=1
√
2πσ2e
−E(I|x), (2.34)
where
E(I|x) =
M
X
i=1
(ωi−xi)2/2σ2 (2.35)
is thelikelihood energy. SinceQ= QM
i=1
√
2πσ2 is the normalization factor, the posterior proba-bility in an optimization process becomes,
where
E(x|I) =E(I|x) +E(I)
=
M
X
i=1
(xi−ωi)2/2σ2i + M
X
i=1
(xi−xi−1)2 (2.37)
is the posterior energy. The MAP estimate is equivalently found by minimizing the posterior
energy function,
ˆ
x=arg min
x E(x|I). (2.38)
2.2.3 Gibbs distribution
Gibbs Distribution (GD) is first introduced by Derin et al. [50], and utilized to model an image
data. Since image is a discrete signal in computer applications, we are interested in discrete 2-D
random fields. It is defined over a finiteN1xN2 rectangular lattice of points (pixels) which is also defined asL={(i, j) : 1≤i≤N1, i≤j ≤N2}. As a second step, definition of a neighborhood system on lattice,L, and the associated cliques are presented below.
Definition1:A collection of subsets ofLcan be described as;
η ={ηi,j : (i, j)∈L, η0 ⊆L} (2.39)
which is a neighborhood system onLif onlyηi,j the neighborhood of pixel(i, j)is such that
1) (i, j)∈/ηi,j.
2) if(k, l)∈ηij, then(i, j)∈ηk,l for any(i, j)∈L.
Two types of a neighborhood system are presented in Fig. 2.4. The neighborhood system, nm, is
called themthorder neighborhood system. The image pixels at the edges can be ignored or can be
modeled with smaller cliques in GD unless the image is assumed periodic.
The associated cliques with a lattice-neighborhood pair (L,η) is defined as follows:
26
(a)1st order neighborhood system,η1, andη1clique types.
[image:40.612.95.538.88.367.2](b)2nd order neighborhood system,η2, andη2clique types.
Fig. 2.4:Neighborhood systems and their associated clique types [50].
1) cconsists of a single pixel, or
2) for(i, j)6= (k, l),(i, j)∈cand(k, l)∈cimplies that(i, j)∈ηkl. .
The collection all cliques of(L, η) is denoted byC = C(L, η). Definition3: A random field
X = {Xij}defined onLhas Gibbs Distribution(GD) or Gibbs Random Field(GRF) with respect
toηif its joint distribution is in the form of
P(X =x) = 1
Ze
−U(x),
(2.40)
where
U(x) =X
c∈C
Vc(x) energy function
Z =X
x
andVc(x)is the clique potential.Vc(x)which depends on the pixel values incis the only arbitrary
variable, sinceZ is a normalizing constant. In other words,Vc(x)is the only variable that will be
taken into account in optimazion/estimation process.
The physical meaning of the joint distribution in Eq. 2.40 is that the minimum energy function,
U(x), can be satisfied by the field which belongs to a same class labels. Although GD is an exponential distribution, a wide variety of distributions for random fields can be formulated as
GD by choosing the clique potential function,Vc(x), properly. A more detailed discussion can be
found in Besag [46].
2.2.4 Iterated conditional modes
Hence, Besag [51] proposes a deterministic algorithm called “iterated conditional modes” (ICM)
which maximizes local conditional probabilities iteratively. It uses the “greedy” strategy in the
iterative local maximization, and makes two basic assumptions; one based on the contents of
im-ages, and another based on the noise process. The first assumption is that neighboring pixels tend
to have the same values because images consist of regions that tend to have roughly the same pixel
values except the regions at the edges. There could be seen sharp pixel level changes at the edges
in the image. The benefit of this assumption is that it provides an opportunity to change the pixel
label, corrupted by noise, by utilizing its local neighborhood information. The second assumption
claims that each pixel is corrupted independently, and with some probability, generally considered
as Gaussian distribution. In other words, the noise does not corrupt two pixels dependently. If one
pixel label is changed by noise, any possible change in its neighbor has again the same probability.
Given the data,I, and the other labels, y(Sk−)[i], the algorithm iteratively updates each y(ik) into
yi(k+1) by maximizing the conditional probability,P(y(ik)|I, yS(k−)[i]), with respect toyi. From two
assumptions stated above, and theBayestheorem, discussed in Section 2.2.1, it follows that,
P(yi(k)|I, y(Sk−)[i])∝P(yi(k)|Ii, y
(k)
Ni) =p(Ii|y
(k)
i )P(y
(k)
i |y
(k)
28
wherey(Nk)
i denotes the current labeling in the neighborhood,N. Obviously, maximizing a
proba-bility of a specific region in the image,P(y(ik)|Ii, yN(ki)), is more preferable than a probability of the
entire image region,p(y|I), since it has less computationally complexity. In addition, maximizing Eq. 2.42 is equivalently minimizing posterior potential, given Eq. 2.43.
yki+1 ←arg min y(ik)
V(yi(k)|Ii, y
(k)
Ni), (2.43)
whereV is considered as the summation likelihood energy function, found in Eq. 2.34, and poten-tial energy function, shown in Eq. 2.40.
2.3
Hough Transform
The set of all straight lines in an image plane,x−y, forms a two-parameter family. An arbitrary straight line can be described by a single point in the parameter space, assuming that the parameter
family is fixed. The parametrization, given in Eq. 2.44, defines a straight line by specifying its
angle,θ, and its algebraic distance,ρ, from the origin.
ρ(θ) =xcos(θ) +ysin(θ), (2.44)
whereθ is defined in[0, π). Every line inx−y plane can be mapped to an unique point inθ−ρ
plane. It is also demonstrated in Fig. 2.5.
Suppose that a set of straight lines that fits into a set of {(x1, y1),· · ·,(xn, yn)} of n points
wants to be found. The point,(xj, yj), is transformed into the sinusoidal curves in theθ−ρplane
defined in Eq. 2.44 by replacing(xj, yj)instead of(x, y). Hence, the problem of detecting collinear
points can be converted to the problem of finding concurrent curves [52]. In summary, 1)a point
inx−yplane corresponds to a sinusoidal curve in theθ−ρplane and2)a set of points constitutes a straight line inx−yplane correspond to curves passing through a common point inθ−ρplane. Since Hough transform is a reversible process,1)and2)properties run in both ways.
2.4
Run-Length Encoding Algorithm
A run-length encoding (RLE) algorithm has been first introduced by Wahlet al.in order to detect
long vertical and horizontal white lines in document images [53, 54]. It is improved and utilized to
compress the data by Wonget al.[55]. The algorithm is supported by bitmap files such as.tiff, .pcx
or .bmp. It can be used to extract information from scanned documents to confirm the
segmenta-tion of candidate text regions as a post-processing stage [see [56] and [57] for further explanasegmenta-tion].
It is also utilized to create databases by assisting in encoding and converting the images/texts in
digital documents into computer-processable form. The compression or encoding scheme does
not depend on the input’s information content. However, its content affects the compression
ra-tio. The significant advantage for RLE algorithm is that it is easy to implement and requires less
computation time. Thus, it is preferable to using a complex compression algorithm, or applying no
compression technique to an image.
The basic RLE algorithm is applied to a binary sequence in which black pixels are represented
by0’s and white pixels by1’s. The binary input sequences,x, is converted into an output sequence,
yaccording to two rules.
1- 0’s in the input are changed to1’s inyif the number of adjacent0’s is less than or equal to a thresholdC.
30
For instance, withC= 6 the sequence x is mapped into y as follows:
x: 0 0 0 0 0 1 1 1 1 0 0 0 0 0 0 0 1 1 1 1 1 1 1 1 0 1 0 1 0 0 0 1 1,
y: 1 1 1 1 1 1 1 1 1 0 0 0 0 0 0 0 1 1 1 1 1 1 1 1 1 1 1 1 1 1 1 1 1.
To merge into a better segmentation map, it is the best if neighboring black/white zones are
linked or separated according to the threshold, C. The threshold value depends on the resolution level. The same technique can also be applied to a document image as a column by column
operation, since in some cases the vertical spacing information might be as useful as the horizontal
spacing information when determining the text regions.
There are various run-length encoding styles. In a row-by-row operation, the algorithm treats
the image as a 1-D data map, rather than as a 2-D data map by starting at the upper left corner and
proceeding from left to right across each scan line to the bottom right corner of the map, shown
in Fig. 2.6. Alternatively, it can be encoded by starting from the left upper corner and proceeding
along the columns, or converting into 2-D tiles, or following a diagonal direction in zig-zag fashion
[image:44.612.181.476.414.677.2][see Fig. 2.6].
We propose a page layout classification algorithm that takes RGB or grey-scale image as an input.
The algorithm starts by a pre-processing module for filtering, image re-sizing, color space
trans-formation, morphological operation and gamma correction which are utilized to limit artifacts
because of re-sampling, reduce computation time, eliminate noise, and enhance text characters
and illumination effects. Gamma correction is applied to the input grey-level image. If the input
image is colored, a color space conversion stage in the pre-processing module transforms the
im-age from RGB color space to CIEL*a*b* space. Then, the lightness channels (L*) is used by the
text, photo and line/strong edge detection modules generate three different maps. As a last step,
K-Means clustering algorithm is utilized to combine these three maps into one single page layout
classification map. A flowchart of the proposed algorithm is shown in Fig. 3.1.
Fig. 3.1:Flowchart of the proposed algorithm.
3.1
Pre-processing Module
This module has different stages for low pass filtering, image re-scaling, color space
transforma-tion, morphological operation and gamma correction. The scanned document can be a colored or
grey-level image. The objectives of the pre-processing module are to prevent aliasing, reduce
com-putation time, eliminate noise and illumination variations and enhance the edges in text regions. A
32
block diagram of the module is given in Fig. 3.2.
Fig. 3.2:Block diagram of the pre-processing module.
3.1.1 Filtering and image re-scaling
In this study, a typical document size8,5×11inch is used. It is scanned with300dots per inch (dpi) which yields an input image of the size3300×2600pixels. This technology provides a high resolution image which is advantageous in document classification applications. A drawback
how-ever is that it causes the entire process to be computationally expensive. To offset this, the image
is down-sampled by a scale factor,k = 0.25using “Bi-cubic interpolation”. Before interpolation,
11×11pixel sized low-pass filter is applied to reduce the effect of ripple patterns that result from aliasing during down-sampling. This limits the impact of aliasing on the output image, and
mini-mizes the artifacts that might occur. In bi-cubic interpolation, the output pixel value is computed
by weighting the average of the pixels in the nearest 4-by-4neighborhood. The scheme of image
re-scaling step is presented in Fig. 3.3.
3.1.2 Color space transformation
In 1976, the Commission International de lÉclairage (CIE) proposes CIEL*a*b* color space which
is a uniform color space, to model the human perception of color, and to provide a standard scale
for comparison of color values. This color space system is often used in the quality control of
colored products since it is based on human color perception [58]. For instance, if the color of a
production sample is detected in the CIEL*a*b* color space, color differences in the production
sample can be compared with the predetermined standards.
In a uniform color, the differences between points plotted in the color space correspond to
visual differences between colors plotted. It is designed in a cube form. The L* axis lies from top
to bottom between0, representing black, and100, representing a perfect light diffuser. Thea*and
b*do not necessarily lie between specific numbers. +aand-ais red and green. +band-bis blue
and yellow. The colors in the color space can be considered as the combinations of red and yellow,
red and blue, green and yellow, and green and blue. 3-D coordinate system is introduced in order
to determine the exact combination of these colors in a product.The configuration of the coordinate
[image:47.612.228.424.452.622.2]system is depicted in Fig. 3.4 below.
Fig. 3.4:CIEL*a*b* color space [58].
Color space transformation is applied to the original scanned document when it is scanned in
34
to provide perceptual uniformity. It conforms to many digital image manipulations better than the
RGB space in image sharpening and artifacts removal. Besides this, the color components (a*and
b*) can be isolated by employing only L* component since CIEL*a*b* color space transformation
separates the color and lightness information.
In this study, the down-sampled image is transformed to the CIEL*a*b* color space where the
only L* component is used in the proposed algorithm. The color transformation which is described
from Eq. 3.1 to Eq. 3.3, can be achieved by first transforming the image from RGB to CIEXYZ
space, given in Eq. 3.1, and then from CIEXYZ to CIEL*a*b* space as shown in Eq. 3.2 and 3.3.
This transform is based on ITU-R Recommendation BT.709 using the D-65 white point reference.
The error in transforming from RGB to CIEL*a*b is approximately10−5.
X Y Z =
0.412 0.357 0.180 0.212 0.715 0.072 0.019 0.119 0.950
R G B . (3.1)
After RGB to CIEXYZ conversion is performed, the components of the CIEL*a*b* color space
can be computed by
L= 116f(Y /Yn)−16
a= 500[f(X/Xn)−f(Y /Yn)], (3.2)
b= 200[f(Y /Yn)−f(Z/Zn)]
where
f(t) =
t1/3 if t > 6 29 3 1 3 29 6 2
t+294 otherwise
. (3.3)
In Eq. 3.3,Xn, YnandZnare the CIEXYZ color space tristimulus values of the D-65 white point
3.1.3 Gamma correction
The RGB to CIEL*a*b* color space conversion has an inherent gamma correction. Therefore, to
simulate similar behavior for gray-scale scanned document, a gamma correction process is applied.
It is performed on gray-level scanned documents to eliminate their illumination variances, and to
suppress the noise at the background region. In general, the gamma correction process, a nonlinear
operation as shown in Eq. 3.4, takes linear light information (video or still imagery)
![Fig. 1.1: A hierarchy of document processing. [1]](https://thumb-us.123doks.com/thumbv2/123dok_us/111203.10505/15.612.97.559.355.579/fig-a-hierarchy-of-document-processing.webp)
![Fig. 2.2: Splitting 1-D signal spectrum with an iterated filter bank [42].](https://thumb-us.123doks.com/thumbv2/123dok_us/111203.10505/32.612.94.554.181.501/fig-splitting-d-signal-spectrum-iterated-lter-bank.webp)
![Fig. 2.3: Multiresolution image representation [43].](https://thumb-us.123doks.com/thumbv2/123dok_us/111203.10505/34.612.92.549.447.658/fig-multiresolution-image-representation.webp)
![Fig. 2.4: Neighborhood systems and their associated clique types [50].](https://thumb-us.123doks.com/thumbv2/123dok_us/111203.10505/40.612.95.538.88.367/fig-neighborhood-systems-associated-clique-types.webp)
![Fig. 2.6: Run length encoding along the X-axis, along the Y-axis, in 2-D tiles and in zig-zag fashion [53].](https://thumb-us.123doks.com/thumbv2/123dok_us/111203.10505/44.612.181.476.414.677/fig-run-length-encoding-axis-axis-tiles-fashion.webp)
![Fig. 3.4: CIEL*a*b* color space [58].](https://thumb-us.123doks.com/thumbv2/123dok_us/111203.10505/47.612.228.424.452.622/fig-ciel-a-b-color-space.webp)