R E S E A R C H A R T I C L E
Open Access
DNA methylation signatures in cord blood
associated with maternal gestational weight gain:
results from the ALSPAC cohort
Eva Morales
1,2,3,4, Alexandra Groom
5,6, Debbie A Lawlor
5,6and Caroline L Relton
1,5,6*Abstract
Background:Epigenetic changes could mediate the association of maternal pre-pregnancy body mass index (BMI) and gestational weight gain (GWG) with adverse offspring outcomes. However, studies in humans are lacking. Here, we examined the association of maternal pre-pregnancy BMI and GWG in different periods of pregnancy with cytosine-guanine (CpG) dinucleotide site methylation differences in newborn cord blood DNA from 88 participants in the Avon Longitudinal Study of Parents and Children (ALSPAC) cohort using the Illumina GoldenGate Panel I. Pyrosequencing was used for validation of the top associated locus and for replication in 170 non-overlapping mother-offspring pairs from the ALSPAC cohort.
Results:After correction for multiple testing greater GWG in early pregnancy (between 0 to 18 weeks of gestation) was associated with increased DNA methylation levels in four CpG sites atMMP7,KCNK4,TRPM5andNFKB1genes (difference in methylation >5% per 400 g/week greater GWG) (q values 0.023 -0.065). Pre-pregnancy BMI and GWG in mid- or late pregnancy were not associated with differential DNA methylation at any CpG site. Pyrosequencing showed that greater GWG in early pregnancy was associated with increased DNA methylation levels at the top associated CpG site atMMP7, although association did not reach statistical significance (p = 0.302). Greater GWG in mid- (p = 0.167) and late-pregnancy (p = 0.037) were also associated with increased DNA methylation levels at the MMP7CpG site. In addition, newborns of mothers who exceeded the IoM-recommended GWG had higher DNA methylation levels at theMMP7CpG site than those of mothers with IoM-recommended GWG (p = 0.080). We failed to replicate findings.
Conclusions:Greater GWG in early pregnancy was associated with increased methylation at CpG sites atMMP7, KCNK4,TRPM5andNFKB1genes in offspring cord blood DNA. The specific association of GWG in early pregnancy with the top associated CpG site atMMP7was not validated using Pyrosequencing and it did not replicate. However, given the potential functional relevancy of the four identified loci, we advocate further exploration of them in larger studies.
Keywords:DNA methylation, Epigenetics, Gestational weight gain
Background
Greater maternal pre- or early- pregnancy body mass index (BMI) and gestational weight gain (GWG) have been shown to be associated with health outcomes in offspring, including increased birth weight [1,2], im-paired cognitive development and behavioral problems
[3,4], increased adiposity and adverse cardiometabolic traits [5-13]. The biological mechanisms underpinning these associations remain elusive. Potential mechanisms may include genetic factors, shared postnatal environ-ment, as well as intrauterine metabolic programming, possibly through epigenetic mechanisms [13,14]. With respect to potential intrauterine mechanisms the main exposure is greater maternal adiposity during pregnancy, and thus one might expect a specific association of GWG in early pregnancy, when the contribution of ma-ternal fat deposition is greater than that of fetal weight
* Correspondence:caroline.relton@ncl.ac.uk
1Institute of Genetic Medicine, Newcastle University, Newcastle upon Tyne,
NE1 3BZ, Tyne and Wear, UK
5MRC Integrative Epidemiology Unit at the University of Bristol, Bristol, UK
Full list of author information is available at the end of the article
or other GWG contributions in later periods, and little or no association of GWG in mid or later pregnancy with offspring outcomes [8,14]. In relation to offspring adiposity and cardiometabolic outcomes results from the cohort used in this study support this expectation [8].
To our knowledge only one study in humans has ex-amined the association of maternal pregnancy adiposity with offspring DNA methylation patterns. In that study, cord blood white cell DNA methylation was compared between 25 offspring born before their mothers had undergone bypass surgery for severe obesity with 25 matched siblings born after marked weight loss by their mothers following bypass surgery, using the Illumina HumanMethylation450 BeadChip array [15,16]. Altered methylation and gene expression profiles of genes with known glucose-metabolic and inflammatory related functions were identified between those offspring born after their mothers surgery compared to those born before [15,16]. Recently a study conducted in African-American population has reported maternal pre-pregnancy BMI to be associated with offspring cord blood DNA methylation levels of the CpG sites in genes involved in a broad array of chronic diseases including cancer and cardiovascular diseases [17]. However, whether similar associations would be found between maternal GWG in humans is currently unknown. Nonetheless evidence from animal models strongly supports an effect of greater maternal pregnancy adiposity on offspring epigenome. For example, gene expression and DNA methylation patterns at loci involved in adipocyte commitment have been shown to be perturbed in rodent models of maternal obesity and overfeeding during pregnancy [18,19].
We hypothesize that maternal pre-pregnancy BMI and GWG, specifically in early pregnancy, could influence risk of adverse health outcomes in offspring by inducing epigenetic changes. Thus, we aimed to examine whether maternal pre-pregnancy BMI and GWG in different periods of pregnancy were associated with epigenetic marks in newborns, in terms of gene-specific cord blood DNA methylation, and to compare the early pregnancy GWG associations with mid- and late-pregnancy GWG to test whether there was any evidence of specific early pregnancy associations. Our analyses were undertaking in a discovery sample and then in a replication sample, both taken from a large, longitudinal UK cohort of mothers and their offspring.
Method
Discovery and validation study
Study population
Data were available from participants in the Avon Longi-tudinal Study of Parents and Children (ALSPAC), a pro-spective, population-based mother-child cohort study that recruited over 14 000 pregnant women resident in
Avon, UK, between 1991 and 1992 (http://www.alspac. bristol.ac.uk) [20,21]. A subset of 96 children from the ALSPAC cohort was selected for analysis of DNA methylation at Cytosine-Guanine (CpG) dinucleotide sites in DNA extracted from cord blood samples. Sam-ples used in this study had been analyzed as part of a study of maternal exposure to paracetamol, as described in previous literature [22], and were broadly representa-tive of the ASPAC cohort. Of the 96 mother-offspring pairs with methylation data available, complete data on maternal pre-pregnancy BMI, GWG and potential con-founders were available for 88 pairs.
Maternal pre-pregnancy BMI and GWG
Six trained research midwives abstracted data from ob-stetric medical records for the entire ALSPAC cohort. Obstetric data abstractions included every measurement of weight entered into the medical records and the corresponding gestational age and date. All pregnancy weight measurements (median number of repeat mea-surements per woman, 10; range, 1, 17) were used to develop a linear spline multilevel model (with 2 levels: woman and measurement occasion) relating gestational age to weight. Using the entire cohort of women with term pregnancies (≥37 weeks of gestation) fractional polynomial curves were fitted to the data to obtain the average shape of the trajectories of GWG with gesta-tional age (for full statistical methodological details see [8]). These were used to determine the approximate positions of knots (indicating changes in slope) in linear spline random effects models with GWG as outcome and gestational age in weeks as the exposure. The knots produced from the modelling resulted in 4 variables: Pre-pregnancy weight (kg), change in weight between 0 and 18 weeks (kg/week), change in weight between 19 and 28 weeks (kg/week), and change in weight between 29 weeks and birth (kg/week). Pre-pregnancy body mass index (BMI) (kg/m2) was based on the mother’s self-reported weight before pregnancy and maternal report of height at their first questionnaire assessment (~12-18 weeks gestation) (results were identical for predicted pre-pregnancy weight with the use of multilevel models) [8]. To allocate women to Institute of Medicine (IoM) GWG categories (less than recommended, recommended, or more than recommended), we used weight measure-ments from the obstetric notes and subtracted the first from the last weight measurement in pregnancy to derive absolute weight gain [23].
Cord blood DNA methylation analysis using Illumina Golden Gate
Methylation Gold Kit, Zymo Research) using the the GoldenGate Cancer Panel I Array (Illumina Inc, USA) and the GoldenGate Assay Kit with UDG on the Sentrix Universal-96 Array matrix v7A. This panel spans 1,505 CpG sites selected from 807 genes. Arrays were imaged using a BeadArray scanner and image processing and intensity data extracted using Illumina BeadStudio v3.2, methylation module v3.2.5 custom software. Methylation levels (beta values,β) at a given CpG site were estimated as the ratio of signal intensity of the methylated alleles to the sum of methylated and unmethylated intensity signals of the alleles: β= M/(U + M), where M was the fluorescence level of the methylation probe and U was the fluorescence level of the unmethylated probe. The beta values vary from 0 (no methylation) to 1 (100% methylation). Samples were run across four different PCR plates.
Other variables
Based on previous knowledge, the following were con-sidered a priori potential confounding factors because of their possible associations with either maternal pre-pregnancy BMI or GWG and DNA methylation levels: child’s sex and ethnic background, mode of delivery, maternal age at child’s birth, parity, maternal smoking in pregnancy and occupation. Child’s sex, maternal age, parity (0 or 1+) and mode of delivery (cesarean or vagi-nal delivery), and child’s ethnic background (white or non-white) were obtained from the obstetric records. Maternal smoking and occupational (of both the mother and her partner) were reported by the mother in a study questionnaire administered at mean 18 weeks gestation; with data on smoking also reported in subsequent questionnaires administered during pregnancy. Maternal smoking in pregnancy was categorized as no versus yes. Highest parental occupation was used to allocate the children to family social class groups according to the 1991 British Office of Population and Census Statistics classification [24] (with the higher class of either parent where these differed being used); this was collapsed into a binary variable of manual versus non-manual in this study.
Validation study
A PyroMark MD Pyrosequencing System (Qiagen) was used for the validation of the top associated locus (MMP7_E59). This quantifies DNA methylation in a sequencing-by-synthesis manner providing precise methy-lation levels of several CpG positions in close proximity [25]. The DNA segment harboring the region of MMP7 amplified for this purpose and analyzed consisted of the sequence 5′- AGGCTGAGAAGCTATATAAATTTCTG CAGTCACTAGCAGAAAACACCAAATCAACCATAG
GTCCAAGAACAATTGTCTCTGGACGGCAGCTATG
CGACTCACCGTGCTGTGTGCTGTGTGCCTGCTGC CTGGCAGCCTGGCCCTGCCGCTGCCTCAGGAGGC GGGAGGCATGAGTGAGCTACAGTGGGAAC-3′. As indicated in italics, we analyzed three CpG sites overall. The one referring to CpG probe site MMP7_E59 is highlighted in bold. The forward PCR and reverse PCR, and sequencing primers are AGGTTGAGAAGTTATA TAAA, ATTCCCACTATAACTCACT, and AATTAAT TATAGGTTTAAGA, respectively. Briefly, bisulfite con-version of genomic DNA was performed using EZ DNA Methylation Gold™ kit (Zymo Research) following the manufacturer’s protocol. Quantitative bisulphite Pyrose-quencing (Qiagen, UK) with Pyro Q-CpG™ Software (version 1.0.6.) was subsequently used to determine the percentage methylation at individual CpG sites. 1ug of DNA was bisulfite modified. Bisulfite treated DNA was added to the first PCR reaction with 12.5 μl Hot Star Taq mastermix (Qiagen) and optimised primer concen-trations and annealing temperature. PCR cycling condi-tions were: 95 degrees C for 15 min, 50 cycles of 95 for 15 secs, 45 degrees C for 30secs, 72 for 15 secs, 72 for 5 min, and 4 for hold/storage. Assays were assessed for amplification bias and reliability as described previ-ously [26,27]. Zero and 100% in vitro methylated con-trols were run routinely alongside samples as internal controls, as well as, negative controls consisting of DNA free wells. Zero and 100% in vitro methylated internal controls showed good correlation (R2= 0.99). Two inde-pendent replicates per sample were processed on separ-ate runs, giving good correlation (R2between 0.658 and 0.847).
Replication study
The same Pyrosequencing assay used during the valid-ation study of the top associated locus (MMP7_E59) was used to analyze 192 non-overlapping mother-offspring pairs randomly selected from the 2,183 ALSPAC cohort participants with cord blood DNA available and who were not included in the discovery study. Of these 192 pairs 170 (88%) could be successfully characterized.
Statistical analysis
adjusted for child’s sex and maternal age at child’s birth included as fixed coefficients and a PCR plate effect as a random batch coefficient. Allowance for other possible confounding variables such as child’s ethnic background, mode of delivery, parity, maternal smoking in pregnancy and occupation did not materially alter the estimates. Results were summarized as means and standard errors. Lists of CpG sites with differential methylation in beta values (difference >0.05) at a p value < 0.01–a pragmatic threshold for selecting CpG sites for further study – were generated for maternal pre-pregnancy BMI, and GWG in early (from 0 to 18 weeks of pregnancy), mid (from 19 to 28 weeks of pregnancy), and late pregnancy (from 29 weeks of pregnancy onwards). False discovery rate correction for multiple testing was performed and q-values were computed by the‘qvalue’package in the R statistical package version 2.9.1 (R Foundation for Statis-tical Computing, Vienna, Austria). A false discovery rate q-value of <0.1 was considered statistically significant.
In the validation and replication analyses based on Pyrosequencing, CpG site methylation levels were also analyzed by mixed linear regression models adjusted for child’s sex and maternal age at child’s birth as fixed coef-ficient and PCR plate as a random batch effect as out-lined above.
Ethical approval
Ethical approval for all aspects of data collection was obtained from the ALSPAC Law and Ethics Committee and the Local Research Ethics Committee in accordance with the guidelines of The Declaration of Helsinki. Writ-ten informed consent was obtained for all participants in the study.
Results
Discovery study: illumina golden gate
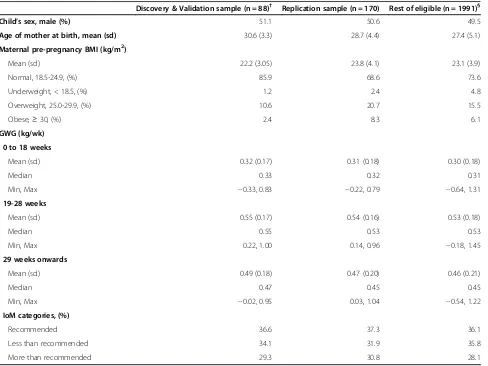
The discovery study population included 88 mother-offspring pairs. Participants were unrelated newborns born at term and 50% male. Mean (sd) maternal age at birth was 30.2 (3.5) years. In comparison with eligible participants for the present study, mothers included in the discovery study were older, and were less likely over-weight or obese before pregnancy, but did not differ in GWG (Table 1).
Maternal pre-pregnancy BMI was not found to be as-sociated with differentially methylated DNA at any CpG site in offspring cord blood (Additional file 1: Table S1).
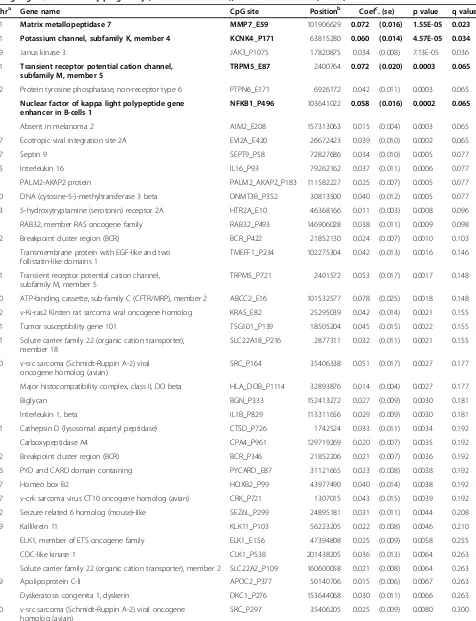
Early pregnancy GWG was associated with differential DNA methylation at 44 CpGs sites in offspring cord blood (p value < 0.01) (Table 2). Six out of these 44 CpG sites (located in 5 genes) had a difference in the Illumina beta value of >0.05 (MMP7_ E59 p value=1.55E-05;
KCNK4_P171 p value = 4.57E-05; TRPM5_E87p value = 0.0003; NFKB1_P496 p value = 0.0002; TRPM5_P721
p value = 0.0017; and ABCC2_E16 p value = 0.0018); of these, 4 CpG sites remained robust to correction for mul-tiple comparison testing: MMP7_E59 (q value = 0.023),
KNCK4_P171 (q value = 0.034), TRPM5_E87 (q value = 0.065), andNFKB1_P496(q value = 0.065) (Table 2).
Greater GWG in mid pregnancy was associated with changes in methylation (difference in beta value >0.05) at one CpG site at MAP3K1_E81 (p value = 0.003); although it did not remain statistically significant after correction for multiple comparison testing (q value = 0.917) (Additional file 1: Table S2). GWG in late preg-nancy was not associated with differential DNA methyla-tion at any CpG site (all differences in beta values <0.05) (Additional file 1: Table S3).
Pyrosequencing validation study
The association of early pregnancy GWG with differen-tial methylation at the top associated CpG site atMMP7 was validated by reanalyzing CpG siteMMP7_E59in the discovery study using Pyrosequencing. The methylation levels assayed using the GoldenGate platform did not correlate with Pyrosequenced values (R-squared = 0.005; p value = 0.508).
The two adjacent CpG sites covered in the Pyrose-quenced amplicon were highly correlated with
MMP7_E59 and with each other (Pearson’s correlation coefficients all >0.87; all p < 0.0001). In agreement with the discovery findings, Pyrosequencing results showed that greater GWG in early pregnancy tended to be asso-ciated with higher methylation at the MMP7_E59 CpG site, although the association did not reach statistical significance (p value = 0.302 (Table 3). Moreover, greater GWG in mid- and late pregnancy were associated with increased methylation at the MMP7_E59 CpG site (p values = 0.167 and 0.037, respectively) (Table 3). In addition, newborns of mothers that gained greater than IoM recommended weight showed higher methylation levels at the MMP7_E59 CpG site compared to those newborns of mothers with IoM recommended weight (p value = 0.080) (Table 3). Maternal GWG and IoM recommended weight categories showed similar associa-tions with DNA methylation levels at the other 2 CpG sites evaluated atMMP7.
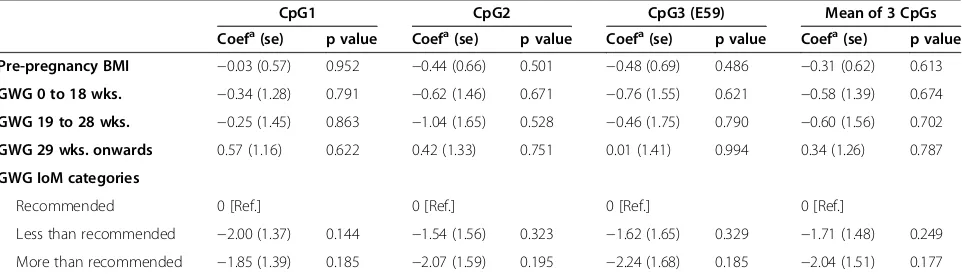
Replication study
of maternal pre-pregnancy BMI or GWG in any period of pregnancy with differential methylation at MMP7 CpG sites (all p values >0.1) (Table 4).
Discussion
This study examined the association of maternal pre-pregnancy BMI and GWG in different periods of preg-nancy with gene-specific DNA methylation changes in offspring cord blood. Screening analysis using the Illu-mina GoldenGate Panel I in a discovery sample of 88 mother-offspring pairs showed greater GWG in early pregnancy (from 0 to 18 weeks) to be associated with differential methylation at 4 CpG sites at MMP7,
KCNK4,TRPM5 and NFKB1 genes after correcting for multiple statistical testing. Of these four loci we under-took validation and replication using Pyrosequencing of the top associated locus at MMP7. Results of the valid-ation study did not support evidence for an associvalid-ation with early pregnancy GWG with differential methylation at this locus, but was suggestive of an association with
GWG in later pregnancy and for exceeded IoM recom-mended GWG. However, we failed to replicate these findings for this one locus in 170 non-overlapping mother-offspring pairs of the ALSPAC cohort.
The specific association of early pregnancy GWG with differential methylation at four loci is notable, since early GWG is more likely to reflect maternal fat deposition than later GWG (which will be influenced more by fetal growth) [13], and so this specificity, together with the potential functional roles of these loci (see below), might support these findings as being important in develop-mental overnutrition. However, we were only able to undertake validation and replication studies for one, the most strongly associated loci (MMP7) and the specific early GWG association with differential methylation at that locus did not validate or replicate.
[image:5.595.58.546.99.465.2]Our more significant finding in the discovery study was increased methylation of CpG sites at MMP7gene in relation to greater GWG. Matrix metalloproteinases (MMPs) comprise a large family of structurally related
Table 1 Characteristics of the study populations from the ALSPAC cohort
Discovery & Validation sample (n = 88)† Replication sample (n = 170) Rest of eligible (n = 1991)§
Child’s sex, male (%) 51.1 50.6 49.5
Age of mother at birth, mean (sd) 30.6 (3.3) 28.7 (4.4) 27.4 (5.1)
Maternal pre-pregnancy BMI (kg/m2)
Mean (sd) 22.2 (3.05) 23.8 (4.1) 23.1 (3.9)
Normal, 18.5-24.9, (%) 85.9 68.6 73.6
Underweight, < 18.5, (%) 1.2 2.4 4.8
Overweight, 25.0-29.9, (%) 10.6 20.7 15.5
Obese,≥30, (%) 2.4 8.3 6.1
GWG (kg/wk)
0 to 18 weeks
Mean (sd) 0.32 (0.17) 0.31 (0.18) 0.30 (0.18)
Median 0.33 0.32 0.31
Min, Max −0.33, 0.83 −0.22, 0.79 −0.64, 1.31
19-28 weeks
Mean (sd) 0.55 (0.17) 0.54 (0.16) 0.53 (0.18)
Median 0.55 0.53 0.53
Min, Max 0.22, 1.00 0.14, 0.96 −0.18, 1.45
29 weeks onwards
Mean (sd) 0.49 (0.18) 0.47 (0.20) 0.46 (0.21)
Median 0.47 0.45 0.45
Min, Max −0.02, 0.95 0.03, 1.04 −0.54, 1.22
IoM categories, (%)
Recommended 36.6 37.3 36.1
Less than recommended 34.1 31.9 35.8
More than recommended 29.3 30.8 28.1
†4 subjects initially included in the discovery study (n = 88) failed in the validation study.
§
Table 2 List of CpG sites with differential methylation at a p value < 0.01 in newborn cord blood DNA per 400 g of weight gain/week in early pregnancy (from 0 to 18 weeks), the ALSPAC cohort (n = 88)
Chra Gene name CpG site Positionb Coefc. (se) p value q value
11 Matrix metallopeptidase 7 MMP7_E59 101906629 0.072 (0.016) 1.55E-05 0.023
11 Potassium channel, subfamily K, member 4 KCNK4_P171 63815280 0.060 (0.014) 4.57E-05 0.034
19 Janus kinase 3 JAK3_P1075 17820875 0.034 (0.008) 7.13E-05 0.036
11 Transient receptor potential cation channel, subfamily M, member 5
TRPM5_E87 2400764 0.072 (0.020) 0.0003 0.065
12 Protein tyrosine phosphatase, non-receptor type 6 PTPN6_E171 6926172 0.042 (0.011) 0.0003 0.065
4 Nuclear factor of kappa light polypeptide gene enhancer in B-cells 1
NFKB1_P496 103641022 0.058 (0.016) 0.0002 0.065
1 Absent in melanoma 2 AIM2_E208 157313063 0.015 (0.004) 0.0003 0.065
17 Ecotropic viral integration site 2A EVI2A_E420 26672423 0.039 (0.010) 0.0002 0.065
17 Septin 9 SEPT9_P58 72827686 0.034 (0.010) 0.0005 0.077
15 Interleukin 16 IL16_P93 79262162 0.037 (0.011) 0.0006 0.077
9 PALM2-AKAP2 protein PALM2_AKAP2_P183 111582227 0.025 (0.007) 0.0005 0.077
20 DNA (cytosine-5-)-methyltransferase 3 beta DNMT3B_P352 30813500 0.040 (0.012) 0.0005 0.077
13 5-hydroxytryptamine (serotonin) receptor 2A HTR2A_E10 46368166 0.011 (0.003) 0.0008 0.096
6 RAB32, member RAS oncogene family RAB32_P493 146906028 0.038 (0.011) 0.0009 0.098
22 Breakpoint cluster region (BCR) BCR_P422 21852130 0.024 (0.007) 0.0010 0.103
9 Transmembrane protein with EGF-like and two follistatin-like domains 1
TMEFF1_P234 102275304 0.042 (0.013) 0.0016 0.146
11 Transient receptor potential cation channel, subfamily M, member 5
TRPM5_P721 2401572 0.053 (0.017) 0.0017 0.148
10 ATP-binding cassette, sub-family C (CFTR/MRP), member 2 ABCC2_E16 101532577 0.078 (0.025) 0.0018 0.148
12 v-Ki-ras2 Kirsten rat sarcoma viral oncogene homolog KRAS_E82 25295039 0.042 (0.014) 0.0021 0.155
11 Tumor susceptibility gene 101 TSG101_P139 18505204 0.045 (0.015) 0.0022 0.155
11 Solute carrier family 22 (organic cation transporter), member 18
SLC22A18_P216 2877311 0.032 (0.011) 0.0021 0.155
20 v-src sarcoma (Schmidt-Ruppin A-2) viral oncogene homolog (avian)
SRC_P164 35406338 0.051 (0.017) 0.0027 0.177
6 Major histocompatibility complex, class II, DO beta HLA_DOB_P1114 32893876 0.014 (0.004) 0.0027 0.177
X Biglycan BGN_P333 152413272 0.027 (0.009) 0.0030 0.181
2 Interleukin 1, beta IL1B_P829 113311656 0.029 (0.009) 0.0030 0.181
11 Cathepsin D (lysosomal aspartyl peptidase) CTSD_P726 1742524 0.033 (0.011) 0.0034 0.192
7 Carboxypeptidase A4 CPA4_P961 129719269 0.020 (0.007) 0.0035 0.192
22 Breakpoint cluster region (BCR) BCR_P346 21852206 0.021 (0.007) 0.0036 0.192
16 PYD and CARD domain containing PYCARD_E87 31121665 0.023 (0.008) 0.0038 0.192
17 Homeo box B2 HOXB2_P99 43977490 0.040 (0.014) 0.0038 0.192
17 v-crk sarcoma virus CT10 oncogene homolog (avian) CRK_P721 1307015 0.043 (0.015) 0.0039 0.192
22 Seizure related 6 homolog (mouse)-like SEZ6L_P299 24895181 0.031 (0.011) 0.0044 0.208
19 Kallikrein 11 KLK11_P103 56223205 0.022 (0.008) 0.0046 0.210
X ELK1, member of ETS oncogene family ELK1_E156 47394808 0.025 (0.009) 0.0058 0.255
2 CDC-like kinase 1 CLK1_P538 201438205 0.036 (0.013) 0.0064 0.263
6 Solute carrier family 22 (organic cation transporter), member 2 SLC22A2_P109 160600058 0.021 (0.008) 0.0064 0.263
19 Apolipoprotein C-II APOC2_P377 50140706 0.015 (0.006) 0.0067 0.263
X Dyskeratosis congenita 1, dyskerin DKC1_P276 153644068 0.030 (0.011) 0.0066 0.263
20 v-src sarcoma (Schmidt-Ruppin A-2) viral oncogene homolog (avian)
zinc-dependent proteinases that have been classified into subgroups on the basis of their structure, substrate specificity, and cellular localization and include collage-nases, gelaticollage-nases, stromelysins, and membrane-type (MT-MMPs) [28]. MMPs participate in processes such as embryonic development, angiogenesis, wound repair, reproductive cycling, and metastasis [28]. Interestingly, MMPs are essential for proper extracellular matrix re-modelling, a process that takes place during obesity-mediated adipose tissue formation. Specifically, mouse models of obesity have showed that the expression of
MMP7is down regulated in obesity [29,30]. These find-ings are in accordance with our results since increased methylation of MMP7would imply lower gene expres-sion, which could translate into a higher risk of adiposity in the offspring in response to an in utero obesogenic environment. However, these associations were not rep-licated in non-overlapping mother-offspring pairs; thus, present results should be interpreted cautiously and future studies are warranted to confirm the association of greater GWG with differential methylation ofMMP7.
Validation and replication studies using Pyrosequenc-ing were not undertaken for other CpG sites that were identified as being differentially methylated in relation to greater GWG and located in genesKCNK4,TRPM5and
NFKB1. However, these three identified genes may be worthy of further exploration. KCNK4 encodes for a potassium channel, subfamily K, member 4 known as Trek/TRAAK channels that has been described to be expressed in the central nervous system, modulate neur-onal activity, brain metabolism and have a role in neuro-protection [31,32]. Knockout animal models have shown a role for Trek/TRAAK channels in behaviour, learning and memory [33,34]. Interestingly, greater maternal pre-pregnancy BMI and GWG have been shown to be asso-ciated with offspring impaired cognition and behavioural problems later in life, including in the ALSPAC study [3,4]. In addition,TRPM5encodes for a thermo-sensitive TRP (transient receptor potential) channel that is expressed in pancreaticβ-cells and could predominantly contribute to pancreatic functions [35]. In humans,
genetic variation in TRPM5 has been reported to be likely associated with pre-diabetic phenotypes and con-tribute to the development of type 2 diabetes mellitus [36]. Furthermore, TRPM5 knockout mice exhibit im-paired glucose clearance resulting from reductions in insulin secretion [37,38]. This evidence from animal studies is in accordance with our results showing in-creased methylation of TRPM5 CpG sites in relation to greater maternal GWG; this may in turn result in lower expression of TRPM5 and, thus, perturbed insulin me-tabolism and increased risk of diabetes in the offspring as it has been previously suggested [39]. Finally,NFKB1 encodes for nuclear factor of kappa light polypeptide gene enhancer in B-cells 1, which is responsible for acti-vation of transcription of genes involved in immune re-sponses, inflammation or cell proliferation [40]. Genetic variation inNKKB1gene has been reported to be associ-ated with a range of immune-mediassoci-ated diseases such as atopy, asthma and related phenotypes [41], which are also related to maternal obesity and GWG [42,43]. Therefore, DNA methylation changes at these three loci highlighted in the screening analysis appear to have clear functional relevance to pathways implicated in develop-mental programming of adverse phenotypes in offspring linked to maternal obesity and GWG and therefore deserve further investigation.
[image:7.595.57.538.113.187.2]The strengths of this study are the prospective design and that potential confounding factors were taken into account in the analyses. Further, we evaluated the associ-ation of pre-pregnancy BMI and GWG in distinctive periods of pregnancy with offspring cord blood DNA methylation patterns. To our knowledge no previous hu-man studies have examined these associations, yet these maternal exposures have been shown to be related to later offspring outcomes and it has been suggested these associations may be mediated by epigenetic mechanisms [8,13,14]. The ability to examine associations of different pregnancy periods of GWG is a particular strength as our expectation would be that GWG in early pregnancy would be specifically associated with outcomes and we were able to test that here.
Table 2 List of CpG sites with differential methylation at a p value < 0.01 in newborn cord blood DNA per 400 g of weight gain/week in early pregnancy (from 0 to 18 weeks), the ALSPAC cohort (n = 88)(Continued)
10 N-acetyltransferase 2 NAT2_P11 18293024 0.012 (0.004) 0.0079 0.300
8 PTK2 protein tyrosine kinase 2 PTK2_P735 142081249 0.022 (0.008) 0.0085 0.312
1 CD34 antigen CD34_P339 206151645 0.021 (0.008) 0.0092 0.330
4 Interleukin 8 IL8_P83 74825056 0.051 (0.019) 0.0098 0.334
11 Progesterone receptor PGR_P790 100507255 0019 (0.007) 0.0096 0.334
a
Chromosome.bChromosomal position based on NCBI human reference genome assembly Build 36.1. c
Regression coefficient using linear mixed models. All models adjusted for child’s sex and maternal age at child’s birth and the inclusion of a PCR plate random batch effect.
However, the study has some limitations. Firstly, DNA methylation changes were assessed in cord blood, which limits to know how identified changes could translate to potential target tissues. However, DNA methylation pat-terns are largely conserved across tissues suggesting that for population based epidemiological studies methylation markers from easily accessible surrogate tissues could be used as a proxy for methylation in target tissues [44]. Be-cause cell count information was not available we cannot rule out the potential impact of cell heterogeneity on present findings. Secondly, limited sample size of the discovery study population may have resulted in low statistical power to detect true differences in DNA methylation patterns and false positives could have oc-curred. In addition, lack of correlation of methylation levels in MMP7 CpG sites measured with the Golden-Gate array and Pyrosequencing limits the conclusions that can be drawn from the present validation and repli-cation studies. Thirdly, smaller effect sizes in DNA methylation were found and biological significance in
[image:8.595.56.540.111.249.2]terms of changes in gene expression is unknown. How-ever, it may be a general phenomenon in complex diseases and phenotypes, where methylation at any given CpG island or specific CpG sites in affected versus unaffected individuals may vary by less than 10%, indeed they have been reported in many other human epigen-etic studies. Moreover, for some genes, evidence exists that a small change in the level of DNA methylation, especially in the lower range, can dramatically alter gene expression levels [45]. We opted not to consider differ-entially methylated site below a threshold of 5% due to the limitations inherent in interpreting biological signifi-cance, although this cut off may have limited our find-ings. Fourthly, the Illumina GoldenGate Panel I was used for screening of DNA regions differently methyl-ated in DNA cord blood. The CpG sites included in this array are based on their functional relevance to tumor development and cancer processes, which in only some aspects can be related to fetal development (such as cell proliferation). However, this array was not designed for
Table 4 Replication study: associations of maternal pre-pregnancy BMI and gestational weight gain (GWG) withMMP7 CpG sites methylation levels in newborn cord blood DNA (n = 170)
CpG1 CpG2 CpG3 (E59) Mean of 3 CpGs
Coefa(se) p value Coefa(se) p value Coefa(se) p value Coefa(se) p value
Pre-pregnancy BMI −0.03 (0.57) 0.952 −0.44 (0.66) 0.501 −0.48 (0.69) 0.486 −0.31 (0.62) 0.613
GWG 0 to 18 wks. −0.34 (1.28) 0.791 −0.62 (1.46) 0.671 −0.76 (1.55) 0.621 −0.58 (1.39) 0.674
GWG 19 to 28 wks. −0.25 (1.45) 0.863 −1.04 (1.65) 0.528 −0.46 (1.75) 0.790 −0.60 (1.56) 0.702
GWG 29 wks. onwards 0.57 (1.16) 0.622 0.42 (1.33) 0.751 0.01 (1.41) 0.994 0.34 (1.26) 0.787
GWG IoM categories
Recommended 0 [Ref.] 0 [Ref.] 0 [Ref.] 0 [Ref.]
Less than recommended −2.00 (1.37) 0.144 −1.54 (1.56) 0.323 −1.62 (1.65) 0.329 −1.71 (1.48) 0.249
More than recommended −1.85 (1.39) 0.185 −2.07 (1.59) 0.195 −2.24 (1.68) 0.185 −2.04 (1.51) 0.177
a
Regression coefficient using linear mixed models. For pre-pregnancy BMI (kg/m2) estimated changes per 1 SD change and for GWG estimated changes per additional 400 g/week.
[image:8.595.58.539.569.707.2]All models adjusted for child’s sex and maternal age and the inclusion of a PCR plate random batch effect.
Table 3 Validation study: associations of maternal pre-pregnancy BMI and gestational weight gain (GWG) withMMP7 CpG sites methylation levels in newborn cord blood DNA
CpG1 CpG2 CpG3 (E59) Mean of 3 CpGs
Coefa(se) p value Coefa(se) p value Coefa(se) p value Coefa(se) p value
Pre-pregnancy BMI (n = 87) 0.80 (0.70) 0.250 1.15 (0.78) 0.143 1.22 (0.82) 0.139 1.06 (0.75) 0.158
GWG 0 to 18 wks (n = 84) 0.80 (1.99) 0.686 1.52 (2.27) 0.505 2.44 (2.36) 0.302 1.59 (2.15) 0.461
GWG 19 to 28 wks (n = 84) 0.96 (1.73) 0.580 2.89 (1.95) 0.141 2.83 (2.04) 0.167 2.23 (1.86) 0.232
GWG 29 wks. onwards (n = 84) 2.38 (1.57) 0.133 3.25 (1.79) 0.071 3.90 (1.85) 0.037 3.17 (1.69) 0.062
GWG IoM categories (n = 78)
Recommended 0 [Ref.] 0 [Ref.] 0 [Ref.] 0 [Ref.]
Less than recommended 2.03 (1.74) 0.246 0.18 (2.00) 0.930 0.38 (2.09) 0.853 0.86 (1.90) 0.649
More than recommended 3.35 (1.79) 0.063 3.13 (2.06) 0.131 3.81 (2.16) 0.080 3.43 (1.96) 0.082
a
Regression coefficient using linear mixed models. For pre-pregnancy BMI (kg/m2) estimated changes per 1 SD change and for GWG estimated changes per additional 400 g/week.
epigenome-wide analyses, and methylation changes at other loci in genes relevant to maternal GWG may have been overlooked. The use of the 450 k Beadchip that offers greatly improved genomic coverage over the GoldenGate and 27 k platforms is warranted in future studies. Finally, we were only able to take forward the top associated loci at MMP7for validation and replica-tion, which limits the interpretation of results for the other three loci that were identified as being associated with GWG in early pregnancy. Given the likely func-tional relevance of these and the specificity of associ-ation with early GWG we feel that further study of these loci is warranted.
Conclusions
We found that greater GWG, specifically in early preg-nancy, was associated with increased methylation at 4 CpG sites atMMP7,KCNK4,TRPM5and NFKB1 genes in offspring cord blood DNA. These four loci were all potentially functionally relevant but we were only able to take the top associated locus at MMP7 forward for validation using Pyrosequencing and replication in non-overlapping mother-offspring pairs. The specific associ-ation with GWG in early pregnancy for that one site was not statistically significantly validated and it did not repli-cateple. Given this is the first study we are aware of to examine these associations and our findings might reflect limited statistical power, we advocate further exploration of identified loci in larger studies and the study of genome-wide DNA methylation data.
Additional file
Additional file 1:Supplementary material for DNA methylation signatures in cord blood associated with maternal gestational weight gain: results from the ALSPAC cohort.
Competing interests
The authors declare that they have no competing interests.
Authors’contributions
DAL and CLR: obtained funding for the study and initially designed it. EM and CLR: developed the study aims. EM and AG: conducted the experiments, under the supervision of CLR. EM: performed the statistical analyses and wrote the first draft of the manuscript. EM, DAL and CLR participated in the interpretation of data. All authors help to draft the manuscript, and read and approved the final manuscript.
Acknowledgements
Prof Kate Tilling and Drs Abigail Fraser and Corrie Macdonald-Wallis are acknowledged for their contribution to derivation of the gestational weight gain trajectories, and Prof Seif Shaheen for his contributing to funding the generation of Illumina GoldenGate methylation data. Dr Catherine Potter is thanked for her assistance in shaping the manuscript. We are extremely grateful to all the families who took part in this study, the midwives for their help in recruiting them, and the whole ALSPAC team, which includes interviewers, computer and laboratory technicians, clerical workers, research scientists, volunteers, managers, receptionists and nurses.
Funding
The UK Medical Research Council and the Wellcome Trust (Grant ref: 092731) and the University of Bristol provide core support for ALSPAC. Obstetric data abstraction and derivation of maternal pregnancy variables, including GWG, were supported by grants from the US NIH (R01 DK077659) and UK Wellcome Trust (WT087997MA). AG, DAL and CR work in a Unit that receives funding from the University of Bristol and UK Medical Research Council (MC_UU_12013/2 and MC_UU_12013/5). EM was supported by aRio Hortega fellowship (CM09/100090) from the Spanish Ministry of Science and Innovation. This publication is the work of the authors and Prof Caroline Relton will serve as guarantor for the contents of this paper.
Author details
1
Institute of Genetic Medicine, Newcastle University, Newcastle upon Tyne, NE1 3BZ, Tyne and Wear, UK.2Centre for Research in Environmental Epidemiology (CREAL), Barcelona, Catalonia, Spain.3Hospital del Mar Medical Research Institute (IMIM), Barcelona, Catalonia, Spain.4CIBER in Epidemiology and Public Health (CIBERESP), Barcelona, Spain.5MRC Integrative
Epidemiology Unit at the University of Bristol, Bristol, UK.6School of Social and Community Medicine, University of Bristol, Bristol, UK.
Received: 11 December 2013 Accepted: 10 April 2014 Published: 2 May 2014
References
1. Ludwig DS, Currie J:The association between pregnancy weight gain and birthweight: a within-family comparison.Lancet2010,376:984–990. 2. Monte S, Valenti O, Giorgio E, Renda E, Hyseni E, Faraci M, De Domenico R,
Di Prima FA:Maternal weight gain during pregnancy and neonatal birth weight: a review of the literature.J Prenat Med2011,5:27–30.
3. Rodriguez A, Miettunen J, Henriksen TB, Olsen J, Obel C, Taanila A, Ebeling H, Linnet KM, Moilanen I, Järvelin MR:Maternal adiposity prior to pregnancy is associated with ADHD symptoms in offspring: evidence from three prospective pregnancy cohorts.Int J Obes2008,32:550–557. 4. Gage SH, Lawlor DA, Tilling K, Fraser A:Associations of maternal weight
gain in pregnancy with offspring cognition in childhood and adolescence: findings from the Avon Longitudinal Study of Parents and Children.Am J Epidemiol2013,177:402–410.
5. Oken E, Taveras EM, Kleinman KP, Rich-Edwards JW, Gillman MW:
Gestational weight gain and child adiposity at age 3 years.
Am J Obstet Gynecol2007,196(322):e1–8.
6. Moreira P, Padez C, Mourão-Carvalhal I, Rosado V:Maternal weight gain during pregnancy and overweight in Portuguese children.
Int J Obes (Lond)2007,31:608–614.
7. Wrotniak BH, Shults J, Butts S, Stettler N:Gestational weight gain and risk of overweight in the offspring at age 7 y in a multicenter, multiethnic cohort study.Am J Clin Nutr2008,87:1818–1824.
8. Fraser A, Tilling K, Macdonald-Wallis C, Sattar N, Brion MJ, Benfield L, Ness A, Deanfield J, Hingorani A, Nelson SM, Smith GD, Lawlor DA:Association of maternal weight gain in pregnancy with offspring obesity and metabolic and vascular traits in childhood.Circulation2010,121:2557–2564. 9. Oken E, Rifas-Shiman SL, Field AE, Frazier AL, Gillman MW:Maternal
gestational weight gain and offspring weight in adolescence.
Obstet Gynecol2008,112:999–1006.
10. Mamun AA, O'Callaghan M, Callaway L, Williams G, Najman J, Lawlor DA:
Associations of gestational weight gain with offspring body mass index and blood pressure at 21 years of age: evidence from a birth cohort study.Circulation2009,119:1720–1727.
11. Hochner H, Friedlander Y, Calderon-Margalit R, Meiner V, Sagy Y, Avgil-Tsadok M, Burger A, Savitsky B, Siscovick DS, Manor O:Associations of maternal prepregnancy body mass index and gestational weight gain with adult offspring cardiometabolic risk factors: the Jerusalem Perinatal Family Follow-up Study.Circulation2012,125:1381–1389.
12. Laitinen J, Jääskeläinen A, Hartikainen AL, Sovio U, Vääräsmäki M, Pouta A, Kaakinen M, Järvelin MR:Maternal weight gain during the first half of pregnancy and offspring obesity at 16 years: a prospective cohort study.
BJOG2012,119:716–723.
14. Lawlor DA:The Society for Social Medicine John Pemberton Lecture, Developmental overnutrition–an old hypothesis with new importance?
Int J Epidemiol2011,2013(42):7–29.
15. Guénard F, Deshaies Y, Cianflone K, Kral JG, Marceau P, Vohl MC:
Differential methylation in glucoregulatory genes of offspring born before vs. after maternal gastrointestinal bypass surgery.Proc Natl Acad Sci U S A2013,110:11439–11444.
16. Guénard F, Tchernof A, Deshaies Y, Cianflone K, Kral JG, Marceau P, Vohl MC:
Methylation and expression of immune and inflammatory genes in the offspring of bariatric bypass surgery patients.J Obes2013,2013:492170. 17. Liu X, Chen Q, Tsai HJ, Wang G, Hong X, Zhou Y, Zhang C, Liu C, Liu R,
Wang H, Zhang S, Yu Y, Mestan KK, Pearson C, Otlans P, Zuckerman B, Wang X:Maternal preconception body mass index and offspring cord blood DNA methylation: Exploration of early life origins of disease.
Environ Mol Mutagen2014,55:223–230.
18. Borengasser SJ, Zhong Y, Kang P, Lindsey F, Ronis MJ, Badger TM, Gomez-Acevedo H, Shankar K:Maternal obesity enhances white adipose tissue differentiation and alters genome-scale DNA methylation in male rat offspring.Endocrinology2013,154:4113–4125.
19. Yang QY, Liang JF, Rogers CJ, Zhao JX, Zhu MJ, Du M:Maternal obesity induces epigenetic modifications to facilitate zfp423 expression and enhance adipogenic differentiation in fetal mice.Diabetes2013,
62:3727–3735.
20. Boyd A, Golding J, Macleod J, Lawlor DA, Fraser A, Henderson J, Molloy L, Ness A, Ring S:Davey Smith G: Cohort Profile: the’children of the 90s’–the index offspring of the Avon Longitudinal Study of Parents and Children.Int J Epidemiol2013,42:111–127.
21. Fraser A, Macdonald-Wallis C, Tilling K, Boyd A, Golding J, Davey Smith G, Henderson J, Macleod J, Molloy L, Ness A, Ring S, Nelson SM, Lawlor DA:
Cohort Profile: the Avon Longitudinal Study of Parents and Children: ALSPAC mothers cohort.Int J Epidemiol2013,42:97–110.
22. Relton CL, Groom A, St Pourcain B, Sayers AE, Swan DC, Embleton ND, Pearce MS, Ring SM, Northstone K, Tobias JH, Trakalo J, Ness AR, Shaheen SO, Davey Smith G:DNA methylation patterns in cord blood DNA and body size in childhood.PLoS One2012,7:e31821.
23. IOM (Institute of Medicine) and NRC (National Research Council):Weight Gain During Pregnancy.InReexamining the Guidelines.Edited by Kathleen M, Rasmussen KM, Yaktine AL. Washington, DC: The National Academies Press; 2009.
24. Office of Population and Census Statistics:Standard Occupational Classification.London, United Kingdom: Her Majesty’sStationery Office; 1991. 25. Tost J, Dunker J, Gut IG:Analysis and quantification of multiple
methylation variable positions in CpG islands by Pyrosequencing.
Biotechniques2003,35:152–156.
26. McKay JA, Groom A, Potter C, Coneyworth LJ, Ford D, Mathers JC, Relton CL:Genetic and non-genetic influences during pregnancy on infant global and site specific DNA methylation: role for folate gene variants and vitamin B12.PLoS One2012,7:e33290.
27. White HE, Durston VJ, Harvey JF, Cross NC:Quantitative analysis of SNRPN (correction of SRNPN) gene methylation by pyrosequencing as a diagnostic test for Prader-Willi syndrome and Angelman syndrome.
Clin Chem2006,52:1005–1013.
28. Sternlicht MD, Werb Z:How matrix metalloproteinases regulate cell behavior.Annu Rev Cell Dev Biol2001,17:463–516.
29. Maquoi E, Munaut C, Colige A, Collen D, Lijnen HR:Modulation of adipose tissue expression of murine matrix metalloproteinases and their tissue inhibitors with obesity.Diabetes2002,51:1093–1101.
30. Chavey C, Mari B, Monthouel MN, Bonnafous S, Anglard P, Van Obberghen E, Tartare-Deckert S:Matrix metalloproteinases are differentially expressed in adipose tissue during obesity and modulate adipocyte differentiation.
J Biol Chem2003,278:11888–11896.
31. Talley EM, Solorzano G, Lei Q, Kim D, Bayliss DA:Cns distribution of members of the two-pore-domain (KCNK) potassium channel family.
J Neurosci2001,21:7491–7505.
32. Judge SI, Smith PJ:Patents related to therapeutic activation of K (ATP) and K (2P) potassium channels for neuroprotection: ischemic/hypoxic/anoxic injury and general anesthetics.Expert Opin Ther Pat2009,19:433–460. 33. Deng PY, Xiao Z, Yang C, Rojanathammanee L, Grisanti L, Watt J, Geiger JD,
Liu R, Porter JE, Lei S:GABA (B) receptor activation inhibits neuronal excitability and spatial learning in the entorhinal cortex by activating TREK-2 K + channels.Neuron2009,63:230–243.
34. Mirkovic K, Palmersheim J, Lesage F, Wickman K:Behavioral
characterization of mice lacking Trek channels.Front Behav Neurosci2012,
6:60.
35. Uchida K, Tominaga M:The role of thermosensitive TRP (transient receptor potential) channels in insulin secretion.Endocr J2011,
58:1021–1028.
36. Ketterer C, Müssig K, Heni M, Dudziak K, Randrianarisoa E, Wagner R, Machicao F, Stefan N, Holst JJ, Fritsche A, Häring HU, Staiger H:Genetic variation within the TRPM5 locus associates with prediabetic phenotypes in subjects at increased risk for type 2 diabetes.
Metabolism2011,60:1325–1333.
37. Colsoul B, Schraenen A, Lemaire K, Quintens R, Van Lommel L, Segal A, Owsianik G, Talavera K, Voets T, Margolskee RF, Kokrashvili Z, Gilon P, Nilius B, Schuit FC, Vennekens R:Loss of high-frequency glucose-induced Ca2+ oscillations in pancreatic islets correlates with impaired glucose tolerance in Trpm5−/−mice.Proc Natl Acad Sci U S A2010,107:5208–5213. 38. Brixel LR, Monteilh-Zoller MK, Ingenbrandt CS, Fleig A, Penner R, Enklaar T,
Zabel BU, Prawitt D:TRPM5 regulates glucose-stimulated insulin secretion.Pflugers Arch2010,460:69–76.
39. Armitage JA, Khan IY, Taylor PD, Nathanielsz PW, Poston L:Developmental programming of the metabolic syndrome by maternal nutritional imbalance: how strong is the evidence from experimental models in mammals?J Physiol2004,561:355–377.
40. Baldwin AS Jr:Series introduction: the transcription factor NF-kappaB and human disease.J Clin Invest2001,107:3–6.
41. Smyth DJ, Howson JM, Payne F, Maier LM, Bailey R, Holland K, Lowe CE, Cooper JD, Hulme JS, Vella A, Dahlman I, Lam AC, Nutland S, Walker NM, Twells RC, Todd JA:Analysis of polymorphisms in 16 genes in type 1 diabetes that have been associated with other immune-mediated diseases.BMC Med Genet2006,7:20.
42. Harpsøe MC, Basit S, Bager P, Wohlfahrt J, Benn CS, Nøhr EA, Linneberg A, Jess T:Maternal obesity, gestational weight gain, and risk of asthma and atopic disease in offspring: a study within the Danish National Birth Cohort.J Allergy Clin Immunol2013,131:1033–1040.
43. Leermakers ET, Sonnenschein-van der Voort AM, Gaillard R, Hofman A, de Jongste JC, Jaddoe VW, Duijts L:Maternal weight, gestational weight gain and preschoolwheezing: the Generation R Study.Eur Respir J2013,
42:1234–1243.
44. Ma B, Wilker EH, Willis-Owen SA, Byun HM, Wong KC, Motta V, Baccarelli AA, Schwartz J, Cookson WO, Khabbaz K, Mittleman MA, Moffatt MF, Liang L:
Predicting DNA methylation level across human tissues.Nucleic Acids Res 2014,42:3515–3528.
45. Lillycrop KA, Phillips ES, Torrens C, Hanson MA, Jackson AA, Burdge GC:
Feeding pregnant rats a protein-restricted diet persistently alters the methylation of specific cytosines in the hepatic PPAR alpha promoter of the offspring.Br J Nutr2008,100:278–282.
doi:10.1186/1756-0500-7-278
Cite this article as:Moraleset al.:DNA methylation signatures in cord blood associated with maternal gestational weight gain: results from the ALSPAC cohort.BMC Research Notes20147:278.
Submit your next manuscript to BioMed Central and take full advantage of:
• Convenient online submission
• Thorough peer review
• No space constraints or color figure charges
• Immediate publication on acceptance
• Inclusion in PubMed, CAS, Scopus and Google Scholar
• Research which is freely available for redistribution