R E S E A R C H A R T I C L E
Open Access
Predictors of dental visits among primary
school children in the rural Australian
community of Lithgow
James Rufus John
1, Haider Mannan
2, Subrat Nargundkar
1, Mario D
’
Souza
3, Loc Giang Do
4and Amit Arora
1,5,6,7*Abstract
Background:Regular dental attendance is significant in maintaining and improving children’s oral health and well-being. This study aims to determine the factors that predict and influence dental visits in primary school children residing in the rural community of Lithgow, New South Wales (NSW), Australia.
Methods:All six primary schools of Lithgow were approached to participate in a cross-sectional survey prior to implementing water fluoridation in 2014. Children aged 6–13 years (n= 667) were clinically examined for their oral health status and parents were requested to complete a questionnaire on fluoride history, diet, last dental visit, and socio-demographic characteristics. Multiple logistic regression analyses were employed to examine the
independent predictors of a 6-monthly and a yearly dental visit.
Results:Overall, 53% of children visited a dentist within six months and 77% within twelve months. In multiple logistic regression analyses, age of the child and private health insurance coverage were significantly associated with both 6-monthly and twelve-month dental visits. In addition, each serve of chocolate consumption was significantly associated with a 27% higher odds (OR = 1.27, 95% CI: 1.05-1.54) of a 6-monthly dental visit.
Conclusion:It is imperative that the socio-demographic and dietary factors that influence child oral health must be effectively addressed when developing the oral health promotion policies to ensure better oral health outcomes.
Keywords:Dental visit, School children, Rural, Socio-demographics, Oral health
Background
Dental caries is one of the most prevalent childhood chronic diseases worldwide, which demands the need for an appropriate public health response [1]. In the Australian context, the Australian Institute of Health and Welfare (AIHW) reported that over 50% of Australian children aged 6 to 12 years had caries experience either in their primary or permanent teeth [2]. Numerous studies have reported that untreated dental caries in children strongly influences their growth, cognitive development and quality of life, thereby leading to failure to thrive in severe un-treated cases [3, 4]. Whilst there are various negative health ramifications associated with dental caries in children, it is
fortunate that the disease is largely preventable with proper oral hygiene, diet with less sugar content, ideal fluoride levels and regular dental visits [5].
Frequency of dental visits is one of the important factors that contributes to an individual’s oral health and well-being. Studies report that regular dental attendance in childhood not only sets positive health behaviour and a healthy trajectory for the long run, but also signifi-cantly improves the quality of life [6, 7]. Langevin et al. [7] claimed that regular dental visits increase the prob-ability of diagnosing and managing oral diseases in their early stages, thereby limiting any significant or irrevers-ible damage to teeth and gums. Given the scarcity of robust scientific evidence on the appropriate frequency of dental visits, the Australian Research Centre for Population Oral Health (ARCPOH) [8, 9] recommends that frequency must be based on different oral health needs and individual risk levels. The AIHW [10] reports * Correspondence:a.arora@westernsydney.edu.au
1
School of Science and Health, Western Sydney University, Campbelltown, NSW, Australia
5Oral Health Services and Sydney Dental Hospital, Sydney Local Health
District, Surry Hills, NSW, Australia
Full list of author information is available at the end of the article
that 69.4% of Australian children and teenagers visited the dentist within the past year whereas a significant proportion of 16.9% failed to visit in the last 5 years.
Recent statistical reports also state that the pattern of overall caries experience in terms of mean dmft/DMFT (decayed, missing and filled teeth) scores has gradually risen from 1.45 in 1996 to 2.58 in 2010 among children aged 6 years and from 0.84 in 2000 to 1.34 in 2010 in children aged 12 years [2]. In addition, it is seen that the caries distribution is strongly influenced by the disparity in oral health outcomes among Australian children as a result of parental attitude, affordability and access to den-tal services [10]. For example, AIHW [10] reported that Australian children belonging to lower socio-economic status (SES) groups had fewer visits on average compared to the high SES counterparts (77.5 and 55.2% respect-ively). In addition, the report also states that Australia children residing in regional to remote areas had fewer annual dental visits on average compared to children living in major cities.
Lithgow Local Government Area (LGA) is a rural community situated 145 km west of Sydney with a population of 19,756 people. In 2012, Lithgow LGA was the only community with a non-fluoridation status within the confines of the former Sydney West Area Health Services [11]. Based on fluoridation and caries risk status, Arora and Evans [12] reported that caries prevalence among children in the non-fluoridated com-munity of Lithgow was notably higher than children
residing in the fluoridated communities of Bathurst and Orange. In addition, Lee & Brearley-Messer [13] re-ported that children aged 5–6 years and 11–12 years, living in non-fluoridated or low-fluoridated communi-ties had 60 and 42% higher dmft/DMFT (decayed, missing, filled teeth index) scores respectively com-pared to those residing in fluoridated areas. Thus, oral health status and dental visits in children shows a significant association to the remoteness of residence, where poor attendance, limited fluoride exposure and poor oral health was observed among children living in regional communities compared to urban residences [14].
Figure 1 shows a theoretical model that summarises a triad of community-level, provider-level and patient-level factors that influence regular dental visit behaviours in children, based on Badri et al’s systematic review and Fisher-Owens’model [15, 16]. These include community-level factors such as social environment, cultural practices and health insurance coverage; Provider-level factors such as access to dental services, professional skills of the den-tal team, and patient-doctor relationship; and Patient-level factors such as child’s age, gender and health behaviours; parent’s education, marital status, socio-economic status and the prioritisation of dental visits. Gussy et al. [17] conducted a survey among parents in rural Victoria and found that parental attitudes and behaviours influenced their children’s dental visit and oral health status. Besides the study by Gussy and colleagues, the literature on the factors influencing dental visits among Australian rural
[image:2.595.59.537.445.714.2]communities is scarce. Therefore, this study aims to determine the factors that influence dental visits in primary school children living in the rural community of Lithgow, Australia.
Methods
Population of interest and sampling
This study is a secondary data analysis of a cross-sectional survey conducted among primary school children in Lithgow LGA of New South Wales, prior to having access to water fluoridation in 2014 [11]. A letter of invitation was sent to all the six primary school principals of the Lithgow LGA to participate in the survey. The parents of the primary school children were then approached to partake in the survey and were provided with a take-home information pack containing a detailed oral health ques-tionnaire and a consent form. In addition, weekly re-minders about the clinical examination were sent to the parents for 4 weeks using the school newsletters.
Questionnaire survey
The outline of the dental research questionnaire was aligned closely to the National Child Oral Health Survey questionnaire to allow standardised data collection and for comparison with the national census reports [18]. The questionnaire comprised of a detailed briefing on the child’s age, gender, brushing and dietary patterns, residency and their previous dental visit. In addition, the socio-demographic characteristics of the children’s parents such as age, information on their country of birth, Indigenous background, private health insurance coverage, tooth extraction history and annual household income were collected to analyse if ethnicity played a role in their children’s dental visits. The dietary ques-tions focused on the number of serves of chocolates and carbonated drinks, fruit juices and cordial drinks consumed by the child on a usual day.
The tooth brushing frequency was categorised as chil-dren brushing with a fluoridated toothpaste once or less and twice or more daily. The number of decayed, miss-ing and filled teeth (dmft) scores were dichotomised as no dmft scores and one or more dmft scores. Parents’ education was categorised as tertiary education and high school level education or less. In terms of employment, the three categories included managers and profes-sionals, skilled workers and pensioners and unemployed.
Clinical examination
After receiving the parents’ written consent, children were clinically examined in the school premises using a halogen light source. The guidelines of the World Health Organisation (WHO) were adopted as the diagnostic criteria for dental caries defining a carious tooth as a cavity into the surface of dentine [19]. All the patients’
teeth were examined wet, with a ball-ended WHO probe which was employed for examination if necessary [19]. The commonly used indices such as dmft index (for primary dentition) and DMFT index (for permanent dentition) were used and caries prevalence was denoted by the mean number of teeth that were decayed, missing (as a result of decay by extraction) and filled (because of decay) [20].
Data quality
The clinical scores of the primary examiner were cali-brated daily under the supervision of a calibrating exam-iner, and examiner reliability was assessed via Cohen’s Kappa statistic [21] on duplicated scores obtained from both intra- and inter-examinations. The kappa value for inter-examiner reliability was 0.93, and the intra-examiner reliability was 0.98. The questionnaire data was entered twice and inconsistencies were removed by cross-checking the questionnaire.
Data analysis
All the statistical analysis for this study was conducted with SPSS version 24. Descriptive characteristics were calculated using crosstabs to obtain the row percentages of each variable in relation to the dental visits in the last 6 months. Multiple logistic regression analyses were performed to determine the association between the factors and the two dichotomous outcome variables of dental visits in the last 6-months and twelve months. In addition, the presence of influential outliers for each variable was determined and analysed using difference of fit [22]. There was approximately 8% missing data in the study sample which was managed by employing the multiple imputation analysis. Multiple imputation makes repeated draws from the model of distribution of vari-ables having missing data and provides valid values using other available information from the dataset [23, 24]. Missing values were imputed 25 times using a Markov Chain Monte Carlo (MCMC) algorithm known as fully conditional specification (FCS) or chained equations to reduce the effect of sampling variability in the parameter estimates [25]. The outcome variable of dental visits was included as a covariate in the imputation model, as it is recommended that the inclusion of the dependent variable of the risk prediction model in the imput-ation model enables unbiased estimates of model coefficients [26].
when excluded, the change in deviance compared with the corresponding Chi-square (Χ2) test statistic on the relevant degrees of freedom was significant (p < 0.05). In addition, all the variables in the conceptual model were tested for collinearity against each other and against other covariates, before including them in multiple logis-tic regression analysis. However, all variables tested had pairwise correlations of less than 0.5 implying that the possibility of collinearity between the variables is small.
A total of six models were examined in the study to ex-plore all the different possible outcomes with the 6-monthly and yearly visit variables, and to observe their significance associated to each model. Models 1 to 4 were analysed for original data without correction of missing observations while Models 5 and 6 incorporated the im-puted data. Whilst model 1, 2 and 5 have six monthly visit as the outcome; model 3, 4 and 6 have yearly visit as the outcome variable. To examine the external validity of the results, the observed population estimate of the Lithgow survey was compared against the 2011 ABS census [27] by performing one sample z-tests for proportions.
Results
A total of 1589 parents were approached for the Lithgow LGA survey. Of these, 667 (42%) completed the ques-tionnaire survey and gave consent for their children to be clinically examined. It was noted that 53% of children visited the dentist within six months and 77% within in the last year.
Table 1 shows the descriptive statistics of the fre-quency distribution of the socio-demographic and health-behavioural factors with the outcome variable of 6-monthly dental visits. In addition, median scores were calculated when the Shapiro-Wilk test indicated that the continuous variables that had significant deviation from the normal distribution. Table 2 shows the predictors that are significantly associated with dental visits at 6-month and twelve-6-month period using the original and non-imputed data whereas the statistically significant predictors for dental visits using imputed data are shown in Table 3.
Predictors such as age of the child and private health insurance coverage were statistically significant (p-value≤0.05) against both the outcome variables of dental visits (6-month and yearly visits) in all models as seen in Tables 2 and 3. In terms of age as a predictor variable, every year of increased age was associated with 8% lower odds (OR = 0.92, 95% CI: 0.85-0.99) (Table 2) in the 6-month visit and 13% lower odds in the yearly dental visit respectively (OR = 0.87, 95% CI: 0.79-0.96) (Table 2). Similarly, it is noted that children who had private health insurance had a 57% lower odds for a 6-month dental visit (OR = 0.43, 95% CI: 0.30-0.60) and a 46% lower odds for an annual dental visit (OR = 0.54, 95% CI: 0.35-0.83)
(Table 2). Furthermore, each additional serve of chocolate consumption increased children’s odds of visits the dentist in the last six months by 27% (OR = 1.27, 95% CI: 1.05-1.54) (Table 2).
Compared to mothers who have a university or col-lege degree, mothers who went to high school or com-pleted a vocational degree had about twice the odds of taking their child for a dental visit in the last 12 months (OR = 2.28, 95% CI: 1.34-3.90) (Table 2). However, in the combined household model of annual visit (Table 2), pensioners and unemployed parents had more than twice the odds of taking their children to the dentist compared to the children born to managers and profes-sional parents (OR = 2.64, 95% CI: 1.21-5.75). Finally, children having one or more dmft/DMFT scores had 37% lower odds of an annual dental attendance com-pared to children who do not have any dmft/DMFT scores (OR = 0.63, 95% CI: 0.43-0.94) (Table 2).
In terms of the key differences between the non-imputed and non-imputed models, Table 3 shows that mother’s extraction history had significant association with dental visits at 6-monthly period in the imputed model (OR = 1.04, 95% CI: 1.00-1.08). Besides mothers’ extraction history, no major differences were observed between the non-imputed and imputed models. On the contrary, the variable relating the children’s previous exposure to fluoridated water was found to be non-significant in the multiple analysis.
Discussion
This study provides a snapshot of the socio-behavioural and health-behavioural determinants on regular dental visits in primary school children living in the rural com-munity of Lithgow, Australia. Overall, 53% of children visited a dentist within six months and 77% within twelve months. In multiple logistic regression analyses, age of the child and private health insurance coverage were significantly associated with both 6-monthly and twelve-month dental visits. In addition, each serve of chocolate consumption was significantly associated with a 27% higher odds (OR = 1.27, 95% CI: 1.05-1.54) of a 6-monthly dental visit.
Table 1Descriptive statistics of socio-demographic and health-behavioural factors influencing 6-monthly dental visit in Lithgow school children
Factors influencing dental visits. N Has the child visited the dentist in the last 6 months?
Chi-squared p-value Yesn=353 Non= 312
Age of the child (In years - MAD) 665 353 (9.0) 312 (8.0) 0.278
Gender of the child 665 0.921
Male 179 (50.7%) 157 (49.3%)
Female 174 (50.3%) 155 (49.7%)
Frequency of tooth brushing 663 0.001*
Once or less 110 (31.3%) 135 (43.4%)
Twice or more 242 (68.8%) 176 (56.6%)
Decayed, missing and filled teeth status 665 0.025*
No dmft/DMFT 156 (44.2%) 165 (52.9%)
One or more dmft/DMFT 197 (55.8%) 147 (47.1%)
Has the child always lived in Lithgow? 665 0.009*
Yes 233 (66.0%) 120 (34.0%)
No 175 (56.1%) 137 (43.9%)
Number of Serves of sugar sweetened beverages consumed per day (MAD) 654 346 (2.0) 307 (3.0) 0.131
Number of serves of chocolate per day (MAD) 638 337 (1.0) 301 (1.0) 0.091
Child in single parent household? 665 0.277
Yes 65 (18.4%) 68 (21.8%)
No 288 (81.6%) 244 (78.2%)
Age of the Mother (In years–MAD) 659 348 (37.0) 311 (36.0) 0.040*
Age of the Fathera(In years–MAD) 527 283 (39.0) 244 (38.0) 0.003*
Mother’s country of birth 653 0.949
Overseas 29 (8.4%) 26 (8.5%)
Australia 318 (91.6%) 280 (91.5%)
Father’s country of birtha 529 0.754
Overseas 20 (7.0%) 19 (7.8%)
Australia 264 (93%) 226 (92.2%)
Mother’s Indigenous status 652 0.028*
Indigenous 5 (1.4%) 13 (4.3%)
Non-Indigenous 342 (98.6%) 292 (95.7%)
Father’s Indigenous statusa 535 0.415
Indigenous 5 (1.8%) 7 (2.8%)
Non- Indigenous 280 (98.2%) 243 (97.2%)
Education level of the Mother 651 0.297
University or College 91 (26.2%) 69 (22.7%)
High school or vocational training 256 (73.8%) 235 (77.3%)
Education level of the Fathera 530 0.360
University or College 46 (16.3%) 48 (19.4%)
High school or vocational training 236 (83.7%) 200 (80.6%)
Mother’s employment 654 0.006*
Managers and professionals 75 (21.5%) 63 (20.7%)
Skilled workers 173 (49.6%) 119 (39%)
Table 1Descriptive statistics of socio-demographic and health-behavioural factors influencing 6-monthly dental visit in Lithgow school children(Continued)
Father’s employmenta 526 0.490
Managers and professionals 88 (31%) 74 (30.6%)
Skilled workers 179 (63%) 147 (60.7%)
Pensioners and unemployed 17 (6%) 21 (8.7%)
Number of tooth extractions in Mother (MAD) 665 353 (0.0) 312 (1.0) 0.139
Number of tooth extractions in Fathera(MAD) 536 286 (0.0) 250 (2.0) 0.051
Private health insurance coverage 628 <0.001*
Yes 161 (48.3%) 81 (28.7%)
No 172 (51.7%) 214 (72.5%)
Annual household income 497 <0.001*
High (over 100,000) 42 (16.8%) 28 (11.3%)
Medium (40,000-100,000) 133 (53.2%) 101 (4.9%)
Low (up to 40,000) 75 (30.0%) 118 (47.8%)
a
Lower number of observations noticed in relation to father’s characteristics such as age, country of birth, Indigenous status, education, employment and extraction correspond to the children residing in a single parent household with mothers, where fathers’details are not applicable
MAD - Only median values were calculated for all continuous covariates because Shapiro-Wilk tests showed that they significantly deviated from following the Normal distribution
*Variables found to be statistically significant (p< 0.05) using Pearson’s chi-squared test
Table 2Multiple logistic regression of individual and combinedaparental characteristics with 6-monthly and twelve-monthly dental visits
Variables Model 1 (N = 585) Model 2 (N = 590) Model 3 (N = 585) Model 4 (N = 589)
Adjusted OR with 95% CIb Adjusted OR with 95% CIb Adjusted OR with 95% CIb Adjusted OR with 95% CIb
Age of the subject 0.92 (0.85, 0.99)* 0.92 (0.85, 0.99)* 0.87 (0.79, 0.96)* 0.88 (0.80, 0.97)*
Decayed, missing and filled teeth Status
NS2 NS2
No dmft/DMFT score 1.00 1.00
One or more dmft/DMFT score 0.64 (0.43, 0.94)* 0.62 (0.42, 0.92)*
Serves of chocolate per day 1.27 (1.05, 1.54)* 1.27 (1.05, 1.54)* NS2 NS2
Education level of the Mother NS2 NS2 NS2
University or College 1.00
High school or vocational training 2.28 (1.34, 3.91)*
Highest employment in the household
NS2 NS2 NS2
Managers and professionals 1.00
Skilled workers 1.47 (0.69, 3.15)*
Pensioners and unemployed 2.64 (1.21, 5.75)*
Private health insurance coverage
Yes 1.00 1.00 1.00 1.00
No 0.43 (0.30, 0.60)* 0.43 (0.30, 0.60)* 0.54 (0.35, 0.83)* 0.62 (0.39, 0.97)*
Model 1 - Original data with outcome variable as 6-month visit and individual parental characteristics Model 2–Original data with outcome variable as 6-month visit and combined parental characteristics Model 3–Original data with outcome variable as yearly visit and individual parental characteristics Model 4 - Original data with outcome variable as yearly visit and combined parental characteristics a
Combined parental traits indicate the highest of either parents’factors such as education, employment and extraction history OROdds ratio
b
Confidence interval
[image:6.595.56.539.398.657.2]and eruption of first permanent molars which would be uncomfortable [30]. Therefore, children with perceived needs (perception of parents) are more likely to be taken for regular dental visits to assess their eruption patterns and their overall oral health status [30]. In addition, maternal dental anxiety and concern about their child’s untreated caries and oral health are also reported to be significant predictors for regular dental service utilisation in children [31].
Children who were covered by private health insur-ance had lower odds of dental visits within the last 6 and 12 months of the survey (Table 2). This is consistent with AIHW findings which reported that uninsured children had a problem-oriented dental visits pattern and were more likely to visit the dentist for symptomatic relief compared to insured children [10]. In addition, evidence also suggests that nearly half the children attending public dental service did not have private health insurance [10].
Unsurprisingly, there was a statistically significant as-sociation between serves of chocolate and the increase in the odds of dental visits (6-monthly). Numerous stud-ies have reported that higher chocolate consumption leads to more numbers of decayed teeth which eventu-ally needs to be restored [32, 33]. The key difference in the imputed model was that extraction history of the mother was also significantly associated with 6-monthly dental visits as seen in Table 3. This is consistent with the findings of Dye et al. [34] who reported that children born to mothers who had high rates of tooth loss had three times higher odds of having poor oral health
outcomes. Therefore, it is evident that poorer maternal oral health is associated with substandard child oral health due to poor health behaviours and lifestyle choices [34].
Interestingly, children of mothers who did not have a university degree were more likely to visit the dentist annually. This finding contradicts most of the studies which report that mothers having higher education level have higher odds of taking their children for regular dental visits and vice versa [35, 36]. However, mothers with low education level have less oral health knowledge and are likely to have their child visit the dentist for an interventional treatment rather than a regular dental check-up [36]. However similar studies have reported that children of parents with low education levels visited a dentist more frequently (2.7 times) than children of highly educated parents for symptomatic relief [37]. Furthermore, Moimaz et al. reported that the greatest need for oral health treatment belonged to children of mothers with low education [38].
[image:7.595.56.539.99.294.2]In this study, it is seen that children with one or more dmft/DMFT scores had lower odds of making an annual dental visit. It is anticipated that this is due to the fact that children living in rural communities visit the dental visits only for symptomatic relief [39]. In addition, pen-sioners and unemployed parents in the study had twice higher odds to take their child for an annual dental visit. This may be because lower socio-economic residents in NSW are provided with a concession card which enables their family to access free public oral health services [10]. Further, the AIHW reports that children of parents who were cardholders, had twice higher odds of attending a Table 3Multiple logistic regression of imputed data comparing individual parental characteristics (6-month and 12-monthly dental visits)
Variables Model 5 (N= 665) Model 6 (N= 665)
Adjusted OR with 95% CIa Adjusted OR with 95% CIa
Age of the subject 0.91 (0.85, 0.99)* 0.87 (0.80, 0.96)*
Decayed, missing and filled teeth status NS2
No dmft/DMFT scores 1.00
One or more dmft/DMFT scores 0.60 (0.42, 0.88)*
Serves of chocolate per day 1.25 (1.03, 1.52)* NS2
Education level of the Mother NS2
University or College 1.00
High school or vocational training 2.02 (1.23, 3.32)*
Extraction history of Mother 1.04 (1.00, 1.08)* NS2
Private health insurance coverage
Yes 1.00 1.00
No 0.46 (0.34, 0.64)* 0.54 (0.36, 0.80)*
Model 5 - Imputed data with outcome variable as 6-month visit and individual parental characteristics Model 6 - Imputed data with outcome variable as yearly visit and individual parental characteristics OROdds ratio
a
Confidence interval
*Statistically significant (p-value < 0.05) NS2
public dental care annually especially for symptomatic relief compared to non-cardholders [10].
In this study, 98% of the children in the study reported to use fluoridated toothpaste. Numerous studies [40, 41] have established the invaluable clinical significance of fluoridated toothpaste and its beneficial effects on teeth. However, in the current study the use of fluoridated tooth-paste was not statistically significant to dental visiting.
Although a response rate of 50% is considered reason-able for validity of a study, lower response rates do not necessarily result in bias [42]. The Lithgow survey had a response rate of 42% which was less than anticipated. It was expected that response behaviour should have been higher because of the weekly reminder notices posted in the school newsletters [43]. In addition, low response rates might have been due to lack of interest in partici-pating in surveys that are not perceived as a salient need in a person’s life or due to the proliferating health liter-acies previously published by other health research articles [44, 45].
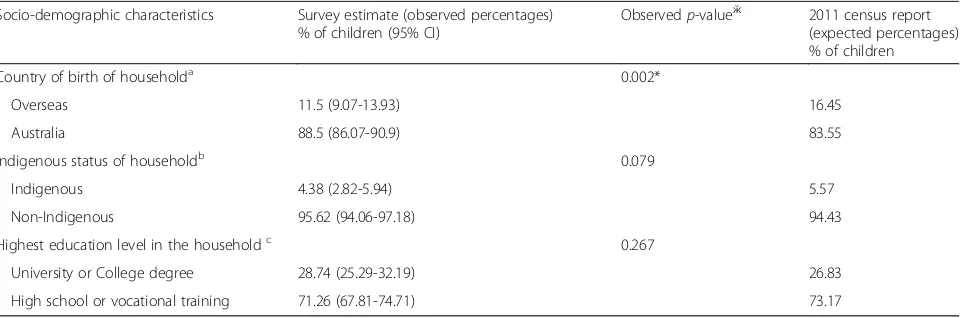
In order to clarify the potential for bias due to low response rates and to establish the generalisability of the study, the observed percentages of categories for se-lected socio-demographic variables from Lithgow survey were compared to the corresponding expected percent-ages of the same variables based on the selected post-codes of Lithgow from the 2011 ABS census reports as seen in Table 4 [27]. Three socio-demographic factors such as household country of birth, Indigenous status and education level were considered for comparison. The comparison demonstrated that the household education level and Indigenous status as estimated by Lithgow survey did not differ significantly from the corresponding variables for Lithgow based on census data. The study sample overestimated the proportion of
children born to Australian parents as compared to the Census by 3%. However, this overestimation is not ex-pected to influence the study’s outcomes because parent country of birth was not significantly associated with the primary outcome of the study (Table 1).
[image:8.595.59.539.531.690.2]In terms of the strengths of the study, the various pos-sible combinations with outcome variables of 6-month and yearly dental visits were analysed and examined. Although there were only a few missing observations, multiple imputations were employed to obtain complete cases which were compared to the corresponding original models. In addition, this study also provides valuable in-formation on the drivers and barriers of regular dental visits in Lithgow children which could prove useful in policy development. However, this study also has some opportunities for improvement worth reporting. This study used the WHO criteria to examine caries for field or epidemiological surveys. That is, caries in dentine (obvious cavitation seen with naked eye) was recorded on wet tooth surfaces. A drawback of the WHO method is that caries in the enamel cannot be examined which often requires proper dental equipment to isolate or dry the teeth. The low response rate and the use of self-reported question-naire might have contributed to some degree of bias affecting the results [46]. Although the questionnaire had good detail of all the factors, the reason for previous visit (six months or twelve months) was not recorded. Further-more, there is difficulty in establishing causation using the cross-sectional study design. In terms of scope for future research, the information of Lithgow survey could be used to possibly compare the oral health status before and after the effect of fluoridation. In addition, further research is needed to explore the impact of other possible predictors such as the role of dental phobia and anxiety on regular dental visits in
Table 4Population benchmark comparison of demographic characteristics of Lithgow from ABS census 2011 report
Socio-demographic characteristics Survey estimate (observed percentages) % of children (95% CI)
Observedp-valueӂ 2011 census report (expected percentages) % of children
Country of birth of householda 0.002*
Overseas 11.5 (9.07-13.93) 16.45
Australia 88.5 (86.07-90.9) 83.55
Indigenous status of householdb 0.079
Indigenous 4.38 (2.82-5.94) 5.57
Non-Indigenous 95.62 (94.06-97.18) 94.43
Highest education level in the householdc 0.267
University or College degree 28.74 (25.29-32.19) 26.83
High school or vocational training 71.26 (67.81-74.71) 73.17
ӂAddedp-value was obtained from z-test
*Statistically significant at 5 percent level a
Children were classified to the overseas born category if they had at least one parent who was born overseas b
Children were classified to the Indigenous category if they had at least one parent who was Indigenous c
children, and the parental perception on the level of prioritization of oral health for their children.
Conclusion
This study provides insight on the impacts of various social determinants on regular dental visits among primary school children living in the rural community of Lithgow, Australia. On the other hand, the utilisation of dental services and patterns of use also serve as critical indicators of oral health-related beliefs and behaviours of parents. It is imperative that the facilitators and barriers of regular dental visits in children residing in the regional Australian communities must be effectively addressed when developing the oral health promotion policies to ensure better health outcomes.
Abbreviations
ABS:Australian Bureau of Statistics; AIHW: Australian Institute of Health and Welfare; ARCPOH: Australian Research Centre for Population Oral Health; CI: Confidence intervals; DF: Difference of fit; DMFT: Decayed, missing and filled teeth in permanent dentition; dmft: Decayed, missing and filled teeth in primary dentition; FCS: Fully conditional specification; LGA: Lithgow Government Area; MCMC: Markov Chain Monte Carlo; NHMRC: National Health and Medical Research Council; NS: Non-Significant; NSW: New South Wales; OR: Odds ratio; SES: Socio economic status; SPSS: Statistical package for the social sciences; WHO: World Health Organisation
Acknowledgements
We would like to acknowledge the contribution of A/Professor Wendell Evans and Dr Athin Narayan Sujeer for the study. We would like to thank the school staff, parents and children for their contribution to the study.
Funding
The study was funded by Centre for Oral Health Strategy, NSW Health. Dr Amit Arora was supported by NHMRC Fellowship 1069861 and Project Grant 1033213 during this project.
Availability of data and materials
The datasets generated during and/or analysed during the current study are not publicly available due ethical reasons as this would compromise participant privacy. The consent form presented to participants made the commitment that only aggregated statistical information will be provided in any publication.
Authors’contributions
AA supervised the project and data collection; JRJ completed the literature review, carried out the data analysis, and drafted/edited the manuscript. HM, MD and AA provided statistical support and supervised in data analysis. SN and LGD assisted in literature review and editing the manuscript. AA, HM, SN and MD read and approved the final manuscript. All authors read and approved the final manuscript.
Competing interests
The authors declare that they have no competing interests.
Consent for publication
All parents/guardians consented to use their children’s de-identified data for publishing in scientific journals.
Ethics approval and consent to participate
Ethical approval for this dental public health survey was obtained from the Human Research Ethics Committee at the University of Sydney, Western Sydney Area Health Service, Catholic Education Board, and New South Wales Department of Education. A written informed consent to participate was taken from parents/guardians of all children.
Publisher’s Note
Springer Nature remains neutral with regard to jurisdictional claims in published maps and institutional affiliations.
Author details
1School of Science and Health, Western Sydney University, Campbelltown,
NSW, Australia.2Centre for Health Research, School of Medicine, Western
Sydney University, Campbelltown, NSW, Australia.3Clinical Research Centre, Sydney Local Health District, Camperdown, NSW, Australia.4Australian
Research Centre for Population Oral Health, University of Adelaide, Adelaide, SA, Australia.5Oral Health Services and Sydney Dental Hospital, Sydney Local
Health District, Surry Hills, NSW, Australia.6Discipline of Paediatrics and Child Health, Sydney Medical School, Westmead, NSW, Australia.7Collaboration for
Oral Health Outcomes Research, Translation, and Evaluation (COHORTE) Research Group, Ingham Institute for Applied Medical Research, Liverpool, NSW, Australia.
Received: 30 November 2016 Accepted: 5 April 2017
References
1. Do LG. Distribution of caries in children variations between and within populations. J Dent Res. 2012;91(6):536–43.
2. Australian Institute of Health and Welfare: oral health and dental care in Australia key facts and figures: 2015, Cat. no. DEN 229. http://www.aihw.gov. au/WorkArea/DownloadAsset.aspx?id=60129554609 (2016). Accessed 10 Aug 2016.
3. van Gemert-Schriks MC, van Amerongen EW, Aartman IH, Wennink JM, Jacob M, de Soet JJ. The influence of dental caries on body growth in prepubertal children. Clin Oral Investig. 2011;15(2):141–9.
4. Leal SC, Bronkhorst EM, Fan M, Frencken JE. Untreated cavitated dentine lesions: impact on children’s quality of life. Caries Res. 2012;46(2):102–6. 5. NSW Department of Health: NSW little smiles: dental health resource
package for childcare professionals. http://www.health.nsw.gov.au/ oralhealth/Publications/nsw-little-smiles.pdf (2010). Accessed 8 Aug 2016. 6. Crocombe LA, Broadbent JM, Thomson WM, Brennan DS, Poulton R. Impact
of dental visiting trajectory patterns on clinical oral health and oral health‐ related quality of life. J Public Health Dent. 2012;72(1):36–44.
7. Langevin SM, Michaud DS, Eliot M, Peters ES, McClean MD, Kelsey KT. Regular dental visits are associated with earlier stage at diagnosis for oral and pharyngeal cancer. Cancer Causes Control. 2012;23(11):1821–9.
8. Australian Research Centre for Population Oral Health. Oral health messages for the Australian public. Findings of a national consensus workshop. Aust Dent J. 2011;56:331–5.
9. Do LG, Spencer AJ. The Beginning of Change: Queensland Child Oral Health Survey 2010–2012. https://publications.qld.gov.au/storage/f/2014-08-06T03%3A11%3A44.862Z/oral-health-survey-2010-12.pdf (2014). Accessed 14 Sept 2016.
10. Australian Institute of Health and Welfare: Child and teenager oral health and dental visiting: Results from the National Dental Telephone Interview Survey 2010. Dental Statistics and Research Series no. 64. Cat. no DEN 226. http://www.aihw.gov.au/WorkArea/DownloadAsset.aspx?id=60129543618 (2013a). Accessed 10 Aug 2016.
11. Arora A, Evans RW, Sivaneswaran S, Sujeer AN, Blinkhorn AS. Parental support for water fluoridation in Lithgow, New South Wales. Aust Dent J. 2010;55(4):417–22.
12. Arora A, Evans RW. Dental caries in children: a comparison of one non-fluoridated and two non-fluoridated communities in NSW. NSW Public Health Bull. 2011;21(12):257–62.
13. Lee JG, Brearley Messer LJ. Contemporary fluid intake and dental caries in Australian children. Aust Dent J. 2011;56(2):122–31.
14. Australian Institute of Health and Welfare: The dental health of Australia’s children by remoteness: Child Dental Health Survey Australia 2009. Dental statistics and research series no. 63. Cat. no. DEN 225. http://www.aihw.gov. au/WorkArea/DownloadAsset.aspx?id=60129543391 (2013b). Accessed 11 Aug 2016.
16. Fisher-Owens SA, Gansky SA, Platt LJ, Weintraub JA, Soobader MJ, Bramlett MD, Newacheck PW. Influences on children’s oral health: a conceptual model. Pediatrics. 2007;120(3):e510–20.
17. Gussy MG, Waters EB, Riggs EM, Lo SK, Kilpatrick NM. Parental knowledge, beliefs and behaviours for oral health of toddlers residing in rural Victoria. Aust Dent J. 2008;53(1):52–60.
18. Phelan C, Byun R, Skinner JC, Blinkhorn AS. Child Dental Health Survey 2007: a snapshot of the oral health status of primary school-aged children in NSW. NSW Public Health Bull. 2009;20(4):40–5.
19. World Health Organisation. Oral health surveys: Basic Methods, 4th edn. Geneva: World Health Organisation; 1997.
20. Klein H, Palmer CE, Knutson JW. Studies on dental caries: dental status and dental needs of elementary school children. Public Health Rep. 1938;53(19): 751–65.
21. Cohen J. A coefficient of agreement for nominal scales. Educational and psychological measurement. Educ Psychol Meas. 1991;51:95–101. 22. Osborne JW, Overbay A. The power of outliers (and why researchers should
always check for them). Pract Assess Res Eval. 2004;9(6):1–2. 23. Rubin DB. Multiple imputation after 18+ years. J Am Stat Assoc. 1996;
91(434):473–89.
24. Mackinnon A. The use and reporting of multiple imputation in medical research–a review. J Intern Med. 2010;268(6):586–93.
25. Spratt M, Carpenter J, Sterne JA, Carlin JB, Heron J, Henderson J, Tilling K. Strategies for multiple imputation in longitudinal studies. Am J Epidemiol. 2010;172(4):478–87.
26. Schafer JL. Analysis of incomplete multivariate data. 1st ed. London: Chapman & Hall; 1997.
27. Australian Bureau of Statistics. Lithgow (C) (LGA) region data summary. 2011. http://stat.abs.gov.au/itt/r.jsp?RegionSummary®ion=
14870&dataset=ABS_REGIONAL_LGA&geoconcept=REGION&datasetASGS= ABS_REGIONAL_ASGS&datasetLGA=ABS_REGIONAL_LGA®ionLGA= REGION®ionASGS=REGION. Accessed 21 Sept 2016.
28. Hjern A, Grindefjord M, Sundberg H, Rosén M. Social inequality in oral health and use of dental care in Sweden. Community Dent Oral Epidemiol. 2001;29(3):167–74.
29. McGrath C, Yeung CY, Bedi R. Are single mothers in Britain failing to monitor their oral health? Postgrad Med J. 2002;78(918):229–32. 30. Fehrenbach MJ, Weiner J, Nelson DM. Community oral health. In: Saunders
review of dental hygiene. 2nd ed. St. Louis: Saunders; 2009. p. 549–74. 31. Machry RV, Tuchtenhagen S, Agostini BA, da Silva Teixeira CR, Piovesan C,
Mendes FM, Ardenghi TM. Socioeconomic and psychosocial predictors of dental healthcare use among Brazilian preschool children. BMC Oral Health. 2013;13(1):1. 32. Mafuvadze BT, Mahachi L, Mafuvadze B. Dental caries and oral health
practice among 12 year old school children from low socio-economic status background in Zimbabwe. Pan Afr Med J. 2013;14:164.
33. Doichinova L, Bakardjiev P, Peneva M. Assessment of food habits in children aged 6–12 years and the risk of caries. Biotechnol Biotechnol Equip. 2015; 29(1):200–4.
34. Dye BA, Vargas CM, Lee JJ, Magder L, Tinanoff N. Assessing the relationship between children’s oral health status and that of their mothers. J Am Dent Assoc. 2011;142(2):173–83.
35. Camargo MB, Barros AJ, Frazão P, Matijasevich A, Santos IS, Peres MA, Peres KG. Predictors of dental visits for routine check-ups and for the resolution of problems among preschool children. Rev Saude Publica. 2012;46(1):87–97. 36. Nourijelyani K, Yekaninejad MS, Eshraghian MR, Mohammad K, Foroushani AR, Pakpour A. The influence of mothers’lifestyle and health behavior on their children: an exploration for oral health. Iran Red Crescent Med J. 2014; 16(2):e16051.
37. SaldūnaitėK, BendoraitienėEA, SlabšinskienėE, VasiliauskienėI, AndruškevičienėV, ZūbienėJ. The role of parental education and socioeconomic status in dental caries prevention among Lithuanian children. Medicina. 2014;50(3):156–61.
38. Moimaz SA, Fadel CB, Lolli LF, Garbin CA, Garbin AJ, Saliba NA. Social aspects of dental caries in the context of mother-child pairs. J Appl Oral Sci. 2014;22(1):73–8.
39. National Rural Health Alliance: Oral and dental health. http://ruralhealth.org. au/sites/default/files/publications/nrha-oral-health-fact-sheet.pdf (2013). Accessed 1 Oct 2016.
40. Marinho VCC, Worthington HV, Walsh T, Clarkson JE. Fluoride varnishes for preventing dental caries in children and adolescents. Cochrane Database of Syst Rev. 2013, Issue 7. Art. No.: CD002279. doi:10.1002/14651858.CD002279.pub2.
41. dos Santos AP, Nadanovsky P, de Oliveira BH. A systematic review and meta‐analysis of the effects of fluoride toothpastes on the prevention of dental caries in the primary dentition of preschool children. Community Dent Oral Epidemiol. 2013;41(1):1–2.
42. Nulty DD. The adequacy of response rates to online and paper surveys: what can be done? Assess Eval High Educ. 2008;33(3):301–14. 43. Yamarino FJ, Skinner SJ, Childers TL. Understanding mail survey response
behavior a meta-analysis. Public Opin. 1991;55(4):613–39. 44. Galea S, Tracy M. Participation rates in epidemiologic studies. Ann
Epidemiol. 2007;17(9):643–53.
45. Arora A, Liu MN, Chan R, Schwarz E.‘English leaflets are not meant for me’: a qualitative approach to explore oral health literacy in Chinese mothers in Southwestern Sydney, Australia. Community Dent Oral Epidemiol. 2012; 40(6):532–41.
46. Delgado-Rodriguez M, Llorca J. Bias. J Epidemiol Community Health. 2004; 58(8):635–41.
• We accept pre-submission inquiries
• Our selector tool helps you to find the most relevant journal
• We provide round the clock customer support
• Convenient online submission
• Thorough peer review
• Inclusion in PubMed and all major indexing services • Maximum visibility for your research
Submit your manuscript at www.biomedcentral.com/submit