R E S E A R C H A R T I C L E
Open Access
Exploring the use of internal and externalcontrols
for assessing microarray technical performance
Katrice A Lippa
1*, David L Duewer
1, Marc L Salit
1, Laurence Game
2, Helen C Causton
2,3Abstract
Background:The maturing of gene expression microarray technology and interest in the use of microarray-based applications for clinical and diagnostic applications calls for quantitative measures of quality. This manuscript presents a retrospective study characterizing several approaches to assess technical performance of microarray data measured on the Affymetrix GeneChip platform, including whole-array metrics and information from a standard mixture of external spike-in and endogenous internal controls. Spike-in controls were found to carry the same information about technical performance as whole-array metrics and endogenous“housekeeping”genes. These results support the use of spike-in controls as general tools for performance assessment across time, experimenters and array batches, suggesting that they have potential for comparison of microarray data generated across species using different technologies.
Results:A layered PCA modeling methodology that uses data from a number of classes of controls (spike-in hybridization, spike-in polyA+, internal RNA degradation, endogenous or“housekeeping genes”) was used for the assessment of microarray data quality. The controls provide information on multiple stages of the experimental protocol (e.g., hybridization, RNA amplification). External spike-in, hybridization and RNA labeling controls provide information related to both assay and hybridization performance whereas internal endogenous controls provide quality information on the biological sample. We find that the variance of the data generated from the external and internal controls carries critical information about technical performance; the PCA dissection of this variance is consistent with whole-array quality assessment based on a number of quality assurance/quality control (QA/QC) metrics.
Conclusions:These results provide support for the use of both external and internal RNA control data to assess the technical quality of microarray experiments. The observed consistency amongst the information carried by internal and external controls and whole-array quality measures offers promise for rationally-designed control standards for routine performance monitoring of multiplexed measurement platforms.
Background
Expression profiling using DNA microarrays is increas-ingly being used for clinical and diagnostic applications and in support of regulatory decision-making. These applications require the technology to be robust and reliable and that the data be well characterized [1]. The quality of data generated varies considerably between laboratories [2,3] as well as between platforms [4,5]. One initiative working to provide tools for technical performance assessment of microarray gene expression
data is the External RNA Control Consortium (ERCC) [6-9]. The external,“spike-in”controls from this group are intended to be informative about the quality of a gene expression assay independent of microarray plat-form, experiment, or species. This paper presents evi-dence that the spike-in controls carry the essential quality information about an experiment. Data obtained from spiked-in controls was compared with that carried by full-array quality metrics, which typically depend on platform, experiment, and species. These results support the proposition that spike-in controls can be used on their own as tools for assessing data quality and com-paring data generated as part of different experiments.
* Correspondence: [email protected]
1
Chemical Science and Technology Laboratory.National Institute of Standards and Technology (NIST) Gaithersburg, Maryland 20899 USA
Full list of author information is available at the end of the article
Data quality can be assessed at a number of stages within the microarray experiment (from the integrity of the biological sample to the accessibility of the data stored in a databank repository) [10]. Few universal data quality metrics are available as there are a large number of array types, labeling methods, scanner types, and sta-tistical approaches available to summarize and analyze the data. The determination of integrated whole-array data quality indicators is not yet a standard practice, and is considered an important research topic area in biostatistics [11,12], as highlighted by Brettschneider et al. [13]. The need for better quality metrics is not limited to gene expression measurements generated using microarrays: a number of other high throughput technologies (e.g., multiplex protein arrays) lack obvious simple scalar metrics that can be used to assess quality [14,15].
A number of initiatives including the Microarray Quality Control (MAQC) project of the FDA http:// www.fda.gov/nctr/science/centers/toxicoinformatics/ maqc/ and the ERCC are working to develop reference data sets, reference RNAs, and standard external con-trols intended for use in the evaluation of microarray performance [6-9]. The ERCC seeks to employ external spike-in control measurements to assess technical per-formance with a standard set of controls in a consistent manner using metrics that can be compared across experiments, labs, platforms, and other factors as they arise. The ERCC is developing the standard controls, analysis tools, and protocols for using these controls and tools to enable consistent assessment and monitor-ing of technical performance.
The MAQC project has examined the use of a diverse set of external controls for a number of platforms [16], noted that external controls have yet to be widely used for performance assessment, and made recommenda-tions for doing so. Analysis of the control signals to assess performance was largely through quantitative characterization of the slope of the signal-concentration curve. A significant observation from this work was the identification of outlier data at one participant’s site using principal component analysis (PCA) of the exter-nal controls. More recent aexter-nalysis of the various spike-in controls employed spike-in the measurements for the MAQC project demonstrated promise that the spike-in controls were informative of“outlying”arrays, and that they exhibit behavior that is independent of the sample type [17].
This work characterizes the internal and external con-trol data, separate from the signal derived from the bio-logical sample, from a microarray experiment generated on the Affymetrix GeneChip platform. The internal con-trols are Affymetrix-specified probesets that represent
RNA degradation internal controls or “housekeeping”
genes and are routinely examined to reveal the quality of the sample RNA (Figure 1a). The external, or“ spike-in”, controls are typically RNA transcripts produced by
in vitrotranscription that are added at a particular stage
in the generation of the labeled sample transcriptome extract, at a known concentration (Figure 1a and 1b). The expression measures of these controls carry infor-mation about variation arising from a number of sources; both classes of internal controls should carry information on all of the sources of the variability in the experiment (Figure 1a). The polyA+ controls should carry information about the technical variation associated with amplification and labeling procedures only -and not variation arising from sampling - whereas the hybridization controls should carry information about variability arising from hybridization and scanning only. Employing PCA as an exploratory data analysis tool, it was anticipated that the variance structure associated with the individual steps of the microarray experiment would be revealed through the resultant scores and loadings profile of the PCA models of these four sepa-rate classes of control data.
Knowledge of the quantity of each spike added and the relative intensities of the signals can be compared against the expression measures obtained from global gene expression; this has been used as the basis of com-parison between data generated on different arrays [18]. Deviations from the expected signal-concentration rela-tionship for the spike-in controls should be informative about the technical performance of the measurement [7,19-24]. Critically, the utility of the information carried by the spike-in controls relies on the assumption that the controls act as meaningful proxies for the endogen-ous genes and that their behavior is representative of these genes of interest. The retrospective study underta-ken here tests that assumption.
Hybridization-wise PCA was also used to compare the results of individual PCA models obtained from the control probeset data with independent laboratory mea-sures of RNA- and hybridization-specific quality and full-array metrics [13]. Our results underscore the importance of assessing data quality and reveal some of the strengths and limitations of using spike-in and endo-genous controls for assessing data quality.
Methods
standard protocols for generating labeled cRNA in their own laboratories. Prelabeled hybridization controls were purchased from Affymetrix and added to the labeled samples at the Centre prior to hybridization.
The polyA+ controls are a cocktail of 5 polyA-tailed
Bacillus subtilis transcripts (Lys, Phe, Dap, Thr, and
Trp) (Figure 1b). These controls are spiked into total RNA in a fixed ratio to a fixed amount of total RNA and were carried through the sample preparation and used to monitor the efficiency of cRNA labeling and
data quality. The hybridization controls (BioB, BioC,
BioD, and Cre biotin-labeled transcripts) were spiked
Hybridization
Scanning Amplification/
Labeling
Sample Extraction
RNA Degradation
Hybridization
Scanning Amplification/
Labeling
RNA Degradation
Hybridization
Scanning Hybridization
Scanning
Amplification/ Labeling
Internal “Housekeeping”
Controls
Internal RNA Degradation
Controls
External Polyadenylated
Controls
External Hybridization
Controls
PolyA+ Controls Total RNA
Synthesis, Amplification, and Biotin Labeling of cRNA
Fragmented cRNA
Washing/Staining
Scanning Fragmentation of cRNA
Hybridization Controls
Hybridization
Five polyA-tailed Bacillus subtilistranscripts (Lys, Phe, Dap, Thrand Trp) are added at different concentrations as part of a cocktail.
Three Escherichia coli
transcripts (BioB,BioC, BioD) and one P1 bacteriophage transcript (Cre) that are biotin-labeled and added at different concentrations as part of a cocktail.
(b) (a)
into the hybridization cocktail according to the manu-facturer’s instructions. They are used to align the grid and assess the efficiency of hybridization, washing and staining.
Extensive whole-array quality assurance metrics and BioConductor-based summary statistics [27-30] related to scanner/array performance and RNA quality are rou-tinely assembled for each of the datasets with a report generated at the CSC/IC Microarray Centre. These reports are included in the MiMiR database, together with the individual hybridization files and experimental ontology and annotation information [25,26].
The Microarray Centre QA report metrics are based on .CEL file signal intensity data from GeneChip arrays and include summary statistics of all the hybridizations within a particular experiment generated using the Bio-Conductor (BioC Release 1.9) open source software. This report provides quality assessment metrics based on: 1) Diagnostic Plots, 2) Probe-level Robust Multichip Average (RMA) Model Estimates, 3) Probe Metrics and 4) Principal Component Analysis. The first two sections include summaries of log2probe RMA intensities before
and after normalization as well as the RMA model fit residuals, relative log2expression (RLE) and normalized
unscaled standard error (NUSE) plots for the identifica-tion of outlier arrays within an experiment dataset.
In addition, RNA degradation plots show the log2mean
intensity by probe pair position (5’end to 3’end) for each array and are used to identify samples that may have been subject to degradation. The third section, Probe Metrics, are obtained from BioConductor MAS 5.0-based statistical algorithms and are used to assess both RNA assay and hybridization performance. These include measures of scanner variability (e.g., RawQ), summarized exogenous control intensities with respect to their spike-in concentration levels, correlation mea-sures between exogenous polyA+ controls and raw sig-nal values, and 3’/5’ratio measures for both exogenous and endogenous controls to assess the efficiency of labeling and/or sample RNA integrity. The fourth and last section provides a simplified PCA scores plot gener-ated from the complete set of probes (including back-ground and all exogenous and endogenous control probes) to identify gross outliers within the experimental dataset as a whole. A recent review of these metrics as they relate to the quality assessment of microarray data after statistical processing is provided by Brettschneider et al. [13]
Data Examined in this Study
Data from 525 hybridizations representing 22 publicly-avail-able experiments generated over a five-year period at the CSC/IC Microarray Centre on multiple types of GeneChips were analyzed as part of this study and included human
(HG-U133A, HG-U133B, HG-U133plus2), rat (RG-230_2, RAE230A, RAE230B) and mouse (MG-430_2, MOE430A, MOE430B, MG-U74v2A, MG-U74v2B, MG-U74v2C) microarrays. A single, exemplary experiment containing data from 137 Rat Genome RAE230A arrays is highlighted for this manuscript. This included data generated on differ-ent days over a 10-month period, with differdiffer-ent experimen-ters, array batches, and QC measures from the whole-array QC report. This example was analyzed using PCA and the results compared to the QC and factor information avail-able within the MiMiR database.
PCA was conducted using only data from the control-based probesets (excluding all the non-control (back-ground) probeset signals). There are four groups, or classes, of controls, external and internal to the biologi-cal sample (exogenous and endogenous). The external controls were either polyA+ RNAs spiked into the sam-ple before amplification and labeling or prelabeled hybridization controls spiked into the sample prior to hybridization. The internal controls are those suggested by Affymetrix as a measure of RNA degradation, and
report on relatively invariant ‘housekeeping’ genes.
Microarray probesets for the same external controls are present on all Affymetrix GeneChip arrays; probesets for the endogenous controls are organism-specific and are common to all arrays of such type (i.e., rat).
Dataset Construction and Preprocessing
Probeset data from the individual hybridizations on RAE230A arrays (EXP_CWTA_0103_01; Array Express ID E-MIMR-222) are described in this manuscript. In brief, this experiment is a comparison of gene expression profiles of peritoneal fat of 6-week rats from 30 recombi-nant inbred (RI) strains derived from the spontaneously hypertensive rat (SHR/Ola) and Brown Norway congenic carrying polydactylyl-luxate syndrome (BN-Lx) strains. A single hybridization (HFB2003080611Aaa) was missing annotation for experimental QC and was thus omitted from the data analysis. A summarized version of the annotation QC information pertaining to the individual hybridizations used in this experimental dataset is pro-vided in Additional File 1: Supplemental Table S1.
percentile of the log2intensities for the background
pro-besets associated with the individual hybridization was determined and then subtracted from the probesets of interest (i.e., hybridization and polyA+ spike-in controls and the internal Affymetrix-designated cRNA degrada-tion and endogenous control/housekeeping gene con-trols). This‘brightness-scaled”normalization approach was employed to support control data aggregation across multiple array types can be generated on a similar scale can thus directly compared and permits the identification of sample-associated variability. This 75th percentile nor-malization was carried out for several datasets that were generated across multiple array types (data not shown) when aliquots of the same samples were hybridized to arrays of the same or different type (e.g. RAE230A and
RAE230B). The 75th percentile normalization was the
default data analysis method for our investigations.
Mean/SD Plots
The mean and standard deviation (SD) of the RMA values were calculated for all probesets within an experi-ment conducted on a single array type, comparable to other informatic methods for generating probeset-level precision metrics [2,31-33]. All mean and associated SD data pairs were employed to generate mean/SD plots that highlight control probesets associated with the hybridization, polyA+, RNA degradation, and endogen-ous control/’housekeeping genes’(as defined by Affyme-trix for specific array types). The remaining non-control sample probesets were displayed as background for the mean/SD plots; the background average line of these data was determined as a 100-point moving average of the mean values for all the non-control probesets. All calculations were carried out using Excel code.
Chemometric Analysis
PCA was conducted for all experimental datasets using PLS_Toolbox 4.2.1 (Eigenvector Research, Inc., Wenatchee, WA) within a MATLAB v. 7.5.0.342 (R2007b) (Math-Works, Inc., Natick, MA) computational environment. Each experimental dataset was separated into four subsets representing the: 1) spike-in hybridization controls, 2) spike-in polyA+ controls, 3) internal RNA degradation
controls (Affymetrix-designated) and 4) endogenous or normalization control genes http://www.affymetrix.com/ support/technical/mask_files.affx). Each PCA data subset was organized into a single data block structure with dimensions ofNrows×Kcolumnsthat correspond toN
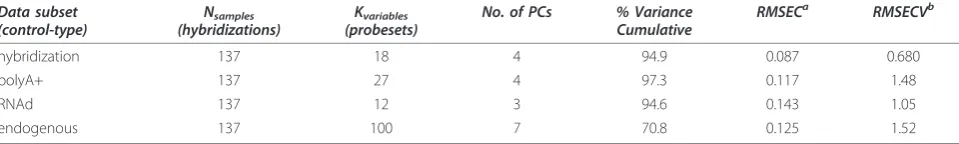
sam-ples (hybridizations) andKvariables (probesets) (see Table 1). Each variable in the dataset was centered to have a mean of zero but was not variance scaled. A complete list of the spike-in control probe set identifiers together with the internal RNA degradation and endogenous control probe set identifiers is provided in Additional File 1: Sup-plemental Table S2.
The optimal number of components to include in the PCA model was determined by the minimum of both the root mean square error of calibration (RMSEC) and of cross-validation (RMSECV) employing a venetian blinds algorithm for which the dataset were split accord-ing to their size (here 10 splits for 137 hybridizations). Datasets that contain duplicate hybridizations were sub-ject to replicate sample trapping as the presence of related samples in test and training sets may lead to skewed cross-validation results. Here, an additional cross-validation using a random subset scheme was employed and checked for consistency with the venetian blinds approach. A summary of the PCA models includ-ing the cumulative % variance captured for each model is provided in Table 1.
Results and Discussion
[image:5.595.58.538.640.712.2]In this evaluation of internal and external controls for asses-sing microarray performance, it is assumed that these con-trols act in a manner similar to and consistent with endogenous transcripts in the biological sample when all are assayed with gene expression microarrays. To provide an initial quality assessment of the probeset-specific perfor-mance, the variance behavior of the individual probesets of the controls was examined in relation to average signal level across the entire experiment. Similar approaches have been employed to illustrate relationships between probeset signal level and precision metrics in microarray data [2,31-33]. The mean and standard deviation (SD) of the RMA values for all probesets for the 137 hybridizations of the rat experi-ment is illustrated in Figure 2 for preprocessing with (a) no
Table 1 Summary of the PCA models (Nsamples × Kvariables) obtained from the four control subsets of the single Rat experiment
Data subset (control-type)
Nsamples (hybridizations)
Kvariables (probesets)
No. of PCs % Variance Cumulative
RMSECa RMSECVb
hybridization 137 18 4 94.9 0.087 0.680
polyA+ 137 27 4 97.3 0.117 1.48
RNAd 137 12 3 94.6 0.143 1.05
endogenous 137 100 7 70.8 0.125 1.52
a
Root mean square error of calibration (model)
b
normalization, (b) quantile normalization and (c) 75th per-centile normalization. A comparison of the normalization approaches on this dataset illustrates that the dispersion pattern of the external spike-in controls, as well as the internal Affymetrix controls relative to the mean of the background probesets, are comparable for the (b) quantile normalization and (c) 75th percentile normalization, parti-cularly for intensities greater than 28. The greatest differ-ence observed is for probesets with intensities less than 26, for which the data resembles a“non-normalized”pattern.
The different classes of controls are distinct in terms of the overall variability (SD) across their inherent RMA intensities; this observed difference among the control groups can be used as a screening tool to identify high-quality experimental datasets from the lower-high-quality or
more “noisy” datasets [2]. The experimental dataset
shown in Figure 2 is considered of“high-quality”, given that the precision for the various controls (as a group) does increase in a systematic fashion with respect to the amount of experimental processing that each group has experienced (Figure 1a). The hybridization controls are expected to have the lowest variability as they are added at the last experimental stage, whereas the polyA+ and endogenous controls are subject to amplification/label-ing and degradation steps, respectively, and are thus expected to exhibit greater variability. The overall dis-persion of the non-control (background) probesets lends insight into the relative “noise” of the data. For this experiment, the spike-in hybridization controls are at this average or below the average of the non-control probesets whereas the spike-in polyA+ controls are well above this average and near the upper-limit of the back-ground probesets. Notably, the 100 internal endogenous
controls or “housekeeping genes” have consistently
lower variability across the range of RMA intensities. The mean/SD plots also reveal the relative precision of individual probesets within a control group relative to other probesets in the experimental dataset. A few of the internal RNA degradation probesets are considerably more variable than both the average background signal and the internal endogenous genes. As shown in Figure 2, the control probesets with the greatest variability include the AFFX_Rat_GAPDH_5_at and AFFX_Rat_GAPDH_-M_at RNAd controls (RG5 and RGm, respectively) and theDap,Thr,PheandLyspolyA+ controls (v/V, w, Y and x/X, respectively). Greater variability, likely attributable to differences in processivity during cRNA labeling, is gener-ally observed for the 5’probesets (denoted with“5”), fol-lowed by a moderate level of variability for the probesets that target the middle of the transcript (denoted with “m”). As provided by the quality metrics in the Microarray Centre Quality Assessment (QA) report [26], the majority of hybridizations from this experiment are of acceptable quality, however, several hybridizations exhibit lesser
quality and may contribute to the greater variability observed in these probesets. The QA report for Experi-ment CWTA_0103_01 is included as Additional File 2.
The mean/SD dispersion plots provide an overview of quality through an assessment of probeset-specific per-formance within the experimental dataset but do not definitively identify particular samples that may be out-liers within the experimental dataset. Samples that con-tribute the greatest amount of variance to the experiment can be resolved through a PCA of the spike-in controls and can be used to identify problems with the discrete sample preparation steps (e.g., hybridization or RNA amplification). Likewise, PCA models of the internal controls can be utilized to verify sample RNA integrity or to account for other sample degradation issues.
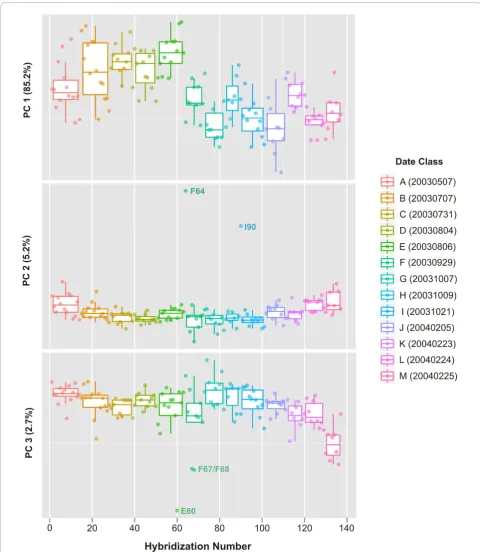
Spike-in Hybridization Controls
In an effort to identify individual arrays that may be pro-blematic, PCA was employed to explore the variability within the spike-in hybridization control dataset. PCA score plots for the first three principal components (PCs) of the hybridization control data subset of the rat CWTA dataset are shown in Figure 3. The data are classified by the date on which a hybridization was performed. For this experiment, a total of 13 hybridization dates were recorded ranging from May 7, 2003 (20030507) to Febru-ary 25, 2004 (20040225) and are color-coded and denoted by a letters ranging from“A”to“M”. The first PC repre-sents roughly 85% of the model variance and highlights a shifting of hybridization intensities between those of date
class “E” (20030806) and those of date class “F”
(20030929). PC 2 captures an additional 5% of the overall model variance and separates hybridizations (F64 and I90) that have both low quality Scan QC measures (values of 4) and also are outliers with respect to the Normalized Unscaled Standard Error (NUSE) plot [28], shifted log2
probe intensities as well as relatively high average array background values and RawQ noise values, the latter of which is a measure of pixel-to-pixel variation among the probesets that is used to calculate the array background [34]. Notably, I90 (NNC2003102101A, Aliquot ID FMTA0048_a; see Table S-1) is a re-hybridization of sam-ple F64 (NNC2003092901A), however there was little improvement to the overall hybridization metrics (i.e., Scan QC, NUSE) Consistent with the relatively high abun-dance of the biotin-labeled spike-in controls, the scores for PC 2 and PC 3 (< 3% variance) separates hybridizations (F67, F68 and E60) that have relatively low quality Scan QC measures (3 or 4) and have more moderate-to-high average array background values and RawQ values.
28 26 24
22 210 212 214 216
22 23
21
20 0
1 2 3 Fa c tor S ta nda rd D e v ia ti o n non-control
non-control moving mean endogenous
RNAd polyA+ hybridization
216 210 212 214
22 24 26 28
20 21 23 22 0 1 2 3 F acto r S ta n d a rd D e vi at io n
(a)
(b)
20 2-2 2-42-6 22 24 26 28
20 23 22 21 0 1 2 3 Mean Fa c tor St a n da rd D e v ia tion RG 5 RG m Rb A c tm + X3 /X 5 Rb A c t5 + X m /xm /x5 ym /Y m vm
(c)
wm v5 v3/
V5
28 26 24
22 210 212 214 216
22 23
21
20 0
1 2 3 Fa c tor S ta nda rd D e v ia ti o n non-control
non-control moving mean endogenous
RNAd polyA+ hybridization
216 210 212 214
22 24 26 28
20 21 23 22 0 1 2 3 F acto r S ta n d a rd D e vi at io n
(a)
(b)
20 2-2 2-42-6 22 24 26 28
20 23 22 21 0 1 2 3 Mean Fa c tor St a n da rd D e v ia tion RG 5 RG m Rb A c tm + X3 /X 5 Rb A c t5 + X m /xm /x5 ym /Y m vm
(c)
wm v5 v3/
[image:7.595.60.536.87.631.2]V5
variation (those that reside outside the PCA model space). In addition, Hotelling T2 values can be used to identify samples that are outliers and that might possess relatively high leverage along the principal axis of the model, analogous to the end points of a linear regres-sion model. The Q residuals in Supplemental Figure S1 (a) highlight hybridization B22, which has also been flagged as potential outlier by the NUSE plot. Hotelling T2 values consistently highlight hybridizations F64, E60, I90, F68 for which scanner QC measures have been denoted as problematic (values of 3 or 4).
Spike-in PolyA+ Controls
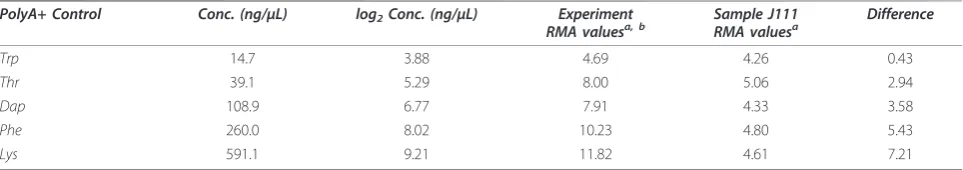
A cocktail of RNA controls with artificial polyA+ tails are spiked into each RNA sample over a range of con-centrations (Table 2) to monitor the entire sample label-ing process. All of the polyA+ controls should be scored as “Present” with signal values: Lys >Phe >Dap >Thr >Trp. For this experiment, an extremely low correlation
(R2 = 0.4498) between the polyA+ spike in
concentra-tion and raw signal value observed for hybridizaconcentra-tion NNC2004020512Aaa (sample J111) as reported in the MiMiR QA report. Correlation values of R2 > 0.95 are expected for typical samples. Outliers such as these are easily identified through an examination of the relative RMA intensities; as an example, the relative RMA inten-sities for this extreme polyA+ control outlier are shown in Table 2. The difference observed between the average experiment RMA intensity values and that of sample J111 is linearly correlated with log2 concentrations for
the polyA+ spike-in controls.
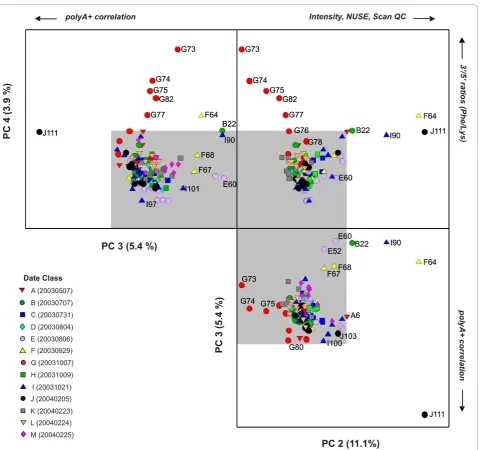
The PCA model for the polyA+ controls comprises of 4 PCs. The first PC captures the largest variance (76.8%) and primarily separates hybridization J111 from the other 136 hybridizations within the experimental dataset (data in Additional File 1: Supplemental Figure S2(a)). PCs 2, 3 and 4 describe the remaining 20% of variance captured for this model and illustrate more subtle pat-terns of spike-in polyA+ control quality (Figure 4) that are not readily seen by examining the relative intensities of the controls alone. An unfolded 3-dimensional PCA scores plot of these lower PCs illustrates the various
outlying hybridizations that correspond to definitive quality control parameters associated with both assay and hybridization performance. PC 2 (11% of variance) separates hybridizations with the most extreme differ-ences in probe intensities and array background (F64, the I90 re-hybridization of F64, and B22) whereas PC 3 has a primary contribution from the polyA+ control level differences observed for hybridization J111. PC 4
(≈ 4% of variance) uniquely identifies hybridizations
conducted on Date “G” (20031007) for which the 3’/5’ ratios for thePhe andLyspolyA+ controls are substan-tially above the Affymetrix-defined tolerance ratio of 3, which is usually indicative of either insufficient labeling efficiency or poor sample quality. For example, the hybridizations denoted as G73, G74, G75, G82 and G77 had 3’/5’ratios for the relatively high concentrationPhe polyA+ control of 30.32, 18.91, 11.10, 6.70 and 6.82, respectively.
The J111 outlier can be also identified in the high
Hotelling T2 values for the overall model (Additional
File 1: Supplemental Figure S2(b)). The loadings for PC 1 have comparable contributions from probesets (X/x, Y/y, V/v, and W/w) that represent the four polyA+ con-trols (Lys, Phe, Dap andThr) (Figure S-2(c)). This result is consistent with the obvious difference in RMA inten-sity; the log2 probe intensities for these four polyA+
controls for hybridization J111 were several orders of magnitude lower when compared to the other hybridiza-tions in the experiment. In contrast, the log2 intensities
for theTrp polyA+ control probesets (Z5, Zm and Z3)
were relatively small relative to the overall experiment (median z-score of 0.7). Consistent with the observed intensity data, these probesets have a low contribution to the loadings for the PC 1. In addition, the probeset loading pattern of 5’-middle - 3’ trend as observed for the higher concentration controls (LysandPhein Addi-tional File 1: Supplemental Figure S2(c)) indicates that the 5’probeset signals carry more of the variance of the dataset. This is likely attributable to low processivity in the in vitro transcription reaction used to synthesis the
polyA+ controls (which proceed in the 3’ to 5’
[image:9.595.57.539.627.712.2]direction).
Table 2 Comparison of polyA+ control RMA values averaged for the entire dataset in contrast with a single outlier sample (J111)
PolyA+ Control Conc. (ng/μL) log2Conc. (ng/μL) Experiment RMA valuesa, b
Sample J111 RMA valuesa
Difference
Trp 14.7 3.88 4.69 4.26 0.43
Thr 39.1 5.29 8.00 5.06 2.94
Dap 108.9 6.77 7.91 4.33 3.58
Phe 260.0 8.02 10.23 4.80 5.43
Lys 591.1 9.21 11.82 4.61 7.21
a
Averaged probeset intensities for each of the polyA+ control group
b
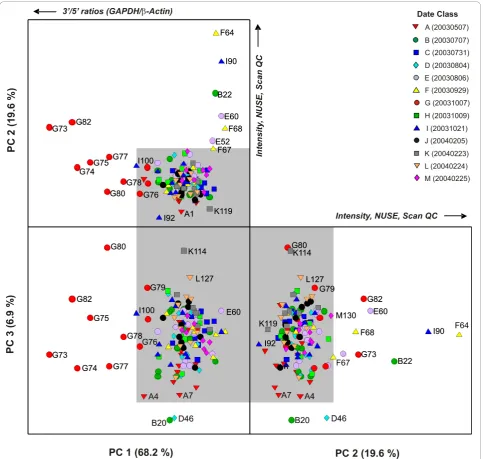
Internal RNA Degradation and Endogenous Controls
The PCA model results for the Affymetrix-designated RNA degradation internal control data (Figure 5) illus-trate a complementary pattern to the PCA results obtained for the polyA+ external spike-in control data-set but with some subtle differences. For this datadata-set, the primary contribution of the RNA degradation is rea-lized in the first component of the model (PC 1) fol-lowed by the separation of hybridizations that differ in log2 probe intensities and overall array quality in the
subsequent PCs (2 and 3). This is observed for the group of flagged hybridizations for elevated 3’/5’ ratios
for GAPDH and/orb-Actin controls (G73, G74, G82,
G75, G80, G78 and G77, and to a lesser extent G79, I100 and A4) that are separated in PC 1 and represent 68% of the model variance. Likewise, the major variables that contribute to the loadings for PC 1 correspond to
the 5’-end and middle-segments of the Affymetrix
GAPDH and b-Actin probesets (RG5, RGm, RbAct5,
RbActm; see Additional File 1: Supplemental Figure S3
(b)). Hybridizations that correspond to shifted log2
[image:10.595.60.541.85.535.2]b-Actin) but it is unclear how D46 (hybridization ID NNC2003070706Aaa) is different from the others with regards to the Affymetrix cRNA degradation internal controls. In all, the PC 1 × PC 2 × PC 3 scores profile as illustrated in Figure 5 represents≈ 95% of the total model variance.
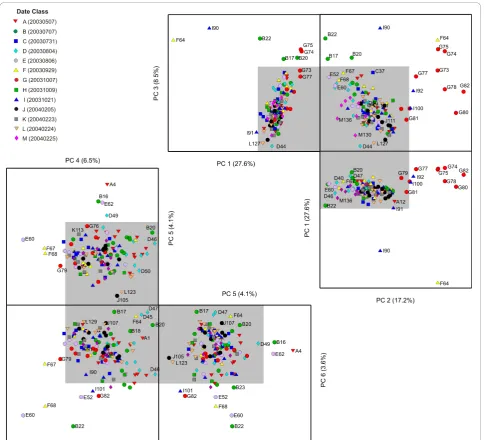
In contrast to the RNA degradation control dataset, the PC 1 × PC 2 × PC 3 scores profile for the PCA model of the endogenous control data (comprised of 100 Affyme-trix-identified“housekeeping genes”) capture only 53% of the total model variance, with the remainder dispersed
among subsequent PCs (Figure 6). The PC 1 × PC 2 × PC 3 profile does, however, have some similarities to the observed patterns for both the external polyA+ and the internal RNA degradation control PCA models. The sam-ple F64 and its I90 rehybridization are present as outliers in PC 1 as is the group of hybridizations (G73, G74, G75, G77, G78, G80, G82, I100) that have been flagged for ele-vated 3’/5’ratios in PC 2. Notably, PC 3 (8.5% variance)
contains additional samples from the Date “B” group
[image:11.595.57.541.88.547.2]respect to hybridization and/or scanning issues (F67, F68, E60) are indistinguishable in the PC 1 × PC 2 × PC 3 profile, but are apparent in the lower PC profile (PC 4 × PC 5 × PC 6 layout within Figure 6). Sample J111 is not identified as an outlier within either the internal RNA degradation or endogenous control PCA models; this hybridization is only deemed as an outlier through the polyA+ control model (Figure 4) as its only significant variance is measured via the probesets attributable to the
four polyA+ controls (Lys, Phe, Dap and Thr). This
exemplifies the utility of controls that probe data quality at multiple stages in data generation (Figure 1a).
Conclusions
[image:12.595.57.542.87.527.2]Different types of controls provide distinct levels of data quality information that can be readily resolved through principal component analysis. A layered PCA modeling of the four classes of controls (spike-in hybridization, spike-in polyA+, internal RNA degradation, endogenous or “housekeeping genes”) is valuable for evaluating data quality at a number of stages within the experiment (e.g., hybridization, RNA amplification). The variance at each stage, whether spike-in or internally present, pro-vides complementary information on data quality to those provided by the QA/QC metrics.
This work supports the use of both external and inter-nal control data to assess the technical quality of micro-array experiments. In the results presented here, using a layered PCA approach, we find that both the external and internal controls carry with them the critical infor-mation about technical performance that is consistent with whole-array quality assessment. This information is obtained for every sample generated using spike-in con-trols and permits assessment of technical performance for each array. This study is thus a key element in our efforts to develop control methods, materials and designs that support the use of genome-scale data with confidence. Furthermore, these results validate the pro-posal to use such controls with large data sets generated on multiple platforms or with other multiplexed tech-nology applications.
Additional material
[image:13.595.302.539.278.721.2]Additional file 1: contains the PCA model results include both diagnostic Q/Hotelling T2plots and loadings plots for the spike-in hybridization and polyA+ control data and the internal cRNA degradation control data subsets in Supplemental Figures S1, S2, and S3 respectively. Additionally, two supplemental tables are provided to aid in the data interpretation within the manuscript. These include Table S1 that provides condensed annotation information for the single Rat experiment and Table S2 that lists the probe set identifiers for spike-in hybridization and polyA+ controls together with the spike-internal Affymetrix cRNA degradation (RNAd) and endogenous controls for the RAE230A array.
Additional file 2: contains a copy of the Microarray Centre Quality Assessment of Affymetrix Data for EXP_CWTA_0103_01 comprising 138 hybridizations on Rat Expression Set 230A Arrays.
Hybridization HFB2003080611Aaa listed in the QA report was excluded from the PCA dataset as the full annotation information was not available at the time of this study.
Abbreviations
cRNA: copy RNA; CSC/IC: Clinical Sciences Centre/Imperial College; ERCC: External RNA Controls Consortium; MAQC: MicroArray Quality Control; MiMiR: Microarray data Mining Resource; NUSE: Normalized Unscaled Standard Error; PCA: Principal Component Analysis; polyA+: polyadenylated; QA/QC: Quality Assurance/Quality Control; RawQ: Noise attributed to both the scanner and sample quality; RMA: Robust Multichip Average; RMSEC: Root Mean Square Error of Calibration; RMSECV: Root Mean Square Error of Cross Validation; SD: Standard Deviation.
Acknowledgements
We thank Fatimah Rahman for laboratory assistance and the Microarray Centre staff for assistance with use of the MiMiR database. Disclaimer: Certain commercial equipment, instruments and materials are identified in order to specify experimental procedures as completely as possible. In no case does such identification imply a recommendation or endorsement by the National Institute of Standards and Technology, nor does it imply that any of the materials, instruments or equipment identified are necessarily the best available for that purpose.
Author details
1Chemical Science and Technology Laboratory.National Institute of Standards
and Technology (NIST) Gaithersburg, Maryland 20899 USA.2MRC Clinical
Sciences Centre (CSC) Imperial College Microarray Centre Hammersmith
Hospital Campus London W12 0NN, UK.3Department of Biological Sciences
Columbia University New York, NY 10027 USA.
Authors’contributions
HCC and LG designed and implemented the spike-in controls for use in the MiMiR experimental protocols in addition to the experimental quality control assessment metrics. HCC, LG and MLS conceived of this study’s approach to the analysis of these data and participated in the study design and coordination. DLD developed a prototype for data analysis and display. KAL created the datasets, performed the data preprocessing and chemometric analysis. All authors were involved in the data interpretation. KAL and MLS drafted the manuscript and all authors read and approved the final manuscript.
Competing interests
The authors declare that they have no competing interest.
Received: 11 August 2010 Accepted: 28 December 2010 Published: 28 December 2010
References
1. Petricoin EF, Hackett JL, Lesko LJ, Puri RK, Gutman SI, Chumakov K, Woodcock J, Feigal DW, Zoon KC, Sistare FD:Medical applications of microarray technologies: a regulatory science perspective.Nature Genetics2002,32:474-479.
2. Duewer DL, Jones WD, Reid LH, Salit M:Learning from microarray interlaboratory studies: measures of precision for gene expression.BMC Genomics2009,10:153.
3. Irizarry RA, Warren D, Spencer F, Kim IF, Biswal S, Frank BC, Gabrielson E, Garcia JGN, Geoghegan J, Germino G,et al:Multiple-laboratory comparison of microarray platforms.Nature Methods2005,2:345-349. 4. Liggett W:Normalization and technical variation in gene expression measurements.Journal of Research of the National Institute of Standards and Technology2006,111:361-372.
5. Shi LM, Reid LH, Jones WD, Shippy R, Warrington JA, Baker SC, Collins PJ, de Longueville F, Kawasaki ES, Lee KY,et al:The MicroArray Quality Control (MAQC) project shows inter- and intraplatform reproducibility of gene expression measurements.Nature Biotechnology2006, 24:1151-1161.
6. Baker SC, Bauer SR, Beyer RP, Brenton JD, Bromley B, Burrill J, Causton H, Conley MP, Elespuru R, Fero M,et al:The external RNA controls consortium: a progress report.Nature Methods2005,2:731-734. 7. Ball CA, Sherlock G, Parkinson H, Rocca-Serra P, Brooksbank C, Causton HC,
Cavalieri D, Gaasterland T, Hingamp P, Holstege F,et al:Standards for microarray data.Science2002,298:539.
8. Reid LH, Lucas AB, Kopf-Sill AR, Chen B, Bromley B, Foy C, Hinkel CS, Boysen C, Liu CM, Ranamukha-arachchi D,et al:Proposed methods for testing and selecting the ERCC external RNA controls.BMC Genomics 2005,6:150.
9. Salit ML:Standards in Gene Expression Microarray Experiments.Edited by: Kimmel A, Oliver B. Amersterdam: Elsevier; 2006:63-78.
10. Zhang W, Shumulevich I, Astola J:Microarray Quality ControlHoboken: John Wiley & Sons, Inc; 2004.
11. Kauffmann A, Rayner TF, Parkinson H, Kapushesky M, Lukk M, Brazma A, Huber W:Importing ArrayExpress datasets into R/Bioconductor. Bioinformatics2009,25:2092-2094.
12. Kauffmann A, Huber W:Microarray data quality control improves the detection of differentially expressed genes.Genomics2010, 95:138-142.
13. Brettschneider J, Collin F, Bolstad BM, Speed TP:Quality Assessment for Short Oligonucleotide Microarray Data.Technometrics2008,50:241-264. 14. Ellington AA, Kullo IJ, Bailey KR, Klee GG:Measurement and Quality
Control Issues in Multiplex Protein Assays: A Case Study.Clinical Chemistry2009,55:1092-1099.
15. Kricka LJ, Master SR:Quality Control and Protein Microarrays.Clinical Chemistry2009,55:1053-1055.
17. Fan XH, Fang H, Hong HX, Perkins R, Shi LM, Tong WD:Correlation analysis of external RNA controls reveals its utility for assessment of microarray assay.Analytical Biochemistry2009,385:203-207. 18. Holstege FCP, Jennings EG, Wyrick JJ, Lee TI, Hengartner CJ, Green MR,
Golub TR, Lander ES, Young RA:Dissecting the regulatory circuitry of a eukaryotic genome.Cell1998,95:717-728.
19. Choe SE, Boutros M, Michelson AM, Church GM, Halfon MS:Preferred analysis methods for Affymetrix GeneChips revealed by a wholly defined control dataset.Genome Biology2005,6:R16.
20. Hughes TR, Mao M, Jones AR, Burchard J, Marton MJ, Shannon KW, Lefkowitz SM, Ziman M, Schelter JM, Meyer MR,et al:Expression profiling using microarrays fabricated by an ink-jet oligonucleotide synthesizer. Nature Biotechnology2001,19:342-347.
21. McCall MN, Irizarry RA:Consolidated strategy for the analysis of microarray spike-in data.Nucleic Acids Research2008,36:e108. 22. van Bakel H, Holstege FCP:In control: systematic assessment of
microarray performance.EMBO Reports2004,5:964-969.
23. Yang IV:Use of external controls in microarray experiments.Edited by: Kimmel A, Oliver B. Amsterdam: Elsevier; 2006:50-62.
24. Yauk CL, Williams A, Boucher S, Berndt LM, Zhou G, Zheng JL, Rowan-Carroll A, Dong HY, Lambert IB, Douglas GR,et al:Novel design and controls for focused DNA microarrays: applications in quality assurance/ control and normalization for the Health Canada ToxArray (TM).BMC Genomics2006,7:266.
25. Navarange M, Game L, Fowler D, Wadekar V, Banks H, Cooley N, Rahman F, Hinshelwood J, Broderick P, Causton HC:MiMiR: a comprehensive solution for storage, annotation and exchange of microarray data.BMC Bioinformatics2005,6:268.
26. Tomlinson C, Thimma M, Alexandrakis S, Castillo T, Dennis JL, Brooks A, Bradley T, Turnbull C, Blaveri E, Barton G,et al:MiMiR - an integrated platform for microarray data sharing, mining and analysis.BMC Bioinformatics2008,9:379.
27. Bolstad BM, Irizarry RA, Astrand M, Speed TP:A comparison of normalization methods for high density oligonucleotide array data based on variance and bias.Bioinformatics2003,19:185-193. 28. Gautier L, Cope L, Bolstad BM, Irizarry RA:affy - analysis of Affymetrix
GeneChip data at the probe level.Bioinformatics2004,20:307-315. 29. Irizarry RA, Bolstad BM, Collin F, Cope LM, Hobbs B, Speed TP:Summaries
of affymetrix GeneChip probe level data.Nucleic Acids Research2003,31: e15.
30. Kauffmann A, Gentleman R, Huber W:arrayQualityMetrics-a bioconductor package for quality assessment of microarray data.Bioinformatics2009, 25:415-416.
31. Held GA, Duggar K, Stolovitzky G:Comparison of Amersham and Agilent microarray technologies through quantitative noise analysis.Omics-A Journal of Integrative Biology2006,10:532-544.
32. Holloway AJ, Oshlack A, Diyagama DS, Bowtell DDL, Smyth GK:Statistical analysis of an RNA titration series evaluates microarray precision and sensitivity on a whole-array basis.BMC Bioinformatics2006,7:511. 33. Mansourian R, Mutch DM, Aubert J, Fogel P, Le Goff JM, Moulin J, Petrov A,
Rytz A, Voegel JJ, Roberts MA:The Global Error Assessment (GEA) model for the selection of differentially expressed genes in microarray data. Bioinformatics2004,20:2726-2737.
34. Affymetrix, Inc:Expression Console™Software v. 1.0.2002.
doi:10.1186/1756-0500-3-349
Cite this article as:Lippaet al.:Exploring the use of internal and externalcontrols for assessing microarray technical performance.BMC
Research Notes20103:349. Submit your next manuscript to BioMed Central
and take full advantage of:
• Convenient online submission
• Thorough peer review
• No space constraints or color figure charges
• Immediate publication on acceptance
• Inclusion in PubMed, CAS, Scopus and Google Scholar
• Research which is freely available for redistribution