R E S E A R C H A R T I C L E
Open Access
Gene variations in oestrogen pathways,
CYP19A1
,
daily 17
β
-estradiol and mammographic density
phenotypes in premenopausal women
Vidar G Flote
1*, Anne-Sofie Furberg
2, Anne McTiernan
3, Hanne Frydenberg
1, Giske Ursin
4, Anita Iversen
5,
Trygve Lofteroed
1, Peter T Ellison
6, Erik A Wist
1, Thore Egeland
7, Tom Wilsgaard
2, Karen W Makar
3,
Jenny Chang-Claude
8and Inger Thune
1,2Abstract
Introduction:High mammographic density is an established breast cancer risk factor, and circulating oestrogen influences oestrogen-regulating gene expression in breast cancer development. However, less is known about the interrelationships of common variants in theCYP19A1gene, daily levels of oestrogens, mammographic density phenotypes and body mass index (BMI) in premenopausal women.
Methods:Based on plausible biological mechanisms related to the oestrogen pathway, we investigated the association of single nucleotide polymorphisms (SNPs) in CYP19A1, 17β-estradiol and mammographic density in 202 premenopausal women. DNA was genotyped using the Illumina Golden Gate platform. Daily salivary 17β-estradiol concentrations were measured throughout an entire menstrual cycle. Mammographic density phenotypes were assessed using a computer-assisted method (Madena). We determined associations using multivariable linear and logistic regression models.
Results: The minor alleles of rs749292 were positively (P= 0.026), and the minor alleles of rs7172156 were inversely (P= 0.002) associated with daily 17β-estradiol. We observed an 87% lower level of daily 17β-estradiol throughout a menstrual cycle in heavier women (BMI >23.6 kg/m2) of rs7172156 with minor genotype aa compared with major genotype AA. Furthermore, the rs749292 minor alleles were inversely associated with absolute mammographic density (P= 0.032). Lean women with rs749292minor alleles had 70 to 80% lower risk for high absolute mammographic density (>32.4 cm2); Aa: odds ratio (OR) = 0.23 (95% CI 0.07 to 0.75). Lean women with rs7172156 minor homozygous genotype had OR 5.45 for high absolute mammographic density (aa: OR = 5.45 (95% CI 1.13 to 26.3)).
Conclusion: Our findings suggest that two SNPs in CYP19A1, rs749292 and rs7172156, are associated with both daily oestrogen levels and mammographic density phenotypes. BMI may modify these associations, but larger studies are needed.
* Correspondence:[email protected]
1The Cancer Centre, Oslo University Hospital, Oslo N-0424, Norway
Full list of author information is available at the end of the article
Introduction
Sex hormones, in particular oestrogens, are associated with breast cancer development in both pre- and post-menopausal women [1-3], and circulating oestrogens have been shown to influence oestrogen-regulating gene ex-pression [4]. CYP19A1 is a member of the cytochrome P450 family and is involved in the bioconversion of andro-stenedione to oestrone and of testosterone to estradiol [5]. HumanCYP19A1 is a protein commonly known as aro-matase and is a gene product of CYP19A1, which is located on chromosome 15q21.2 [6]. In humans, aroma-tase is expressed in the gonads, adipose tissue and other sites, although the primary site of oestrogen production in premenopausal women is the ovaries [5]. Breast adipose tissue produces oestrogen locally, which may be increased in pre- and postmenopausal obese women [7], owing to higher levels of proinflammatory cytokines such as tumour necrosis factor, a known inducer of aromatase [8,9]. Importantly, the gene CYP19A1 is polymorphic, and the presence of single-nucleotide polymorphisms (SNPs) in the gene may alter aromatase activity, thereby causing var-iations in the levels of oestrogens [10].
Endogenous oestrogen has been shown to be both in-versely [11,12], and positively [13-15] associated with mammographic density, and both high absolute and per-cent mammographic density have consistently been associ-ated with breast cancer development [16,17]. Furthermore, mammographic density phenotypes are a strong heritable biomarker of breast cancer development, and twins studies suggest that genetic factors account for 30% to 60% of its variance [18,19]. In a recent meta-analysis including five genome-wide association studies, a variant (rs10995190) in the ZNF365 gene, which promotes genome stability during DNA damage, was associated with both breast can-cer risk and mammographic density [20]. However, this SNP explains only 0.5% of the variance of mammographic density, and many other loci may be involved in predicting mammographic density phenotypes and breast cancer de-velopment [20].
Mammographic density is also influenced by several well-known major breast cancer risk factors such as age, body mass index (BMI), parity, and hormone therapy [21]. Previ-ous studies have observed an inverse association between BMI and premenopausal breast cancer development [22,23]. In contrast, weight gain in early adult life has been associated with postmenopausal breast cancer develop-ment [24], but the association between weight gain and premenopausal breast cancer development has not yet been clarified [25]. However, premenopausal abdominal adiposity has been associated with oestrogen receptor– negative (ER−) breast cancer [26]. Studies also support excess weight being associated with higher oestrogen levels and ER+ postmenopausal breast cancer develop-ment [27,28]. In addition, we have previously shown that
salivary estradiol concentrations are positively associated with BMI throughout the menstrual cycle in premeno-pausal women [29].
Few studies have been focused on genetic susceptibility, daily levels of oestrogen and premenopausal mammo-graphic density, but plausible biological mechanisms may exist because functional genetic polymorphisms in the aro-matase gene CYP19A1 have been associated with higher estradiol levels. Therefore, the main aim of the present study was to elaborate whether hypothesis-driven selected common variants in the CYP19A1 gene are associated with daily 17β-estradiol levels and mammographic density phenotypes among healthy premenopausal women and whether BMI modifies these associations.
Methods
A total of 204 women ranging in age from 25 to 35 years participated in the Norwegian Energy Balance and Breast cancer Aspects I study (EBBA-I) from 2000 to 2002 at the Department of Clinical Research, University Hospital of North Norway, Tromsø (UNN) [30]. Women meeting the following eligibility criteria were included: self-reported regular menstruation (normal cycle length, 22 to 38 days within the previous 3 months), no ongoing use of steroid contraceptives, no pregnancy or lactation in the previous 6 months, no history of gynaecological disorders and no chronic disorders (for example, diabetes, hypo- or hyper-thyroidism). Two women were excluded because of miss-ing mammographic data, resultmiss-ing in 202 participants being included in the present study.
Participants’ characteristics, including reproductive and lifestyle factors, were collected by one trained nurse using questionnaires and interviews at the time of recruitment. Recall and memory-probing aids, including a lifetime cal-endar, were used to date specific life events. Questionnaires (filled out by the participant and interviewer, administered by trained personnel) were used to collect information about birth weight, age at menarche, marital status, educa-tion, ethnicity, reproductive history, lifetime total physical activity, previous use of hormonal contraceptives and fam-ily history of cancer, smoking and alcohol. Dietary data were collected on 7 different days during the menstrual cycle (days 3 to 6 and 21 to 23) using a previously vali-dated, precoded food diary [31]. Daily average energy and nutrient intake were computed.
Clinical parameters
square metre was calculated for all participants. Fasting blood samples were drawn at all three scheduled visits dur-ing the menstrual cycle.
Assessment of oestrogen
Serum concentrations of 17β-estradiol were measured in fresh sera for all three collection points using a direct immuno-metric assay (Immuno-1; Bayer Diagnostics, Norway) at the Department of Clinical Chemistry, UNN [30]. The sensitivity was 0.01 nmol/L, and the coefficient of vari-ation (CV) was 3.9%.
To assess the bioavailable fraction of 17β-estradiol, the participants collected daily saliva samples during one menstrual cycle, preferably in the morning, starting on the first day of menstrual bleeding according to previously established and validated collection protocols developed at the Reproductive Ecology Laboratory of Harvard University [32] and according to the manufacturer’s protocol [30]. The samples were stored at−70°C. All sam-ples were run in duplicate, and samsam-ples from the same cycles were run within the same assay. The assays were done in different batches at Harvard University. 17β -estradiol concentrations were measured in daily saliva sam-ples using a 125I-based radioimmunoassay kit (no. 39100; Diagnostic Systems Laboratory, Webster, TX, USA). All cycles were aligned to the day of ovulation, based on the identification of the 17β-estradiol drop, which provides a reasonable estimate of the day of ovulation [33,34]. The midcycle 17β-estradiol drop could not be made for 14 of the included women, and their cycles were not aligned. Overall mean salivary 17β-estradiol concentration was cal-culated for all participants, whereas an additional index of mean menstrual estradiol on days−7 to +6 was calculated for the 188 women with aligned cycles. The sensitivity of the 17β-estradiol salivary assay was 4 pmol/L, and the average intra-assay CV was 9%. The measurements of 17β-estradiol had a higher CV at the start and end of the menstrual cycle, and the interassay CV ranged from 23% (low pool) to 13% (high pool). Furthermore, there were higher rates of missing data at the end of the cycle, so we included aligned measurements of salivary 17β-estradiol from day−7 to day +6 in this study.
Assessment of mammographic density
Bilateral two-view mammograms were obtained from women during the second scheduled visit (between cycle days 7 and 12) at the Centre of Breast Imaging, UNN, using a standard protocol [30]. The left craniocaudal mam-mograms were digitised and imported into a computerised mammographic density assessment programme (Madena) developed at the University of Southern California School of Medicine (Los Angeles, CA, USA) [35,36]. The density measurements were conducted by one trained reader (GU), and the total breast area was determined by a
research assistant trained by GU. The total breast area was defined using a special outlining tool, and the size of this area in square centimetres using the Madena soft-ware. To assess density, the reader outlined a region of interest (ROI), excluding the pectoralis muscle, prominent veins and fibrous strands. The reader applied a tinting tool to pixels considered to represent dense areas of the mam-mograms within the ROI. The Madena software calcu-lated the size of this dense area in square centimetres. Absolute mammographic breast density represented this dense area, and the percentage mammographic density was the ratio of absolute mammographic breast density to total breast area multiplied by 100. The mammograms were read in four batches, with an equal number of mam-mograms included in each batch. A duplicate reading of 26 randomly selected mammograms from two of the batches showed a Pearson’s correlation coefficient of 0.97. The reader was blinded to any characteristics of the study population.
Single-nucleotide polymorphism selection and genotyping
We analysed CYP19A1 genetic polymorphisms that en-code the aromatase enzyme. Blood samples from 204 women in the EBBA-I study were frozen at −70°C. DNA was extracted from whole blood using a MagAttract DNA Blood Mini M48 kit (QIAGEN, Valencia, CA, USA) by the Department of Medical Genetics, UNN. DNA was geno-typed on the Golden Gate Platform (Illumina, San Diego, CA, USA) at the Fred Hutchinson Cancer Research Center (Makar Lab), using the manufacturer’s protocol. In brief, 250 ng of genomic DNA was divided into aliquots in 96-well plates, processed accordingly and scanned on the Illumina iScan reader using BeadStudio software.
We conducted a series of quality control procedures [37]. SNP call rates exceeded 99% for this study, with 100% con-cordance of blinded duplicates. The linkage disequilibrium select algorithm was employed to choose the tag SNPs via the Genome Variation Server [38,39]. The SNPs were selected using an r2 threshold of 0.8 and a minor al-lele frequency >5%, representing variability in the white European population. Tag SNP coverage extended 2 kilo-bases (kb) upstream and 1 kb downstream of the gene, and 29 SNPs were covered. We further reduced the number of SNPs using power calculations and ended up with a final selection of eight common SNPs with minor allele fre-quency >0.2: rs10046, rs17703883, rs2414097, rs2445761,
rs4646,rs7172156,rs727479andrs749292(see Additional file 1). None of the selected SNPs was monomorphic or significantly out of Hardy–Weinberg equilibrium.
Covariate analytes
quantified by direct assay using enzymes modified by poly-ethylene glycol and dextran sulphate.
Statistical methods
On the basis of the plausible biological mechanisms re-lated to the oestrogen pathway, we investigated the asso-ciations between eight SNPs in the CYP19A1 gene, hormone levels (salivary midmenstrual 17β-estradiol and serum 17β-estradiol) and mammographic density pheno-types (total breast area, absolute mammographic density, percent mammographic density and nondense breast area) using multivariable linear regression models. Asso-ciations were assessed for the selected SNPs, and the se-lected SNPs were coded asAA= 0 (major homozygous),
Aa= 1 (heterozygous) and aa= 2 (minor homozygous) and were included as ordinal variables in the models. We compared the linear response between the categor-ies of genotypes by including indicator variables for Aa andaa, usingAAas the reference.
Age, parity and BMI are known to be associated with mammographic density phenotypes, are possibly associ-ated with hormone levels and/or CYP19A1 variants, and were therefore considered as potential confounders and included as covariates in all models [21]. Furthermore, the models with mammographic density as the dependent variable also included salivary 17β-estradiol and serum HDL-C, both of which are known to influence mammo-graphic density [40,13]. In the final analyses, we focused on two selected SNPs (rs7172156 and rs749292) and stratified the women by major, heterozygous and minor genotypes. We then compared the genotype groups using different characteristics of the study population (lifestyle factors, anthropometric measures, serum blood sampling and salivary hormone sampling), and we used one-way analysis of variance for continuous variables and the χ2 test for categorical variables.
The multivariable logistic regression models were run using median absolute mammographic density (32.4 cm2) and median percent mammographic density (28.5%) as cutoff values. Mammographic density was used as a dependent variable, and rs7172156 and rs749292 were used as independent variables, adjusted for age, parity and BMI. In addition, we analysed in detail whether BMI vari-ations influenced our results (that is, tertiles/dichotomised BMI), but only dichotomised BMI by median BMI values gave additional information and thus were included in the final analysis.
We used linear mixed models for repeated measures to study variations of daily salivary 17β-estradiol across the menstrual cycle for subgroups of women with major, minor homozygous or heterozygous genotypes in the SNPsrs7172156andrs749292, and we then adjusted for age, BMI and parity. The Toeplitz covariance structure gave the best fit to the data and was used in all models.
Our candidate polymorphisms were based on plausible biological hypotheses, and all P-values were two-tailed and considered significant when the value was <0.05. The analyses were conducted with SPSS version 21.0 software (IBM, Armonk, NY, USA).
Ethical considerations
All participants underwent informed consent procedures and signed a consent form. The study was approved by the Norwegian Data Inspectorate and the Regional Committee for Medical Research Ethics.
Results
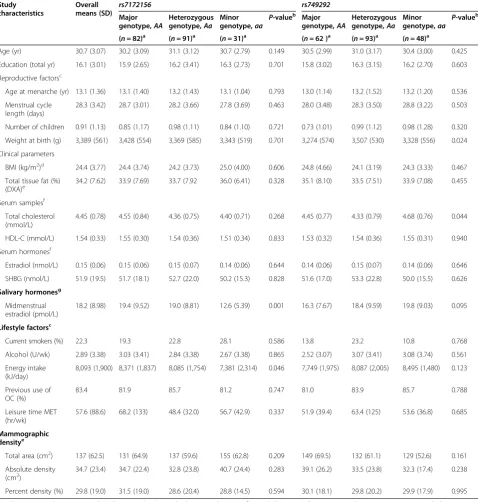
The participating premenopausal women had mean values (standard deviation (SD)) for age of 30.7 (3.07) years and BMI of 24.4 (3.77) kg/m2 (Table 1). When we stratified the women into groups for rs749292 and rs7172156 by major homozygous, heterozygous and minor homozygous genotypes, we observed no differences in lifestyle factors, anthropometric measures or serum analytes (Table 1).
We observed an association between two SNPs (rs749292,
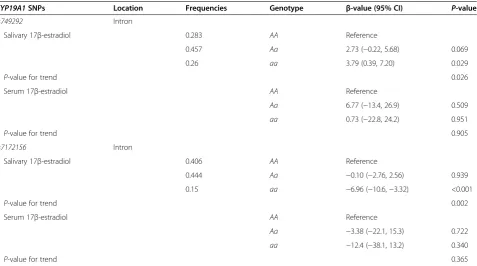
rs7172156) and both salivary estradiol and absolute mam-mographic density. Moreover, a positive association was observed between rs749292 and midmenstrual salivary 17β-estradiol (P= 0.026), and an inverse association be-tweenrs7172156and midmenstrual salivary 17β-estradiol (P= 0.002), after adjustment for age, BMI and parity (Table 2). We also observed a negative association be-tween rs749292 and absolute mammographic density (P= 0.032) after adjusting for age, BMI, parity, salivary midmenstrual 17β-estradiol and serum HDL-C.
rs749292, rs7172156and oestrogen levels
The associations between rs749292 and rs7172156 with 17β-estradiol were studied further with multivariable lin-ear regression analyses. Forrs749292, we observed a posi-tive association between the minor homozygous genotype (aa) and salivary 17β-estradiol (β= 3.79, P= 0.03). For
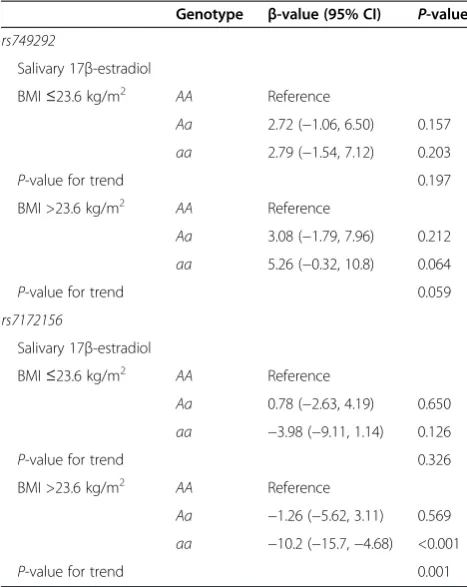
rs7172156, we observed an inverse association between the minor homozygous genotype and salivary 17β-estradiol (β=−6.96, P< 0.001) (Table 2). We then dichotomized participants by median split of BMI (23.6 kg/m2). For
rs7172156, the minor homozygous genotype (aa) was in-versely associated with 17β-estradiol levels (aa: β=−10.2,
P< 0.001) in women with a high BMI (>23.6 kg/m2) (Table 3).
compared with women with genotype aa, 57% and 56% higher mean 17β-estradiol levels were observed, respect-ively (Figure 1d). This association was even more marked when we dichotomised the data by median split of BMI (23.6 kg/m2). We observed an 87% lower level of mean
17β-estradiol throughout a menstrual cycle in heavier women (BMI >23.6 kg/m2) with minor genotype aa of
[image:5.595.59.538.113.616.2]rs7172156 compared with those with major genotypeAA (Figure 1f). Among women with genotype AA, heavier women had a 33% higher level of 17β-estradiol compared
Table 1 Characteristics of the Norwegian EBBA-I study population overall and byCYP19A1single-nucleotide polymorphismsrs7172156andrs749292
Study characteristics
Overall
means (SD) rs7172156 rs749292
Major genotype,AA
Heterozygous genotype,Aa
Minor genotype,aa
P-valueb Major
genotype,AA
Heterozygous genotype,Aa
Minor genotype,aa
P-valueb
(n= 82)a (n= 91)a (n= 31)a (n= 62 )a (n= 93)a (n= 48)a
Age (yr) 30.7 (3.07) 30.2 (3.09) 31.1 (3.12) 30.7 (2.79) 0.149 30.5 (2.99) 31.0 (3.17) 30.4 (3.00) 0.425
Education (total yr) 16.1 (3.01) 15.9 (2.65) 16.2 (3.41) 16.3 (2.73) 0.701 15.8 (3.02) 16.3 (3.15) 16.2 (2.70) 0.603
Reproductive factorsc
Age at menarche (yr) 13.1 (1.36) 13.1 (1.40) 13.2 (1.43) 13.1 (1.04) 0.793 13.0 (1.14) 13.2 (1.52) 13.2 (1.20) 0.536
Menstrual cycle length (days)
28.3 (3.42) 28.7 (3.01) 28.2 (3.66) 27.8 (3.69) 0.463 28.0 (3.48) 28.3 (3.50) 28.8 (3.22) 0.503
Number of children 0.91 (1.13) 0.85 (1.17) 0.98 (1.11) 0.84 (1.10) 0.721 0.73 (1.01) 0.99 (1.12) 0.98 (1.28) 0.320
Weight at birth (g) 3,389 (561) 3,428 (554) 3,369 (585) 3,343 (519) 0.701 3,274 (574) 3,507 (530) 3,328 (556) 0.024
Clinical parameters
BMI (kg/m2)d 24.4 (3.77) 24.4 (3.74) 24.2 (3.73) 25.0 (4.00) 0.606 24.8 (4.66) 24.1 (3.19) 24.3 (3.33) 0.467
Total tissue fat (%) (DXA)e
34.2 (7.62) 33.9 (7.69) 33.7 (7.92 36.0 (6.41) 0.328 35.1 (8.10) 33.5 (7.51) 33.9 (7.08) 0.455
Serum samplesf
Total cholesterol (mmol/L)
4.45 (0.78) 4.55 (0.84) 4.36 (0.75) 4.40 (0.71) 0.268 4.45 (0.77) 4.33 (0.79) 4.68 (0.76) 0.044
HDL-C (mmol/L) 1.54 (0.33) 1.55 (0.30) 1.54 (0.36) 1.51 (0.34) 0.833 1.53 (0.32) 1.54 (0.36) 1.55 (0.31) 0.940
Serum hormonesf
Estradiol (nmol/L) 0.15 (0.06) 0.15 (0.06) 0.15 (0.07) 0.14 (0.06) 0.644 0.14 (0.06) 0.15 (0.07) 0.14 (0.06) 0.646
SHBG (nmol/L) 51.9 (19.5) 51.7 (18.1) 52.7 (22.0) 50.2 (15.3) 0.828 51.6 (17.0) 53.3 (22.8) 50.0 (15.5) 0.626
Salivary hormonesg Midmenstrual estradiol (pmol/L)
18.2 (8.98) 19.4 (9.52) 19.0 (8.81) 12.6 (5.39) 0.001 16.3 (7.67) 18.4 (9.59) 19.8 (9.03) 0.095
Lifestyle factorsc
Current smokers (%) 22.3 19.3 22.8 28.1 0.586 13.8 23.2 10.8 0.768
Alcohol (U/wk) 2.89 (3.38) 3.03 (3.41) 2.84 (3.38) 2.67 (3.38) 0.865 2.52 (3.07) 3.07 (3.41) 3.08 (3.74) 0.561
Energy intake (kJ/day)
8,093 (1,900) 8,371 (1,837) 8,085 (1,754) 7,381 (2,314) 0.046 7,749 (1,975) 8,087 (2,005) 8,495 (1,480) 0.123
Previous use of OC (%)
83.4 81.9 85.7 81.2 0.747 81.0 83.9 85.7 0.788
Leisure time MET (hr/wk)
57.6 (88.6) 68.2 (133) 48.4 (32.0) 56.7 (42.9) 0.337 51.9 (39.4) 63.4 (125) 53.6 (36.8) 0.685
Mammographic densitye
Total area (cm2) 137 (62.5) 131 (64.9) 137 (59.6) 155 (62.8) 0.209 149 (69.5) 132 (61.1) 129 (52.6) 0.161
Absolute density (cm2)
34.7 (23.4) 34.7 (22.4) 32.8 (23.8) 40.7 (24.4) 0.283 39.1 (26.2) 33.5 (23.8) 32.3 (17.4) 0.238
Percent density (%) 29.8 (19.0) 31.5 (19.0) 28.6 (20.4) 28.8 (14.5) 0.594 30.1 (18.1) 29.8 (20.2) 29.9 (17.9) 0.995
Numbers in parentheses are standard deviations (SDs). BMI, body mass index; E2, 17β-estradiol; DXA, Dual-energy X-ray absorptiometry; HDL-C, High-density lipoprotein-cholesterol; LDL-C, Low-density lipoprotein-cholesterol; MET, Metabolic equivalent; OC, Oral contraceptives; SHBG, Sex hormone-binding globulin. a
Numbers may vary due to missing information.b
OneWay ANOVA orχ2
test, significance levelP< 0.05.c
Questionnaires.d
Measurements at days 1 to 5 after onset of menstrual cycle.e
Measurements at days 7 to 12 after onset of menstrual cycle.f
to leaner women. However, in genotypeaa, there was no increase in 17β-estradiol levels when we compared leaner and heavier women. When comparing mean 17β-estradiol levels in lean women (BMI ≤23.6 kg/m2) with rs749292 major genotypeAAwith heavier women (BMI >23.6 kg/m2) with rs749292 minor genotype aa, a 52% higher mean 17β-estradiol level was observed (Figure 1).
rs749292andrs7172156and mammographic density phenotypes
The association between the SNPs and mammographic density phenotypes was studied with multivariable linear regression models. Forrs749292, we observed an inverse association between minor alleles (Aa, aa) and absolute mammographic density (Table 4). We observed a posi-tive association between rs7172156 minor genotype aa and absolute mammographic density.
After dichotomising by median split of BMI, we found thatrs749292minor alleles were inversely associated with absolute mammographic density (Aa:β=−13.0,P= 0.006;
aa:β=−14.1,P= 0.010) in lean women (≤23.6 kg/m2), but not in women with a BMI >23.6 kg/m2. Among lean women (≤23.6 kg/m2) with rs7172156 genotype aa, we observed a positive association with absolute mammo-graphic density (aa:β= 18.2,P= 0.005) (Table 4).
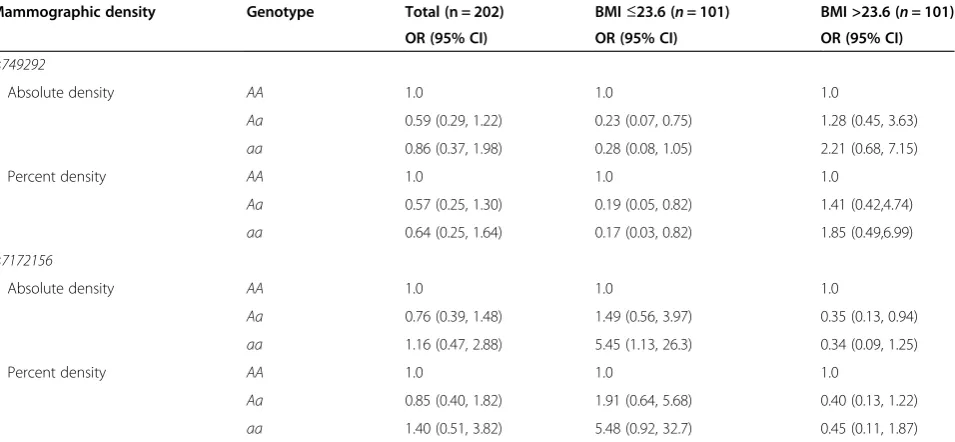
In the multivariable logistic regression models, lean women (BMI ≤23.6 kg/m2) who had rs749292 minor
alleles (Aa, aa) had an 80% lower risk for high percent mammographic density (above median: >28.5%) (Aa: OR = 0.19 (95% CI, 0.05 to 0.82);aa: OR = 0.17 (95% CI 0.03 to 0.82)). The results were similar but attenuated for absolute mammographic density (Table 5).
Forrs7172156, lean women with a minor homozygous genotype had a 5.45 higher OR for high absolute mammo-graphic density (aa: OR = 5.45 (95% CI, 1.13 to 26.3)). Similar associations were observed forrs7172156and per-cent mammographic density (Table 5).
Discussion
In the present study of premenopausal women, two SNPs (rs749292, rs7172156) of eight studied in the CYP19A1 gene were related to both daily salivary 17β-estradiol and mammographic density phenotypes. The association with mammographic density was revealed when we used saliv-ary 17β-estradiol as a covariate, and similar results were observed for absolute and percent mammographic dens-ity. Furthermore, our results suggest that body weight may modify these associations. We observed an 87% lower level of daily 17β-estradiol throughout a menstrual cycle in heavier women (BMI >23.6 kg/m2) with minor genotype
[image:6.595.61.539.99.365.2]aa (17β-estradiol 12.3 pmol/L) of rs7172156 compared with major genotypeAA(17β-estradiol 22.4 pmol/L). Fur-thermore, lean women withrs7172156minor homozygous genotype aa had a fivefold higher OR for high absolute
Table 2 Associations between twoCYP19A1single-nucleotide polymorphisms (rs749292,rs7172156) and 17β-estradiol
CYP19A1SNPs Location Frequencies Genotype β-value (95% CI) P-value
rs749292 Intron
Salivary 17β-estradiol 0.283 AA Reference
0.457 Aa 2.73 (−0.22, 5.68) 0.069
0.26 aa 3.79 (0.39, 7.20) 0.029
P-value for trend 0.026
Serum 17β-estradiol AA Reference
Aa 6.77 (−13.4, 26.9) 0.509
aa 0.73 (−22.8, 24.2) 0.951
P-value for trend 0.905
rs7172156 Intron
Salivary 17β-estradiol 0.406 AA Reference
0.444 Aa −0.10 (−2.76, 2.56) 0.939
0.15 aa −6.96 (−10.6,−3.32) <0.001
P-value for trend 0.002
Serum 17β-estradiol AA Reference
Aa −3.38 (−22.1, 15.3) 0.722
aa −12.4 (−38.1, 13.2) 0.340
P-value for trend 0.365
mammographic density compared with major homozygous genotype AA. Lean women who had rs749292 minor al-leles had 70% to 80% lower risk for high absolute and high percent mammographic density compared with major homozygous genotypeAA.
The CYP19 activity is responsible for the bioconver-sion of androgens to oestrogens [5,6], and to our know-ledge, there have been few studies related to CYP19A1 SNPs, daily levels of oestrogen throughout an entire menstrual cycle and mammographic density phenotypes in premenopausal women. It is not clear why and how noncoding SNPs influence the gene activity, but previous genome-wide association studies have shown intronic SNPs to be important breast cancer risk loci [41]. This does not necessarily imply that the SNPs are causal, but it may help to identify novel susceptibility loci. In addition, intronic SNPs may regulate gene expression through en-dogenous trans-acting factors, epigenetics and chromo-some conformation [42]. Our results are in part supported by a previous report [10] thatrs749292minor alleles were associated with a 10% to 20% increase in oestrogen levels among postmenopausal women in a combined analysis of five cohort studies. Other SNPs in theCYP19A1gene have
also been studied, and in one study on postmenopausal women with a mean age of 57 years and a mean BMI of 24.2 kg/m2, researchers found an association with circulat-ing oestrogen levels, but only among women with BMI >25 kg/m2[43]. Interestingly, functional genetic polymor-phisms may also influence the level of estradiol in women undergoing inhibitory treatment, as two CYP19A1 SNPs were associated with higher estradiol levels, particularly after initiation of aromatase inhibitors [44]. These findings imply that CYP19A1SNPs may be of clinical interest, as aromatase inhibitor treatment has been shown to be one of the most effective modern antihormonal breast cancer treatment regimens. To our knowledge, no clear associa-tions have been observed between CYP19A1 SNPs and mammographic density [45], and researchers in one study found no associations of oestrogen synthesis or oestrogen metabolism genes with mammographic density in a mixed population of perimenopausal, young postmenopausal and postmenopausal women [45]. Few known genetic variants predict both mammographic density and breast cancer risk, but Lindstrom et al. found an association between common variants in the ZNF365 gene, which promotes genome stability under DNA damage, with both mammo-graphic density and breast cancer development [20]. In addition, SNPs in the inflammatory gene interleukin-6 (IL-6) have recently been associated with premenopausal percent mammographic density [46]. Despite the clear association of endogenous oestrogens with breast cancer development [1], results have been inconsistent regarding associations betweenCYP19A1variants and risk for breast cancer [10,47-49], butrs1008805[50] and, recently,rs10046 were observed to be associated with breast cancer suscepti-bility among premenopausal women [51].
[image:7.595.56.290.122.416.2]Elevated BMI has been related to higher levels of sex hor-mones in both premenopausal [30] and postmenopausal women [52], and weight loss through diet and exercise may reduce sex steroid hormone levels in premenopausal [53] and postmenopausal women [54]. We previously observed that CYP17 polymorphisms were associated with 17β -estradiol levels, especially in women with unfavourable metabolic profiles [55]. Interestingly, in the present study, an inverse association was observed between rs749292 minor alleles and absolute mammographic density among lean women, but this association disappeared in heav-ier women. Furthermore, rs7172156 minor alleles were associated with higher absolute mammographic density among lean women. In contrast, we found that among women with minor alleles and high BMI,rs7172156 may be a protective polymorphism associated with lower 17β-estradiol and lower OR for having above-median per-cent mammographic density (>28.5%) and absolute mam-mographic density (>32.4 cm2). Similar mammographic threshold estimates of 25% mammographic density and 32-cm2absolute mammographic density have been shown
Table 3 Associations between theCYP19A1single-nucleotide polymorphisms (rs749292,rs7172156) and 17β-estradiol by median body mass index (23.6 kg/m2)
Genotype β-value (95% CI) P-value
rs749292
Salivary 17β-estradiol
BMI≤23.6 kg/m2 AA Reference
Aa 2.72 (−1.06, 6.50) 0.157
aa 2.79 (−1.54, 7.12) 0.203
P-value for trend 0.197
BMI >23.6 kg/m2 AA Reference
Aa 3.08 (−1.79, 7.96) 0.212
aa 5.26 (−0.32, 10.8) 0.064
P-value for trend 0.059
rs7172156
Salivary 17β-estradiol
BMI≤23.6 kg/m2 AA Reference
Aa 0.78 (−2.63, 4.19) 0.650
aa −3.98 (−9.11, 1.14) 0.126
P-value for trend 0.326
BMI >23.6 kg/m2 AA Reference
Aa −1.26 (−5.62, 3.11) 0.569
aa −10.2 (−15.7,−4.68) <0.001
P-value for trend 0.001
to predict a two- to threefold risk of breast cancer develop-ment within 5 to 10 years [56,57].
Interestingly, a previous study observed an association betweenrs7172156,rs749292[58] and serum levels of hep-atocyte growth factor (HGF). HGF is a cytokine derived from adipose tissue [58] that promotes cell migration, pro-liferation and invasion, and previous studies have found associations between HGF levels and development from benign breast disorders to preinvasive, basal-like breast cancer [59], as well as further correlations with poor prog-nosis. These findings lead us to hypothesize that there may be a biological rational for the associations we observed for two SNPs inCYP19A1:rs7172156andrs749292.
Our study has several strengths. These are inclusion of premenopausal women; clinical measurements carefully timed to the menstrual cycle, including mammographic
[image:8.595.57.540.88.439.2]density phenotypes and serum and daily saliva 17β -estradiol; and a validated computer-assisted method for quantifying mammographic density. In contrast, we did not observe the same associations between these two SNPs inCYP19A1and serum 17β-estradiol as we did for salivary 17β-estradiol. Importantly, salivary 17β-estradiol was assessed daily, is the free bioavailable fraction and is not bound to albumin or sex hormone-binding globulin, in contrast to the serum 17β-estradiol levels, and may in part explain the variations observed [30,33]. Previous re-search has indicated that single measurements of serum oestrogen do not accurately reflect women’s long-term oestrogen levels [3], whereas multiple measurements of unbound bioavailable levels probably give a picture of the real endogenous cumulative exposure over time. This means that single measurements are likely to be an
Figure 1Mean salivary 17β-estradiol levels across menstrual cycles forrs749292andrs7172156, adjusted for age, body mass index and parity. (a)rs749292mean estradiol levels: minor homozygous genotype (aa) (n= 46), 19.8 pmol/L; heterozygous genotype (Aa) (n= 86), 18.7 pmol/L; and major homozygous genotype (AA) (n= 57), 16.0 pmol/L (P= 0.075).(b)rs749292and low body mass index (BMI≤23.6 kg/m2):
aa(n= 25), 17.5 pmol/L;Aa(n= 46), 17.4 pmol/L; andAA(n= 25), 14.7 pmol/L (P= 0.294).(c)rs749292and high BMI >23.6 kg/m2:aa(n= 21),
22.3 pmol/L;Aa(n= 40), 19.9 pmol/L; andAA(n= 30), 17.6 pmol/L (P= 0.265).(d)rs7172156mean estradiol levels:aa(n= 29), 12.3 pmol/L;Aa (n= 83), 19.2 pmol/L; andAA(n= 78), 19.3 pmol/L (P= 0.001).(e)rs7172156and low BMI≤23.6 kg/m2:aa(n= 12), 12.9 pmol/L;Aa(n= 41), 17.5
pmol/L; andAA(n= 45), 16.9 pmol/L (P= 0.208).(f)rs7172156and high BMI >23.6 kg/m2:aa(n= 17), 12.0 pmol/L;Aa(n= 42), 20.9 pmol/L; and
Table 4 Association betweenCYP19A1single-nucleotide polymorphisms (rs749292andrs7172156) and mammographic density phenotypes, overall and stratified by median body mass index (23.6 kg/m2)
Mammographic density
Total BMI≤23.6 BMI >23.6
Genotype β-value (95% CI) P-value β-value (95% CI) P-value β-value (95% CI) P-value
(n= 202) (n= 101) (n= 101)
rs749292
Absolute density AA Reference Reference Reference
Aa −7.78 (−15.5,−0.12) 0.047 −13.0 (−22.2,−3.82) 0.006 1.91 (−9.86, 13.7) 0.748
aa −9.47 (−18.3,−0.61) 0.036 −14.1 (−24.8,−3.44) 0.010 −1.36 (−14.9, 12.2) 0.842
P-value for trend 0.032 0.015 0.587
Percent density AA Reference Reference Reference
Aa −2.64 (−7.68, 2.39) 0.301 −3.01 (−10.0, 4.01) 0.396 2.44 (−3.93, 8.82) 0.449
aa −2.68 (−8.50, 3.14) 0.364 −2.33 (−10.5, 5.81) 0.571 0.42 (−6.92, 7.76) 0.910
P-value for trend 0.348 0.537 0.866
rs7172156
Absolute density AA Reference Reference Reference
Aa 0.27 (−6.70, 7.24) 0.939 3.94 (−4.63, 12.5) 0.363 −4.87 (−15.9, 6.15) 0.768
aa 11.6 (1.43, 21.8) 0.026 18.2 (5.67, 30.8) 0.005 −2.15 (−16.6, 12.3) 0.382
P-value for trend 0.074 0.011 0.978
Percent density AA Reference Reference Reference
Aa −1.52 (−6.09, 3.05) 0.512 1.15 (−5.38, 7.67) 0.728 −4.98 (−10.9, 0.93) 0.097
aa 2.23 (−4.45, 8.91) 0.512 2.01 (−7.57, 11.6) 0.678 −2.26 (−9.99, 5.47) 0.563
P-value for trend 0.792 0.573 0.847
Multivariable linear regression model adjusted for age, parity, body mass index (BMI), 17-β-estradiol and high-density lipoprotein cholesterol.β: Estimated slope coefficient (for example, change in response) from reference (AA) toAaandaa. Mammograms were taken within late follicular phase from days 7 to 12.
Table 5 Adjusted odds ratios for above-median absolute mammographic density (>32.4 cm2) and above-median percent mammographic density (>28.5%) byCYP19A1single-nucleotide polymorphism and stratified by median body mass index (23.6 kg/m2)
Mammographic density Genotype Total (n = 202) BMI≤23.6 (n= 101) BMI >23.6 (n= 101) OR (95% CI) OR (95% CI) OR (95% CI)
rs749292
Absolute density AA 1.0 1.0 1.0
Aa 0.59 (0.29, 1.22) 0.23 (0.07, 0.75) 1.28 (0.45, 3.63)
aa 0.86 (0.37, 1.98) 0.28 (0.08, 1.05) 2.21 (0.68, 7.15)
Percent density AA 1.0 1.0 1.0
Aa 0.57 (0.25, 1.30) 0.19 (0.05, 0.82) 1.41 (0.42,4.74)
aa 0.64 (0.25, 1.64) 0.17 (0.03, 0.82) 1.85 (0.49,6.99)
rs7172156
Absolute density AA 1.0 1.0 1.0
Aa 0.76 (0.39, 1.48) 1.49 (0.56, 3.97) 0.35 (0.13, 0.94)
aa 1.16 (0.47, 2.88) 5.45 (1.13, 26.3) 0.34 (0.09, 1.25)
Percent density AA 1.0 1.0 1.0
Aa 0.85 (0.40, 1.82) 1.91 (0.64, 5.68) 0.40 (0.13, 1.22)
aa 1.40 (0.51, 3.82) 5.48 (0.92, 32.7) 0.45 (0.11, 1.87)
Multivariable logistic regression adjusted for age, body mass index (BMI) and parity and stratified by median BMI (23.6 g/m2
[image:9.595.61.539.485.706.2]underestimate because they do not capture the premen-opausal cyclical changes and will be imperfect estimates of the true pattern [3,60]. Thus, use of exploratory, non-invasive, repeated sampling of salivary hormones may provide new knowledge on the true association between hormones and breast cancer. Moreover, this may in part explain why circulating oestrogen levels consistently have been observed to increase risk, as well as risk pre-diction for invasive postmenopausal breast cancer [61], but the association between endogenous oestrogen levels and breast cancer among premenopausal women is less clear [3]. Today, liquid chromatography-tandem mass spectrometry, as compared to the immunoassay method, is a more efficient way of analysing salivary hormones with higher specificity and sensitivity. However, previous stud-ies on estradiol measurements, specifically, have shown a correlation of 0.969 between mass spectrometry and im-munoassays [62]. However, our sample size was small, and associations could have been missed by chance. Further-more, the population was a sample of volunteer partici-pants and therefore may not be representative of the source population, but their average BMI and other lifestyle-related factors and lipid profiles are in accordance with the population of premenopausal Norwegian women [63]. A limited number of SNPs were examined, based on the biological hypothesis that polymorphisms in the
CYP19gene may influence 17β-estradiol levels and mam-mographic phenotypes. Even though only eight SNPs were examined, there is a risk of false-positive results. Never-theless, our findings are intriguing and support future re-search in larger sample sizes.
Conclusion
In the present study, we found associations between two
CYP19A1SNPs (rs7172156andrs749292) and both daily 17β-estradiol throughout an entire menstrual cycle and both absolute and percent mammographic density in premenopausal women, and the results differed between lean and heavier women. This observation suggests that there may be genetic influences on these breast cancer biomarkers and also that the effect of body size may play a major role. Future research on genetic control of mammo-graphic density phenotypes and sex hormones should in-clude exploratory salivary hormone measurements and take body size and adiposity into account.
Additional file
Additional file 1:Four supplementary tables. Table S1.Allele frequencies and distributions of selected single-nucleotide polymorphisms (SNPs) inCYP19A1: The Norwegian EBBA-I study.Table S2.Population frequencies of single-nucleotide polymorphisms (SNPs) in selected single-nucleotide polymorphisms inCYP19A1.Table S3.Associations between each of eight selected single-nucleotide polymorphisms (SNPs) in theCYP19A1region and mammographic density (total
breast area, absolute density, percent density and nondense breast areas). Table S4.Associations between each of eight selected single-nucleotide polymorphisms (SNPs) in theCYP19A1region and estradiol.
Abbreviations
BMI:Body mass index; CI: Confidence interval; CV: Coefficient of variation; EBBA-I: Norwegian Energy Balance and Breast cancer Aspects I study; ER: Oestrogen receptor; HGF: Hepatocyte growth factor; kb: Kilobase; HDL-C: High-density lipoprotein cholesterol; OR: Odds ratio; LDL-C: Low-density lipoprotein cholesterol; ROI: Region of interest; SNP: Single nucleotide polymorphism; UNN: University Hospital of North Norway, Tromsø.
Competing interests
The authors declare that they have no competing interests.
Authors’contributions
IT and ASF conceived of and designed the study and collected the clinical data. PTE carried out the radioimmunoassay and measured salivary hormone levels. GU digitized and measured the mammographic density data. KWM and AM performed the single-nucleotide polymorphism analysis. VGF, HF, TL, TE, TW, AI, EAW and JCC performed statistical analyses. VGF, ASF, AM, HF, GU, AI, TL, PTE, EAW, TE, TW, KWM, JCC and IT interpreted the results. VGF drafted the manuscript in cooperation with IT. All authors contributed to critical revision of the manuscript, editing of the final version of the manuscript and agree to be accountable for the accuracy and integrity of the work. All authors read and approved the final manuscript.
Acknowledgements
We acknowledge each woman who participated in the EBBA-I study and give special thanks to Gunn Kristin Knudsen, Heidi Jakobsen, Anna-Kirsti Kvitnes and Sissel Andersen for professional assistance, and to the Clinical Research Department, University Hospital of North Norway, for providing the skilled and always professional setting. Funding for this study was provided by the Norwegian Foundation for Health and Rehabilitation grants 59010-2000/2001/2002 Norwegian Cancer Society grants 05087 and TP 49 258, Aakre Foundation grants 5695-2000 and 5754-2002 and South-East Norwegian Health Authority grant 2012064.
Author details
1The Cancer Centre, Oslo University Hospital, Oslo N-0424, Norway. 2
Department of Community Medicine, Faculty of Health Sciences, UiT, The Arctic University of Norway, Tromsø N-9037, Norway.3Fred Hutchinson Cancer Research Center, Public Health Sciences Division, Seattle, WA 98109-1024, USA.4Cancer Registry of Norway, PO Box 5313Majorstuen, Oslo N-0304, Norway.5Faculty of Health Sciences, UiT, The Arctic University of Norway, Tromsø N-9037, Norway.6Department of Anthropology, Harvard University, Cambridge, MA 02138, USA.7Department of Chemistry, Norwegian University of Life Sciences, Biotechnology and Food Science, Aas N-1432, Norway.8Unit of Genetic Epidemiology, Division of Cancer Epidemiology, Deutches Krebsforschungszentrum, 69120 Heidelberg, Germany.
Received: 24 June 2014 Accepted: 8 December 2014
References
1. Folkerd E, Dowsett M:Sex hormones and breast cancer risk and prognosis.Breast2013,22:S38–S43. doi:10.1016/j.breast.2013.07.007. 2. Key T, Appleby P, Barnes I, Reeves G:Endogenous sex hormones and
breast cancer in postmenopausal women: reanalysis of nine prospective studies.J Natl Cancer Inst2002,94:606–616.
3. Endogenous Hormones and Breast Cancer Collaborative Group, Key TJ, Appleby PN, Reeves GK, Travis RC, Alberg AJ, Barricarte A, Berrino F, Krogh V, Sieri S, Brinton LA, Dorgan JF, Dossus L, Dowsett M, Eliassen AH, Fortner RT, Hankinson SE, Helzlsouer KJ, Hoffman-Bolton J, Comstock GW, Kaaks R, Kahle LL, Muti P, Overvad K, Peeters PH, Riboli E, Rinaldi S, Rollison DE, Stanczyk FZ, Trichopoulos D,et al:Sex hormones and risk of breast cancer in premenopausal women: a collaborative reanalysis of individual participant data from seven prospective studies.Lancet Oncol2013,
4. Haynes BP, Viale G, Galimberti V, Rotmensz N, Gibelli B, A’Hern R, Smith IE, Dowsett M:Expression of key oestrogen-regulated genes differs substantially across the menstrual cycle in oestrogen receptor-positive primary breast cancer.Breast Cancer Res Treat2013,138:157–165. doi:10.1007/s10549-013-2426-0.
5. Simpson ER, Mahendroo MS, Means GD, Kilgore MW, Hinshelwood MM, Graham-Lorence S, Amarneh B, Ito Y, Fisher CR, Michael MD, Mendelson CR, Bulun SE:Aromatase cytochrome P450, the enzyme responsible for estrogen biosynthesis.Endocr Rev1994,15:342–355.
6. Bulun SE, Sebastian S, Takayama K, Suzuki T, Sasano H, Shozu M:The humanCYP19(aromatase P450) gene: update on physiologic roles and genomic organization of promoters.J Steroid Biochem Mol Biol2003,
86:219–224.
7. Morris PG, Hudis CA, Giri D, Morrow M, Falcone DJ, Zhou XK, Du B, Brogi E, Crawford CB, Kopelovich L, Subbaramaiah K, Dannenberg AJ:Inflammation and increased aromatase expression occur in the breast tissue of obese women with breast cancer.Cancer Prev Res (Phila)2011,4:1021–1029. 8. Zhao Y, Nichols JE, Valdez R, Mendelson CR, Simpson ER:Tumor necrosis
factor-αstimulates aromatase gene expression in human adipose stromal cells through use of an activating protein-1 binding site upstream of promoter 1.4.Mol Endocrinol1996,10:1350–1357. 9. Subbaramaiah K, Howe LR, Bhardwaj P, Du B, Gravaghi C, Yantiss RK, Zhou XK,
Blaho VA, Hla T, Yang P, Kopelovich L, Hudis CA, Dannenberg AJ:Obesity is associated with inflammation and elevated aromatase expression in the mouse mammary gland.Cancer Prev Res (Phila)2011,4:329–346. 10. Haiman CA, Dossus L, Setiawan VW, Stram DO, Dunning AM, Thomas G,
Thun MJ, Albanes D, Altshuler D, Ardanaz E, Boeing H, Buring J, Burtt N, Calle EE, Chanock S, Clavel-Chapelon F, Colditz GA, Cox DG, Feigelson HS, Hankinson SE, Hayes RB, Henderson BE, Hirschhorn JN, Hoover R, Hunter DJ, Kaaks R, Kolonel LN, Le Marchand L, Lenner P, Lund E,et al:Genetic variation at theCYP19A1locus predicts circulating estrogen levels but not breast cancer risk in postmenopausal women.Cancer Res2007,
67:1893–1897. doi:10.1158/0008-5472.can-06-4123.
11. Tamimi RM, Hankinson SE, Colditz GA, Byrne C:Endogenous sex hormone levels and mammographic density among postmenopausal women.
Cancer Epidemiol Biomarkers Prev2005,14:2641–2647. doi:10.1158/1055-9965.epi-05-0558.
12. Becker S, Kaaks R:Exogenous and endogenous hormones, mammographic density and breast cancer risk: can mammographic density be considered an intermediate marker of risk?Recent Results Cancer Res2009,181:135–157.
13. Johansson H, Gandini S, Bonanni B, Mariette F, Guerrieri-Gonzaga A, Serrano D, Cassano E, Ramazzotto F, Baglietto L, Sandri MT, Decensi A:Relationships between circulating hormone levels, mammographic percent density and breast cancer risk factors in postmenopausal women.Breast Cancer Res Treat 2008,108:57–67.
14. Walker K, Fletcher O, Johnson N, Coupland B, McCormack VA, Folkerd E, Gibson L, Hillier SG, Holly JM, Moss S, Dowsett M, Peto J, dos Santos Silva I:
Premenopausal mammographic density in relation to cyclic variations in endogenous sex hormone levels, prolactin, and insulin-like growth factors.Cancer Res2009,69:6490–6499.
15. Greendale GA, Palla SL, Ursin G, Laughlin GA, Crandall C, Pike MC, Reboussin BA:
The association of endogenous sex steroids and sex steroid binding proteins with mammographic density: results from the Postmenopausal Estrogen/ Progestin Interventions Mammographic Density Study.Am J Epidemiol2005,
162:826–834. doi:10.1093/aje/kwi286.
16. McCormack VA, dos Santos SI:Breast density and parenchymal patterns as markers of breast cancer risk: a meta-analysis.Cancer Epidemiol Biomarkers Prev2006,15:1159–1169.
17. Pettersson A, Graff RE, Ursin G, dos Santos Silva I, McCormack V, Baglietto L, et al. Mammographic density phenotypes and risk of breast cancer: a meta-analysis. J Natl Cancer Inst. in press. doi: 10.1093/jnci/dju078.
18. Ursin G, Lillie EO, Lee E, Cockburn M, Schork NJ, Cozen W, Parisky YR, Hamilton AS, Astrahan MA, Mack T:The relative importance of genetics and environment on mammographic density.Cancer Epidemiol Biomarkers Prev2009,18:102–112.
19. Boyd NF, Martin LJ, Rommens JM, Paterson AD, Minkin S, Yaffe MJ, Stone J, Hopper JL:Mammographic density: a heritable risk factor for breast cancer.
Methods Mol Biol2009,472:343–360. doi:10.1007/978-1-60327-492-0_15. 20. Lindström S, Vachon CM, Li J, Varghese J, Thompson D, Warren R, Brown J,
Leyland J, Audley T, Wareham NJ, Loos RJ, Paterson AD, Rommens J,
Waggott D, Martin LJ, Scott CG, Pankratz VS, Hankinson SE, Hazra A, Hunter DJ, Hopper JL, Southey MC, Chanock SJ, dos Santos Silva I, Liu J, Eriksson L, Couch FJ, Stone J, Apicella C, Czene K,et al:Common variants inZNF365 are associated with both mammographic density and breast cancer risk.Nat Genet2011,43:185–187. doi:10.1038/ng.760.
21. Vachon CM, Kuni CC, Anderson K, Anderson VE, Sellers TA:Association of mammographically defined percent breast density with epidemiologic risk factors for breast cancer (United States).Cancer Causes Control2000,
11:653–662.
22. Ursin G, Longnecker MP, Haile RW, Greenland S:A meta-analysis of body mass index and risk of premenopausal breast cancer.Epidemiology1995,
6:137–141.
23. Suzuki R, Iwasaki M, Inoue M, Sasazuki S, Sawada N, Yamaji T, Shimazu T, Tsugane S, the Japan Public Health Center-based Prospective Study Group:
Body weight at age 20 years, subsequent weight change and breast cancer risk defined by estrogen and progesterone receptor status—the Japan public health center-based prospective study.Int J Cancer2011,
129:1214–1224. doi:10.1002/ijc.25744.
24. Suzuki S, Kojima M, Tokudome S, Mori M, Sakauchi F, Wakai K, Fujino Y, Lin Y, Kikuchi S, Tamakoshi K, Tamakoshi A:Obesity/weight gain and breast cancer risk: findings from the Japan collaborative cohort study for the evaluation of cancer risk.J Epidemiol2013,23:139–145.
25. Michels KB, Terry KL, Eliassen AH, Hankinson SE, Willett WC:Adult weight change and incidence of premenopausal breast cancer.Int J Cancer2012,
130:902–909. doi:10.1002/ijc.26069.
26. Harris HR, Willett WC, Terry KL, Michels KB:Body fat distribution and risk of premenopausal breast cancer in the Nurses’Health Study II.J Natl Cancer Inst2011,103:273–278. doi:10.1093/jnci/djq500.
27. Lahmann PH, Hoffmann K, Allen N, van Gils CH, Khaw KT, Tehard B, Berrino F, Tjønneland A, Bigaard J, Olsen A, Overvad K, Clavel-Chapelon F, Nagel G, Boeing H, Trichopoulos D, Economou G, Bellos G, Palli D, Tumino R, Panico S, Sacerdote C, Krogh V, Peeters PH, Bueno-de-Mesquita HB, Lund E, Ardanaz E, Amiano P, Pera G, Quirós JR, Martínez C,et al:Body size and breast cancer risk: findings from the European Prospective Investigation into Cancer and Nutrition (EPIC).Int J Cancer2004,
111:762–771. doi:10.1002/ijc.20315.
28. Suzuki R, Orsini N, Saji S, Key TJ, Wolk A:Body weight and incidence of breast cancer defined by estrogen and progesterone receptor status—a meta-analysis.Int J Cancer2009,124:698–712. doi:10.1002/ijc.23943. 29. Emaus A, Espetvedt S, Veierød MB, Ballard-Barbash R, Furberg AS, Ellison PT,
Jasienska G, Hjartåker A, Thune I:17-β-estradiol in relation to age at menarche and adult obesity in premenopausal women.Hum Reprod 2008,23:919–927.
30. Furberg AS, Jasienska G, Bjurstam N, Torjesen PA, Emaus A, Lipson SF, Ellison PT, Thune I:Metabolic and hormonal profiles: HDL cholesterol as a plausible biomarker of breast cancer risk. The Norwegian EBBA Study.
Cancer Epidemiol Biomarkers Prev2005,14:33–40.
31. Lillegaard IT, Andersen LF:Validation of a pre-coded food diary with energy expenditure, comparison of under-reporters v. acceptable reporters.Br J Nutr2005,94:998–1003.
32. Lipson SF, Ellison PT:Development of protocols for the application of salivary steroid analysis to field conditions.Am J Hum Biol1989,1:249–255. doi:10.1002/ajhb.1310010304.
33. Ellison PT, Lipson SF:Salivary estradiol–a viable alternative?Fertil Steril 1999,72:951–952.
34. Lipson SF, Ellison PT:Comparison of salivary steroid profiles in naturally occurring conception and non-conception cycles.Hum Reprod1996,
11:2090–2096.
35. Ursin G, Astrahan MA, Salane M, Parisky YR, Pearce JG, Daniels JR, Pike MC, Spicer DV:The detection of changes in mammographic densities.Cancer Epidemiol Biomarkers Prev1998,7:43–47.
36. Ursin G, Ma H, Wu AH, Bernstein L, Salane M, Parisky YR, Astrahan M, Siozon CC, Pike MC:Mammographic density and breast cancer in three ethnic groups.
Cancer Epidemiol Biomarkers Prev2003,12:332–338.
37. Passarelli MN, Phipps AI, Potter JD, Makar KW, Coghill AE, Wernli KJ, White E, Chan AT, Hutter CM, Peters U, Newcomb PA:Common single-nucleotide polymorphisms in the estrogen receptorβpromoter are associated with colorectal cancer survival in postmenopausal women.Cancer Res2013,
73:767–775. doi:10.1158/0008-5472.can-12-2484.
association analyses using linkage disequilibrium.Am J Hum Genet2004,
74:106–120. doi:10.1086/381000.
39. Thorisson GA, Smith AV, Krishnan L, Stein LD:The International HapMap Project Web site.Genome Res2005,15:1592–1593. doi:10.1101/gr.4413105. 40. Rice MS, Biessy C, Lajous M, Bertrand KA, Tamimi RM, Torres-Mejía G,
López-Ridaura R, Romieu I:Metabolic syndrome and mammographic density in Mexican women.Cancer Prev Res (Phila)2013,6:701–710. doi:10.1158/1940-6207.CAPR-12-0475.
41. Milne RL, Burwinkel B, Michailidou K, Arias-Perez JI, Zamora MP, Menéndez-Rodríguez P, Hardisson D, Mendiola M, González-Neira A, Pita G, Alonso MR, Dennis J, Wang Q, Bolla MK, Swerdlow A, Ashworth A, Orr N, Schoemaker M, Ko YD, Brauch H, Hamann U, Network GENICA, Andrulis IL, Knight JA, Glendon G, Tchatchou S, kConFab Investigators, Australian Ovarian Cancer Study Group, Matsuo K, Ito H,et al:Common non-synonymous SNPs associated with breast cancer susceptibility: findings from the Breast Cancer Association Consortium.Hum Mol Genet2014,23:6096–6111. doi:10.1093/hmg/ddu311.
42. Robbez-Masson LJ, Bödör C, Jones JL, Hurst HC, Fitzgibbon J, Hart IR, Grose RP:
Functional analysis of a breast cancer-associated FGFR2 single nucleotide polymorphism using zinc finger mediated genome editing.PLoS One2013,
8:e78839. doi:10.1371/journal.pone.0078839.
43. Cai H, Shu XO, Egan KM, Cai Q, Long JR, Gao YT, Zheng W:Association of genetic polymorphisms inCYP19A1and blood levels of sex hormones among postmenopausal Chinese women.Pharmacogenet Genomics2008,
18:657–664. doi:10.1097/FPC.0b013e3282fe3326.
44. Wang L, Ellsworth KA, Moon I, Pelleymounter LL, Eckloff BW, Martin YN, Fridley BL, Jenkins GD, Batzler A, Suman VJ, Ravi S, Dixon JM, Miller WR, Wieben ED, Buzdar A, Weinshilboum RM, Ingle JN:Functional genetic polymorphisms in the aromatase geneCYP19vary the response of breast cancer patients to neoadjuvant therapy with aromatase inhibitors.Cancer Res2010,70:319–328. doi:10.1158/0008-5472.can-09-3224. 45. Li J, Eriksson L, Humphreys K, Czene K, Liu J, Tamimi RM, Lindström S,
Hunter DJ, Vachon CM, Couch FJ, Scott CG, Lagiou P, Hall P:Genetic variation in the estrogen metabolic pathway and mammographic density as an intermediate phenotype of breast cancer.Breast Cancer Res 2010,12:R19. doi:10.1186/bcr2488.
46. Ozhand A, Lee E, Wu AH, Ellingjord-Dale M, Akslen LA, McKean-Cowdin R, Ursin G:Variation in inflammatory cytokine/growth-factor genes and mammographic density in premenopausal women aged 50–55.PLoS One2013,8:e65313.
47. Kristensen VN, Andersen TI, Lindblom A, Erikstein B, Magnus P, Børresen-Dale AL:
A rare CYP19 (aromatase) variant may increase the risk of breast cancer.
Pharmacogenetics1998,8:43–48.
48. Low YL, Li Y, Humphreys K, Thalamuthu A, Li Y, Darabi H, Wedrén S, Bonnard C, Czene K, Iles MM, Heikkinen T, Aittomäki K, Blomqvist C, Nevanlinna H, Hall P, Liu ET, Liu J:Multi-variant pathway association analysis reveals the importance of genetic determinants of estrogen metabolism in breast and endometrial cancer susceptibility.PLoS Genet 2010,6:e1001012. doi:10.1371/journal.pgen.1001012.
49. Ma X, Qi X, Chen C, Lin H, Xiong H, Li Y, Jiang J:Association between CYP19 polymorphisms and breast cancer risk: results from 10,592 cases and 11,720 controls.Breast Cancer Res Treat2010,122:495–501. 50. Talbott KE, Gammon MD, Kibriya MG, Chen Y, Teitelbaum SL, Long CM,
Gurvich I, Santella RM, Ahsan H:ACYP19(aromatase) polymorphism is associated with increased premenopausal breast cancer risk.Breast Cancer Res Treat2008,111:481–487. doi:10.1007/s10549-007-9794-2. 51. Zins K, Mogg M, Schneeberger C, Abraham D, Schreiber M:Analysis of the
rs10046 Polymorphism of Aromatase (CYP19) in Premenopausal Onset of Human Breast Cancer.Int J Mol Sci2014,15:712–724. doi:10.3390/ ijms15010712.
52. Liedtke S, Schmidt ME, Vrieling A, Lukanova A, Becker S, Kaaks R, Zaineddin AK, Buck K, Benner A, Chang-Claude J, Steindorf K:Postmenopausal sex hormones in relation to body fat distribution.Obesity (Silver Spring)2012,
20:1088–1095. doi:10.1038/oby.2011.383.
53. Williams NI, Reed JL, Leidy HJ, Legro RS, De Souza MJ:Estrogen and progesterone exposure is reduced in response to energy deficiency in women aged 25–40 years.Hum Reprod2010,25:2328–2339. doi:10.1093/ humrep/deq172.
54. Campbell KL, Foster-Schubert KE, Alfano CM, Wang CC, Wang CY, Duggan CR, Mason C, Imayama I, Kong A, Xiao L, Bain CE, Blackburn GL, Stanczyk FZ, McTiernan A:Reduced-calorie dietary weight loss, exercise, and sex
hormones in postmenopausal women: randomized controlled trial.J Clin Oncol2012,30:2314–2326.
55. Iversen A, Thune I, McTiernan A, Makar KW, Wilsgaard T, Ellison PT, Jasienska G, Flote V, Poole EM, Furberg AS:Genetic polymorphismCYP17rs2486758 and metabolic risk factors predict daily salivary 17β-estradiol
concentration in healthy premenopausal Norwegian women. The EBBA-I study.J Clin Endocrinol Metab2012,97:E852–E857.
56. Yaghjyan L, Colditz GA, Rosner B, Tamimi RM:Mammographic breast density and subsequent risk of breast cancer in postmenopausal women according to the time since the mammogram.Cancer Epidemiol Biomarkers Prev2013,22:1110–1117.
57. van Gils CH, Hendriks JH, Otten JD, Holland R, Verbeek AL:Parity and mammographic breast density in relation to breast cancer risk: indication of interaction.Eur J Cancer Prev2000,9:105–111.
58. Lin JH, Gunter MJ, Manson JE, Rexrode KM, Cook NR, Kraft P, Cochrane BB, Chlebowski RT, Ho GY, Zhang SM:The aromatase gene (CYP19A1) variants and circulating hepatocyte growth factor in postmenopausal women.
PLoS One2012,7:e42079. doi:10.1371/journal.pone.0042079.
59. Casbas-Hernandez P, D’Arcy M, Roman-Perez E, Brauer HA, McNaughton K, Miller SM, Chhetri RK, Oldenburg AL, Fleming JM, Amos KD, Makowski L, Troester MA:Role of HGF in epithelial-stromal cell interactions during progression from benign breast disease to ductal carcinoma in situ.
Breast Cancer Res2013,15:R82. doi:10.1186/bcr3476.
60. Schoemaker MJ, Folkerd EJ, Jones ME, Rae M, Allen S, Ashworth A, Dowsett M, Swerdlow AJ:Combined effects of endogenous sex hormone levels and mammographic density on postmenopausal breast cancer risk: results from the Breakthrough Generations Study.Br J Cancer2014,
110:1898–1907. doi:10.1038/bjc.2014.64.
61. Tworoger SS, Zhang X, Eliassen AH, Qian J, Colditz GA, Willett WC, Rosner BA, Kraft P, Hankinson SE:Inclusion of endogenous hormone levels in risk prediction models of postmenopausal breast cancer.J Clin Oncol2014,
32:3111–3117. doi:10.1200/jco.2014.56.1068.
62. Holst JP, Soldin OP, Guo T, Soldin SJ:Steroid hormones: relevance and measurement in the clinical laboratory.Clin Lab Med2004,24:105–118. doi:10.1016/j.cll.2004.01.004.
63. Furberg AS, Veierød MB, Wilsgaard T, Bernstein L, Thune I:Serum high-density lipoprotein cholesterol, metabolic profile, and breast cancer risk.
J Natl Cancer Inst2004,96:1152–1160.
Submit your next manuscript to BioMed Central and take full advantage of:
• Convenient online submission
• Thorough peer review
• No space constraints or color figure charges
• Immediate publication on acceptance
• Inclusion in PubMed, CAS, Scopus and Google Scholar
• Research which is freely available for redistribution