RESEARCH ARTICLE
Genome-wide analysis of overlapping
genes regulated by iron deficiency
and phosphate starvation reveals new
interactions in Arabidopsis roots
Wenfeng Li
1,2and Ping Lan
2*Abstract
Background: Iron (Fe) and phosphorus (P) are essential mineral nutrients in plants. Knowledge regarding global changes in the abundance of Fe-responsive genes under Pi deficiency as well as the processes these genes are involved in remains largely unavailable at the genome level. In the current study, we comparatively analyzed RNA sequencing data sets relative to Fe deficiency (NCBI: SRP044814) and Pi starvation (NCBI: SRA050356.1).
Results: Analysis showed a total of 579 overlapping genes that are responsible for both Fe deficiency and Pi starva-tion in Arabidopsis roots. A subset of 137 genes had greater than twofold changes in transcript abundant as a result of the treatments. Gene ontology (GO) analysis showed that the stress-related processes ‘response to salt stress’, ‘response to oxidative stress’, and ‘response to zinc ion’ were enriched in the 579 genes, while Fe response-related pro-cesses, including ‘cellular response to nitric oxide’, ‘cellular response to iron ion’, and ‘cellular iron ion homeostasis’, were also enriched in the subset of 137 genes. Co-expression analysis of the 579 genes using the MACCU toolbox yielded a network consisting of 292 nodes (genes). Further analysis revealed that a subset of 90 genes were up-regulated under Fe shortage, but down-regulated under Pi starvation. GO analysis in this group of genes revealed an increased cel-lular response to iron ion/nitric oxide/ethylene stimuli. Promoter analysis was performed in 35 of the 90 genes with a 1.5-fold or greater change in abundance, showing that 12 genes contained the PHOSPHATE STARVATION RESPONSE1-binding GNATATNC cis-element within their promoter regions. Quantitative real-time PCR showed that the decreased abundance of Fe acquisition genes under Pi deficiency exclusively relied on Fe concentration in Pi-deficient media. Conclusions: Comprehensive analysis of the overlapping genes derived from Fe deficiency and Pi starvation pro-vides more information to understand the link between Pi and Fe homeostasis. Gene clustering and root-specific co-expression analysis revealed several potentially important genes which likely function as putative novel players in response to Fe and Pi deficiency or in cross-talk between Fe-deficient responses and Pi-deficient signaling.
Keywords: Iron deficiency, Phosphate deficiency, RNA-seq, Co-expression, Interaction
© 2015 Li and Lan. This article is distributed under the terms of the Creative Commons Attribution 4.0 International License (http://creativecommons.org/licenses/by/4.0/), which permits unrestricted use, distribution, and reproduction in any medium, provided you give appropriate credit to the original author(s) and the source, provide a link to the Creative Commons license, and indicate if changes were made. The Creative Commons Public Domain Dedication waiver (http://creativecommons.org/ publicdomain/zero/1.0/) applies to the data made available in this article, unless otherwise stated.
Background
The evolutionary ability of iron (Fe) to change oxidation states between Fe(III) and Fe(II) renders it irreplaceably important in many essential processes associated with
basic redox reactions, such as in photosynthesis, respira-tion and many vital enzymatic reacrespira-tions [1–5]. Although Fe is abundant in the earth’s crust, it is one of the least available elements for plants in aerobic soils with neu-tral to basic pH [1–5]. Approximately 30 % of the land worldwide consists of alkaline soils, leading to a demand in bioavailable Fe for plant fitness [1, 5, 6]. As a conse-quence, Fe deficiency is a major constraint in crop yield and quality [7]. In contrast, in acidic and anaerobic
Open Access
*Correspondence: plan@issas.ac.cn
2 State Key Laboratory of Soil and Sustainable Agriculture, Institute of Soil Science, Chinese Academy of Sciences, Nanjing 210008, People’s Republic of China
conditions, accumulation of excess Fe is toxic to plant growth and development due to formation of potentially harmful reactive oxygen species (ROS). Plants therefore must tightly regulate cellular Fe homeostasis to allow for effective acquisition, distribution and utilization of Fe [1, 8, 9].
Under Fe-deficient conditions, Arabidopsis ( Arabidop-sis thaliana) and other dicotyledonous and non-gramina-ceous monocotyledonous plants use a reduction strategy, referred to as strategy I [10], to increase Fe bioavailability. In this strategy, acidification of the rhizosphere mediated by the H+-translocating P-type ATPase AHA2 [6, 11]
occurs as the first step, which leads to an increase in the concentration of chelated Fe(III). Fe(III) is subsequently reduced to soluble Fe(II) by the root surface-localized ferric chelate reductase FERRIC-REDUCTION OXI-DASE2 (FRO2) [12]. Soluble Fe(II) is then transported into epidermal cells by the Fe-REGULATED TRANS-PORTER1 (IRT1) [13]. Being the major components of the Fe acquisition system, FRO2 and IRT1 are the major players controlling entry of Fe from the soil into cells. At the transcriptional level, expression of both genes is coordinately regulated by the basic helix-loop-helix (bHLH) transcription factor FER-LIKE Fe DEFICIENCY-INDUCED TRANSCRIPTION FACTOR (FIT), but not the transcription factor POPEYE, which is also involved in Fe homeostasis [14–17]. FIT forms heterodimers with bHLH38 and bHLH39 and positively regulates a sub-set of Fe-responsive genes, including three key genes required for Fe acquisition [12–14, 18, 19]. Recent studies have shown that the transcription factors bHLH100 and bHLH101, which belong to the Ib sub-group of bHLH proteins, are also involved in Arabidopsis Fe deficiency responses by interacting with FIT [20] or via a FIT-inde-pendent manner [21].
Studies have shown that expression of FRO2 and IRT1 is tightly controlled both locally and systemically [22, 23]. However, in some cases disrupted Fe signaling in several mutants, such as frd3 [24, 25], opt3 [26] and the quadruple nicotianamine synthase mutant nas4x-1 [27] in Arabidopsis, dgl and brz mutants [28–30] in pea (Pisum sativum) and the chloronerva mutant chln [31] in tomato (Solanum lycopersicum), constitutively activates expression of Fe acquisition genes even under sufficient Fe conditions. By contrast, FRO2 and IRT1 expression has been documented to be decreased under phosphate (Pi)-deficient conditions [32–36]. Currently, the pre-dominate explanation for decreased expression of Fe acquisition genes under Pi-deficient conditions is that Pi deficiency results in enhanced Fe accessibility to plants in the media, which leads to an over accumulation of Fe in plants, subsequently causing down-regulated expres-sion of Fe-responsive genes. However, if the Pi-deficient
media without available Fe or with low concentrations of Fe, does the down-regulated expression of Fe-responsive genes occur? A recent report showed that PHOSPHATE STARVATION RESPONSE1 (PHR1), a major regulator of the Pi deficiency response, could bind the promoter of the Fe storage gene Ferritin1 through the imperfect palin-dromic sequence motif P1BS (PHR1 binding sequences, GNATATNC), strongly supporting the link between Fe and Pi homeostasis [37]. However, it remains an open question whether this link exists or not in phr1 mutant plants.
Moreover, although down-regulation of Fe deficient-induced Fe acquisition genes under Pi deficient con-ditions has been documented [33, 38, 39], knowledge regarding genome-wide transcriptional changes of Fe-responsive genes under Pi deficiency remains unavail-able, and the processes of the genes involved are largely unknown. To provide systemic information about transcriptional changes in Fe-responsive genes under Pi deficiency and to further extend knowledge of the relationship between Fe and Pi at the transcript level, we mined and re-analyzed previous RNA sequencing (RNA-seq) data sets relative to transcriptome profiling in Fe-deficient [40] and Pi-deficient Arabidopsis roots [36], with an emphasis on 579 overlapping genes that respond to both Fe and Pi deficiency. We revealed that a subset of 137 genes had a twofold or greater change in abundance under either of the treatments. A subset of 90 genes with an increased abundance under Fe deficiency, but a decrease under Pi deficiency, may be critical for Fe responses under Pi-deficient conditions. By gene cluster-ing and root-specific co-expression analysis, we revealed several potentially important genes that likely function as putative novel players in response to Fe and Pi deficiency or in the cross talk between Fe deficient responses and phosphate-deficient signaling, which may be determined in follow-up experiments. Finally, we found that FIT-reg-ulated genes were down-regFIT-reg-ulated by Pi deficiency, and an extent of Fe in the Pi deficient media is required for this down-regulation, suggesting that, besides FIT, PHR1, Fe itself might be a critical factor involved in the tran-scriptional regulation under both Pi- and Fe-deficiency.
Results
Genes responsible for Fe and Pi deficiency in Arabidopsis roots
decrease in transcript abundance, with fold changes greater than twofold under either of the treatments (Table 1; Additional file 2). Fe acquisition genes FRO2 and IRT1, copper transporter COPT2, Fe(II)-dependent oxygenase gene AT3G12900, cytochrome P450 CYP82C4 (AT4G31940), mannose-binding lectin protein gene AT1G52120, glutathione transferase lambda 1 GSTL1 and amino acid transporter gene AT5G38820 showed the strongest induction under Fe deficiency and were up-reg-ulated by more than 50-fold (Table 1; Fig. 2a). Excluding AT1G52120, these genes were among the most repressed under Pi deficiency and were down-regulated by two to more than tenfold (Table 1; Fig. 2a). Genes encod-ing transcriptional factor bHLH039, ZIP9, zinc bindencod-ing protein (AT1G74770), ATROPGEF10, receptor like pro-tein 24 RLP24, phloem propro-tein 2-B6 and other function-ally unknown proteins were among the second group of highly induced genes following Fe deficiency and were up-regulated by more than fivefold (Table 1; Fig. 2a, b). The most induced genes following Pi deficiency were
AtOCT1, an unknown protein gene AT5G20790 and a
major facilitator protein gene AT1G30560, which were induced by more than 50-fold (Table 1; Fig. 2c). Highly induced genes under Pi deficiency were ATPS3 (phos-phate starvation-induced gene 3), SQD2 (sulfoquinovosyl diacylglycerol 2) and U-box domain-containing protein kinase gene AT5G65500, with changes more than five-fold (Table 1; Fig. 2d, e). Interestingly, a subset of genes involved in lignin biosynthesis was induced by both Fe and Pi deficiency (Table 1; Fig. 2f).
Gene ontology (GO) analysis of the 579 overlapping genes revealed that stress-related processes, including ‘response to salt stress’, ‘response to oxidative stress’ and
‘response to zinc ion’, were enriched (Additional file 3), while analysis of the subset of 137 genes showed that Fe response-related processes, including ‘cellular response to nitric oxide’, ‘cellular response to Fe ion’ and ‘cellular Fe ion homeostasis’, were also enriched (Additional file 4).
Gene expression patterns of overlapping genes
Expression patterns of the 579 overlapping genes were divided into four types according to changes at the tran-script level under two stress conditions (Fig. 3a). Type one was composed of 223 genes (of which 24 genes were down-regulated by more than twofold) with decreased transcription under both Pi and Fe deficiency. GO analy-sis of this group of genes revealed that the processes of ‘embryo development ending in seed dormancy’, ‘micro-tubule-based process’ and ‘chloroplast organization’, were most enriched (Fig. 3b). In contrast, transcript abun-dance of 169 genes in the type two category were shown to be increased following both Pi and Fe deficiency, with processes of ‘glucosinolate and leucine biosynthesis’ and ‘UV response’ being enriched (Fig. 3b). Type three was composed of 97 genes with increased transcript abun-dance under Pi deficiency, but decreased under Fe defi-ciency. In contrast, transcript abundance of the 90 genes in type four were decreased under Pi deficiency and increased under Fe deficiency. GO enrichment analysis showed that the zinc-related processes ‘response to zinc ion’, ‘zinc ion transport’ and ‘galactose metabolic process’ were enriched in type three (Fig. 3b). Iron-related pro-cesses ‘cellular response to Fe ion’, ‘cellular response to nitric oxide’, ‘cellular response to ethylene stimulus’, ‘cellu-lar Fe ion homeostasis’ and ‘protein import into nucleus’ were enriched in type four (Fig. 3b).
Identification of overlapping gene modules by co‑expression analysis
Stress-specific variability in gene expression may occur at the individual gene level, but can also occur in a coor-dinated manner. To determine functional modules, co-expression networks (i.e., groups of genes that show similar expression patterns under diverse conditions) of the 579 overlapping genes were generated using MACCU software [41]. Pairwise co-expressed genes were selected with a Pearson correlation coefficient cutoff of 0.7 [36, 41]. The 300 publicly available microarrays that were mined for co-expression analysis discriminated between root-related experiments. As such, the co-expression relationships reported herein are restricted to roots [42– 44]. Co-expression relationships between these genes were visualized using Cytoscape (http://www.cytoscape. org). This analysis yielded a network composed of 292 nodes (genes) and 1595 edges (correlations between genes; Additional file 5). The network can be further Fig. 1 Bioinformatic analysis scheme of the 579 differentially
[image:3.595.57.291.88.262.2]Table 1 Subset of 137 of the 579 overlapping genes with more than twofold changes in transcript abundance due to either of the treatments
AGI Annotation Mean
(−Fe/+Fe) SD Mean (−Pi/+Pi) SD
At3G12900 2-Oxoglutarate (2OG) and Fe(II)-dependent oxygenase superfamily protein 612.44 199.47 0.06 0.10 At4G31940 CYP82C4, cytochrome P450, family 82, subfamily C, polypeptide 4 184.70 3.63 0.08 0.01 At1G52120 Mannose-binding lectin superfamily protein 157.65 59.83 6.13 2.70
At3G46900 COPT2, copper transporter 2 71.15 33.39 0.40 0.36
At1G01580 ATFRO2, FRD1, FRO2, ferric reduction oxidase 2 59.73 10.56 0.35 0.05 At5G02780 GSTL1, glutathione transferase lambda 1 57.98 10.87 0.69 0.06 At4G19690 ATIRT1, IRT1, iron-regulated transporter 1 54.72 7.88 0.26 0.04 At5G38820 Transmembrane amino acid transporter family protein 54.35 11.69 0.43 0.09 At3G56980 BHLH039, ORG3, basic helix-loop-helix (bHLH) DNA-binding superfamily protein 34.23 13.48 0.73 0.18 At3G13610 2-Oxoglutarate (2OG) and Fe(II)-dependent oxygenase superfamily protein 10.04 0.65 1.63 0.25
At1G73120 Unknown protein 8.98 2.09 0.28 0.11
At1G73220 1-Oct, AtOCT1, organic cation/carnitine transporter1 7.38 6.18 196.69 139.63 At4G33020 ATZIP9, ZIP9, ZIP metal ion transporter family 7.09 2.01 2.21 0.97
At5G05250 Unknown protein 6.62 0.95 0.57 0.10
At3G61410 BEST Arabidopsis thaliana protein match is: U-box domain-containing protein kinase
family protein (TAIR:AT2G45910.1) 6.53 1.32 3.79 0.43
At1G74770 Zinc ion binding 6.43 0.50 0.66 0.07
At5G19560 ATROPGEF10, ROPGEF10, ROP uanine nucleotide exchange factor 10 5.33 0.51 2.12 0.20 At2G02310 AtPP2-B6, PP2-B6, phloem protein 2-B6 5.30 2.01 0.49 0.12 At2G33020 AtRLP24, RLP24, receptor like protein 24 5.05 1.74 0.48 0.33
At3G59880 Unknown protein 4.58 2.42 2.51 0.54
At5G01060 Protein kinase protein with tetratricopeptide repeat domain 4.44 0.17 1.70 0.10 At5G04950 ATNAS1, NAS1, nicotianamine synthase 1 4.39 0.50 0.49 0.01
At3G57157 Other RNA 4.28 0.37 9.81 1.46
At3G60330 AHA7, HA7, H(+)-ATPase 7 4.27 0.69 1.79 0.21
At3G21500 DXPS1, 1-deoxy-d-xylulose 5-phosphate synthase 1 3.76 1.94 0.40 0.26
At3G21240 4CL2, AT4CL2, 4-coumarate:CoA ligase 2 3.73 0.16 1.25 0.09 At3G50710 F-box/RNI-like/FBD-like domains-containing protein 3.57 1.09 2.71 1.32
At1G18910 Zinc ion binding 3.33 0.13 0.78 0.04
At5G48657 Defense protein-related 3.33 0.71 1.36 0.23
At1G01380 ETC1, Homeodomain-like superfamily protein 3.22 1.09 3.73 1.22 At1G51680 4CL.1, 4CL1, AT4CL1, 4-coumarate:CoA ligase 1 3.22 0.06 1.27 0.19
At5G54790 Unknown protein 3.20 0.75 2.02 0.19
At2G01880 ATPAP7, PAP7, purple acid phosphatase 7 3.14 0.21 3.31 0.81
At5G19970 Unknown protein 2.81 0.43 0.57 0.07
At5G65500 U-box domain-containing protein kinase family protein 2.73 0.60 6.26 0.42
At4G12735 Unknown protein 2.67 1.20 1.87 0.47
At3G57160 Unknown protein 2.57 0.55 1.46 0.23
At5G26820 ATIREG3, IREG3, IREG3, MAR1, RTS3, iron-regulated protein 3 2.54 0.28 0.77 0.19
At4G30490 AFG1-like ATPase family protein 2.52 0.32 1.40 0.08
At1G78230 Outer arm dynein light chain 1 protein 2.51 0.57 0.59 0.22 At3G18290 BTS, EMB2454, zinc finger protein-related 2.51 0.14 0.76 0.09
At1G51870 Protein kinase family protein 2.42 0.42 2.25 0.83
At5G22555 Unknown protein 2.37 0.58 4.13 2.07
Table 1 continued
AGI Annotation Mean
(−Fe/+Fe) SD Mean (−Pi/+Pi) SD
At4G22980 Pyridoxal phosphate (PLP)-dependent transferases superfamily protein
(TAIR:AT5G51920.1) 2.30 0.28 0.56 0.14
At1G14190 Glucose-methanol-choline (GMC) oxidoreductase family protein 2.29 0.41 0.78 0.08
At1G48300 Unknown protein 2.27 0.25 0.85 0.07
At1G24320 Six-hairpin glycosidases superfamily protein 2.26 0.27 0.78 0.09
At1G62422 Unknown protein 2.25 0.43 1.37 0.10
At4G38950 ATP binding microtubule motor family protein 2.25 0.45 1.50 0.15 At3G47420 ATPS3, PS3, phosphate starvation-induced gene 3 2.24 0.27 12.82 5.53
At5G26320 TRAF-like family protein 2.24 0.26 2.95 0.37
At2G43570 CHI, chitinase, putative 2.22 0.87 2.26 0.45
At4G26890 MAPKKK16, mitogen-activated protein kinase kinase kinase 16 2.16 0.42 3.00 0.85 At5G13910 LEP, Integrase-type DNA-binding superfamily protein 2.14 0.15 1.25 0.16
At5G27920 F-box family protein 2.14 0.15 1.29 0.15
At3G15510 ANAC056, ATNAC2, NAC2, NARS1, NAC domain containing protein 2 2.13 0.62 0.71 0.15 At5G53850 Haloacid dehalogenase-like hydrolase family protein 2.09 0.06 0.96 0.01 At2G18193 P-loop containing nucleoside triphosphate hydrolases superfamily protein 2.07 0.26 1.29 0.01 At2G32960 Phosphotyrosine protein phosphatases superfamily protein 2.07 0.23 4.79 1.23 At1G64590 NAD(P)-binding Rossmann-fold superfamily protein 2.06 0.13 2.39 0.70 At5G48930 HCT, hydroxycinnamoyl-CoA shikimate/quinate hydroxycinnamoyl transferase 2.04 0.17 1.16 0.07
At2G14210 AGL44, ANR1, AGAMOUS-like 44 2.01 0.37 0.82 0.09
At5G20790 Unknown protein 0.32 0.13 90.27 24.26
At1G30560 Major facilitator superfamily protein – – 55.93 32.45
At5G01220 SQD2, sulfoquinovosyldiacylglycerol 2 0.86 0.06 10.49 3.02 At1G72070 Chaperone DnaJ-domain superfamily protein 1.72 0.62 6.60 3.34 At3G52720 ACA1, ATACA1, CAH1, alpha carbonic anhydrase 1 0.40 0.20 5.56 3.11 At1G23140 Calcium-dependent lipid-binding (CaLB domain) family protein 1.58 0.43 5.33 1.19 At3G52190 PHF1, phosphate transporter traffic facilitator1 1.22 0.12 5.25 0.61 At3G56040 UGP3, UDP-glucose pyrophosphorylase 3 0.74 0.18 4.98 0.71 At3G02870 VTC4, Inositol monophosphatase family protein 0.79 0.06 4.64 0.29
At3G16390 NSP3, nitrile specifier protein 3 0.67 0.08 4.55 0.59
At3G07350 Protein of unknown function (DUF506) 0.54 0.07 4.40 0.09 At3G19970 Alpha/beta-hydrolases superfamily protein 1.58 0.08 4.37 0.76 At1G15040 Class I glutamine amidotransferase-like superfamily protein 0.60 0.04 3.73 1.12 At3G12500 ATHCHIB, B-CHI, CHI-B, HCHIB, PR-3, PR3, basic chitinase 0.52 0.05 3.05 0.75
At1G18970 GLP4, germin-like protein 4 0.71 0.12 3.04 0.41
At2G29000 Leucine-rich repeat protein kinase family protein 1.85 0.60 3.03 0.79
At3G53620 AtPPa4, PPa4, pyrophosphorylase 4 0.82 0.03 2.96 0.19
At1G14220 Ribonuclease T2 family protein 0.74 0.18 2.89 0.27
At4G32480 Protein of unknown function (DUF506) 1.35 0.19 2.85 1.36
At3G06962 Other RNA 1.82 0.49 2.74 0.44
At1G11920 Pectin lyase-like superfamily protein – – 2.68 0.51
At1G08650 ATPPCK1, PPCK1, phosphoenolpyruvate carboxylase kinase 1 1.77 0.16 2.58 0.21 At4G04040 MEE51, Phosphofructokinase family protein 0.83 0.04 2.50 0.22 At5G57540 AtXTH13, XTH13, xyloglucan endotransglucosylase/hydrolase 13 1.53 0.11 2.33 0.36
At5G40860 Unknown protein 1.51 0.11 2.32 0.81
[image:5.595.66.540.94.725.2]Table 1 continued
AGI Annotation Mean
(−Fe/+Fe) SD Mean (−Pi/+Pi) SD
At4G30670 Putative membrane lipoprotein 1.61 0.16 2.22 0.17
At3G10420 P-loop containing nucleoside triphosphate hydrolases superfamily protein 1.24 0.08 2.20 0.35 At2G42600 ATPPC2, PPC2, phosphoenolpyruvate carboxylase 2 0.77 0.05 2.18 0.09
At4G11650 ATOSM34, OSM34, osmotin 34 0.67 0.10 2.16 0.38
At2G23960 Class I glutamine amidotransferase-like superfamily protein 1.55 0.27 2.13 0.21 At1G05300 ZIP5, zinc transporter 5 precursor 0.49 0.05 2.13 0.11 At3G13110 ATSERAT2;2, SAT-1, SAT-A, SAT-M, SAT3, SERAT2;2, serine acetyltransferase 2;2 0.83 0.08 2.12 0.22 At2G22290 ATRAB-H1D, ATRAB6, ATRABH1D, RAB-H1D, RABH1d, RAB GTPase homolog H1D 1.91 0.66 2.10 0.59 At4G20160 RING/U-box superfamily protein (TAIR:AT1G30860.1) 1.71 0.10 2.07 0.17
At1G20390 Transposable element gene 0.56 0.11 2.07 0.04
At5G20280 ATSPS1F, SPS1F, sucrose phosphate synthase 1F 0.77 0.06 2.05 0.17 At5G01870 Bifunctional inhibitor/lipid-transfer protein/seed storage 2S albumin superfamily
protein 0.71 0.10 2.05 0.51
At3G05858 Unknown protein 1.64 0.09 2.01 0.47
At2G17280 Phosphoglycerate mutase family protein 1.16 0.02 2.01 0.47 At1G26250 Proline-rich extensin-like family protein 0.55 0.16 2.00 0.82
At4G09110 RING/U-box superfamily protein – – 0.77 0.04
Change in gene expression is shown as the mean and standard deviation (SD)
No change is indicated as “−” in cases when a gene transcript was not determined (read number = zero) in any of the biological replicates under control conditions
[image:6.595.58.541.98.338.2] [image:6.595.59.539.366.659.2]divided into two large and eight small clusters (modules). The largest module was composed of 210 genes, most of which are associated with stress (Additional file 6). GO enrichment analysis revealed that the biological pro-cesses ‘glucosinolate biosynthetic process’, ‘response to cadmium ion’, ‘response to salt stress’ and ‘leucine biosyn-thetic process’ were most enriched in this module (Addi-tional file 7). Via connection to the zinc binding protein gene AT1G74770, two marker genes strongly induced by Fe deficiency, IRT1 (AT4G19690) and CYP82C4 (AT4G31940), were associated with this module.
Co-expression analysis of the subset of 137 overlap-ping genes with changes greater than twofold yielded a network consisting of 48 nodes and 56 edges. The Fe deficiency-regulated marker genes IRT1 and CYP82C4 (AT4G31940) remained in the network (Fig. 4a). This network can be divided into one large (26 genes) and six small clusters (Fig. 4a). Detailed expression informa-tion of these genes upon Fe or Pi deficiency is shown in Fig. 4b. GO enrichment analysis of the genes involved in the co-expression network revealed that the biologi-cal processes ‘cellular response to nitric oxide’, ‘cellular response to Fe ion’ and ‘cellular response to ethylene stimulus’ were enriched (Table 2).
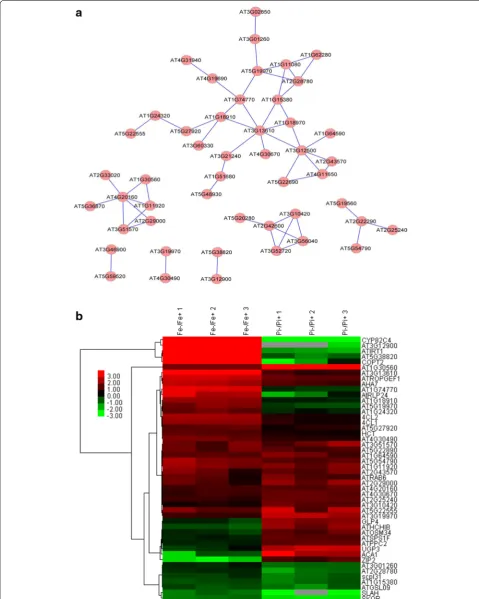
To search for potentially functional novel modules, co-expression analysis was applied to the subset of 90 genes that were induced by Fe deficiency, but down-regulated by Pi deficiency (Additional file l). A network containing 26 nodes and 17 edges was created using the same cri-teria (Fig. 5). The network can be divided into 10 small clusters (none with more than ten nodes), with the largest one containing several Fe-responsive marker genes and one transcriptional factor WRKY 17 (Fig. 5). The second
largest cluster was composed of four genes, including the Pi homeostasis regulator SIZ1 (Fig. 5). For 97 genes induced by Pi deficiency but repressed by Fe deficiency, co-expression analysis resulted in a network containing 26 nodes and 29 edges that were divided into one large and two small clusters (Additional file 8).
Analysis of P1BS motif in 35 genes induced by Fe deficiency but down regulated by Pi deficiency
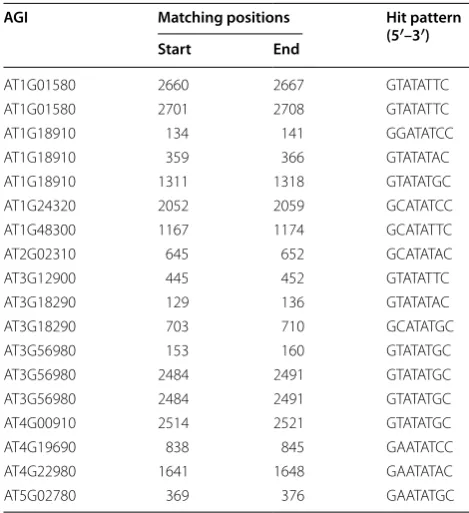
A subset of 35 genes in the type four category had an increase in transcript abundance under Fe deficiency but a decrease under Pi deficiency, with changes more than 1.5-fold (Additional file 9). A 3000 bp sequence upstream of the translation start (named −3000 bp) of these 35
genes was retrieved from TAIR10 and used to search the PHR1 recognition sequence 5′-GNATATNC-3′ (P1BS motif). Results showed that 12 of the 35 genes contained at least one P1BS motif, and seven of the 12 genes con-tained the P1BS motif within −1000 bp of their pro-moter regions (Table 3). In total, 11 P1BS patterns were hit in the 12 genes, with 5′-GTATATGC-3′ and 5′ -GTA-TATTC-3′ being the most frequent (5 and 3 hits out of 18 total hits, respectively).
[image:7.595.55.537.89.274.2]the concentration of Fe was 40 µM), Fe deficiency (−Fe), both Pi- and Fe-deficient (−Pi−Fe), Pi deficiency with low Fe concentration (−Pi + 5 µM Fe) and control con-ditions (+Pi+Fe). Null expression of PHR1 in the phr1 mutant was first verified by quantitative real-time PCR (qPCR) (the ct value of the reference is around 20 cycles while the ct value of the PHR1 is around 34 cycles in the phr1 mutant plants). As shown in Fig. 6a and in agree-ment with previously reported results [45], transcrip-tional expression of PHR1 was not significantly regulated by Pi deficiency in wild type plants and could not be
detected in phr1 mutant plants under both Pi sufficient and deficient conditions. As a control, the expression of SPX1 [46, 47], a Pi-responsive marker gene, was sig-nificantly induced by Pi deficiency. Consistent with our transcriptomic data, transcriptional expression of the Fe acquisition genes IRT1 and FRO2 as well as the Fe defi-ciency-induced marker gene CYP82C4 was significantly Table 2 Gene ontology enrichment was assessed using GOBUin the 48 genes in the large sub-network shown in Fig. 4a (elim, P < 0.01)
GOID P value (elim) GO name
GO: 0071732 1.51E−06 Cellular response to nitric oxide GO: 0071281 9.74E−06 Cellular response to iron ion GO: 0009620 1.11E−04 Response to fungus
GO: 0071369 1.52E−04 Cellular response to ethylene stimulus GO: 0006829 1.54E−04 Zinc ion transport
GO: 0015794 0.001428 Glycerol-3-phosphate transport GO: 0015678 0.001428 High-affinity copper ion transport
GO: 0010421 0.002855 Hydrogen peroxide-mediated programmed cell death GO: 0009805 0.004279 Coumarin biosynthetic process
GO: 0009871 0.004279 Jasmonic acid and ethylene-dependent systemic resistance, ethylene mediated signaling pathway GO: 0009411 0.004536 Response to UV
GO: 0006873 0.005599 Cellular ion homeostasis
GO: 0009963 0.007122 Positive regulation of flavonoid biosynthetic process GO: 0009311 0.007707 Oligosaccharide metabolic process
GO: 0006828 0.009958 Manganese ion transport
[image:9.595.57.541.113.317.2]Fig. 5 Co-expression relationships of the 90 differentially expressed overlapping genes induced by Fe deficiency but repressed by Pi starvation
Table 3 Distribution of the P1BS motif in promoter regions of 12 genes
AGI Matching positions Hit pattern (5′–3′)
Start End
AT1G01580 2660 2667 GTATATTC
AT1G01580 2701 2708 GTATATTC
AT1G18910 134 141 GGATATCC
AT1G18910 359 366 GTATATAC
AT1G18910 1311 1318 GTATATGC
AT1G24320 2052 2059 GCATATCC
AT1G48300 1167 1174 GCATATTC
AT2G02310 645 652 GCATATAC
AT3G12900 445 452 GTATATTC
AT3G18290 129 136 GTATATAC
AT3G18290 703 710 GCATATGC
AT3G56980 153 160 GTATATGC
AT3G56980 2484 2491 GTATATGC
AT3G56980 2484 2491 GTATATGC
AT4G00910 2514 2521 GTATATGC
AT4G19690 838 845 GAATATCC
AT4G22980 1641 1648 GAATATAC
[image:9.595.58.291.339.524.2] [image:9.595.303.538.363.620.2]down-regulated under Pi deficiency in both Col-0 and phr1 roots (Fig. 6a). Because all these Fe-responsive genes tested were mainly regulated by transcription factor FIT [14], we thus tested whether the expression of FIT itself was affected or not by Pi deficiency. As shown in Fig. 6a, the expression level of FIT was significantly lower in Pi-deficient roots than in Pi-sufficient roots in wild type
plants. In addition to FIT, another transcription factor PYE [34], regulating the expression of another subset of Fe-responsive genes, has been reported to be required for plant Fe homeostasis. However, both PYE and its target AT1G74790 were not affected by Pi deficiency (Fig. 6a). To determine whether this down-regulation is depend-ent on Fe concdepend-entrations in the media, we compared Fig. 6 Reverse transcription–quantitative PCR (RT–qPCR) detected expression of Pi- and Fe-responsive marker genes under Pi deficiency (a) or Fe deficiency or Pi deficiency without or with low Fe concentrations (b). Total RNA was isolated from roots in wild type or phr1 mutant plants and qPCR was performed. Expression levels are relative to normal controls. Error bars represent SD of biological replicates from three independent experiments. Data significantly different from the corresponding controls are indicated (‘−Pi’ versus ‘+Pi’, *P < 0.05, **P < 0.01; ‘−Fe’ versus ‘−Fe−Pi’,
[image:10.595.60.539.86.565.2]transcript abundance under Pi deficiency with different Fe concentrations in both wild type and mutant plants. In wild type plant roots, all genes evaluated were dramati-cally induced under Fe deficiency (−Fe) but repressed under Pi deficiency (−Pi) compared to expression under control conditions (+Fe+Pi). Fe deficient-induced up-regulation was not blocked but attenuated by the absence of Pi in Fe-deficient media (−Fe−Pi), while Pi deficient-induced down-regulation was dramatically attenuated by 5 µM Fe (low Fe concentration) in the media (Fig. 6b). Similar to results in wild type plants, these genes were significantly induced under Fe deficiency and Fe and Pi deficiency (−Fe−Pi) in the phr1 mutant roots (Fig. 6b). However, down-regulation of gene expression under Pi deficiency was not all significantly attenuated by 5 µM Fe in Pi-deficient media in the phr1 mutant roots (Fig. 6b).
Discussion
As an essential element for all living organisms, par-ticularly as a major constraint in crop yield and quality, Fe deficiency responses in plants have been extensively studied in the last decade [1, 6, 9]. With the emergence of high throughput research platforms, many genes and proteins have been revealed to be regulated by Fe defi-ciency [40, 48–55]. Evidence has shown that transcrip-tional expression of some Fe-responsive genes can be altered due to deficiencies or excesses of mineral ele-ments, including cross-talk between Fe and other min-eral elements. For example, the Fe transporter LeIRT1 is reported to be up-regulated by potassium (K) deficiency, as revealed by microarray analysis [56], and expression of the K transporter gene LeKC1 was induced not only by K starvation but also by Fe deficiency [56]. Via compre-hensive analysis of Fe-responsive protein kinase (PK) and protein phosphatase (PP) genes, we found that strong over-representation of PK and PP genes that encode proteins is involved in K homeostasis, which supports the link between potassium uptake and Fe deficiency [44]. The ameliorative effect of K supply on Fe-deficient responses was previously reported [57]. Although several lines of evidence have suggested a link between Pi and Fe homeostasis [32–35, 37–39, 58], little genome-wide information on transcriptional expression changes in Fe-responsive genes under Pi deficiency is available, and the biological processes that these genes are involved in remain elusive in Arabidopsis.
By mining previous RNA-seq data sets, we present comprehensive information on transcriptional expres-sion of overlapping genes regulated by Fe and Pi defi-ciency in Arabidopsis roots. In total, 579 overlapping genes, or less than 20 % of all differentially expressed genes evaluated in each treatment, were responsive to both Fe and Pi deficiency. Only 137 of the 579 genes
GO enrichment analysis of the 579 overlapping genes revealed that these Fe- and Pi-responsive genes were associated with diverse biological processes (Additional file 3), particularly with the GO categories ‘response to salt stress’, ‘response to oxidative stress’ and ‘response to zinc ion’ (Additional file 3). These results imply that acclimation of plants to Fe and Pi deficiency and possi-bly other nutritional stresses is associated with profound changes in the transcriptome, including stress-specific responses such as alteration of ribosome composition [43] and other general responses. Only four (AT1G27760, AT3G04720, AT4G11650 and AT5G24090) of the 21 genes associated with ‘response to salt stress’ had an increase in transcript abundance greater than 1.5-fold, suggesting that this common response to Fe and Pi defi-ciency might be less important than Fe response-related processes. GO enrichment analysis of the most respon-sive genes (i.e., those with greater than 1.5-fold change) revealed that Fe response-related processes, were enriched, but none of the Pi response-related processes were (Additional file 4),suggesting that Pi deficiency has more pronounced effects on Fe homeostasis than Fe defi-ciency has on Pi homeostasis.
Functional annotation of a given gene is the most important goal in modern molecular biology and is essential for understanding how the cell works. All omics studies are discovery tools and are not capable of defin-ing gene function. The actual functions of differentially expressed genes under certain conditions discovered by high throughput platforms require further experimental evidence. However, current research platforms can dis-cover hundreds to thousands of differentially expressed genes in a single run, and most of them are annotated as function unknown. Functional exploration of every differentially expressed gene without selection would be extremely laborious and impossible. Fortunately, co-expression analysis provides the option to choose genes of interest for further study. The basic idea of co-expres-sion analysis is that genes that show transcriptionally coordinated expression patterns under diverse condi-tions are often functionally related [61], thus allowing functional predictions regarding genes with unknown functions inferred from their co-expression relationships with genes with known functions [62, 63]. Using co-expression analysis, we discovered ten, six and ten poten-tially critical regulatory modules with diverse nodes from inputs of the 579 (total overlapping genes), 137 (genes with changes greater than twofold) and 90 Fe deficiency-induced, Pi deficiency-repressed genes (Additional file 5; Figs. 4a, 5). Unexpectedly, only 50, 35 and 29 %, respec-tively, of the input genes were associated with formation of co-expression networks, suggesting that the major-ity of overlapping genes are functionally diverse and
involved in a variety of biological processes. The network obtained from the group of 90 Fe deficiency-induced, Pi deficiency-repressed genes (Fig. 3a) is of particular inter-est. In this network, several genes may play important roles in responses to Fe and Pi deficiency. For instance, the gene AT1G74770 annotated with zinc ion binding protein showed a strong relationship with the Fe trans-porter IRT1, implying that this gene may be required for a Fe response. Another putative zinc ion binding protein encoding gene, AT1G18910, was shown to be connected to AT1G74770 and the transcription factor gene WRKY17, suggesting that these genes may also be involved in plant adaptation to Fe deficiency or zinc tox-icity elicited by excess zinc under Fe deficiency.
Indeed, only 34 % of the genes (12 of 35) contained at least one P1BS motif in promoter regions (−3000 bp sequence upstream of the translation start) and only 20 % (7 of 35) had a P1BS motif within −1000 bp of their pro-moter regions, further suggesting that other positive or negative regulators might be involved in down-regulation of these Pi-responsive genes. One of these regulators may be Fe itself. It has been reported that Pi deficiency results in enhanced Fe accessibility to plants in the media, which leads to an over accumulation of Fe in plants, subse-quently causing down-regulated expression of Fe-respon-sive genes. This point of view was confirmed by supply of different Fe concentrations in the Pi deficient media (Fig. 6b). If no additional Fe was supplied to the Pi defi-cient media (−Fe−Pi), the transcriptional expression of all tested genes was induced both in wild type and phr1 mutant plants, an expression pattern similar to the one of Fe deficiency (Fig. 6b). This result suggests that an extent of Fe in the Pi deficient media is required for the down-regulation of Fe-responsive genes under Pi deficiency. Indeed, Pi-deficiency caused down-regulation was much enhanced by supply of 5 µM Fe in the Pi deficient media both in wild type and phr1 mutant plants (Fig. 6b). In the future, the dose effects of Fe in the Pi-deficient media on the transcriptional expression of Fe-responsive genes need further validation.
Conclusions
In summary, we provide genome-wide information on the transcriptional expression of 579 overlapping genes that responded to both Fe and Pi deficiency in Arabi-dopsis roots and the biological processes that the genes are involved in. Gene clustering and root-specific co-expression analysis revealed several potentially impor-tant genes, including CYP82C4 and AT5G38820, which likely function as putative novel players in response to Fe and Pi deficiency or in cross-talk between Fe-deficient responses and Pi-deficient signaling. These results imply that Pi deficiency has more pronounced effects on Fe homeostasis than Fe deficiency has on Pi homeostasis.
Materials and methods
Plant growth and treatments
Arabidopsis (Arabidopsis thaliana) seeds from the Columbia ecotype obtained from the Arabidopsis Bio-logical Resource Center (ABRC) were used in this study. Phr1 mutant seeds (SALK_067629C) were a gift from Professor Tzyy-Jen Chiou as previously described [64]. Seeds were surface sterilized by immersion in 5 % (v/v) NaOCl for 5 min and 70 % ethanol for 7 min, followed by four rinses in sterile water. Seeds were placed into Petri dishes and stored for 1 day at 4 °C in the dark. Plates were then transferred to a growth chamber and grown at
21 °C under continuous illumination (50 µmol m−2 s−1;
Philips TL lamps). The agar-based medium [65] was composed of (mM): KNO3 (5), MgSO4 (2), Ca(NO3)2
(2), KH2PO4 (2.5); (µM): H3BO3 (70), MnCl2 (14), ZnSO4
(1), CuSO4 (0.5), NaCl (10), Na2MoO4 (0.2); and 40 µM
Fe-EDTA solidified with 0.8 % agar (Sigma-Aldrich). Sucrose (43 mM) and 4.7 mM MES were included, and the pH was adjusted to 5.8. After 10 d of precultivation, plants were transferred either to fresh agar medium with 100 µM 3-(2-pyridyl)-5,6-diphenyl-1,2,4-triazine sul-fonate without Fe, medium without Pi, medium without both Fe and Pi, medium without Pi containing 5 µm Fe or fresh control medium and grown for another 3 d. Lower potassium concentrations due to the absence of KH2PO4
in the Pi-free medium was corrected by addition of KCl.
Quantitative reverse transcription‑PCR
Total RNA was isolated using the RNeasy Plant Mini Kit (Qiagen) and treated with DNase using the TURBO DNA-free Kit (Ambion) as suggested by the manufac-turer. cDNA was synthesized and qPCR was performed according to a previous report [40] using the SYBR Green PCR Master Mix (Applied Biosystems) with programs recommended by the manufacturer in the ABI Prism 7500 Sequence Detection System (Applied Biosystems). The melting temperature of the primers ranged from 58 to 62 °C. Primer pairs were selected using Primer3 (http://primer3.sourceforge.net/). Elongation factor1-β2 (At5g19510) and Tubulin3 (At5g19770) were used as internal controls (transcript abundance of both genes did not change under Fe and Pi deficiency) for transcript normalization. The primers used in this study are listed in Additional file 10. Three independent replicates were performed for each sample. The delta threshold cycle (∆ct = the ct of a gene−the ct of the reference) was used to determine the relative amount of gene expression. Stu-dent’s t test (P < 0.05) was used to compare differences between samples grown under treatment and control conditions.
Data collection and processing
described [41] and were used as a database for co-expres-sion analysis.
Gene ontology analysis
The gene ontology browsing utility (GOBU) [66] was adopted for gene ontology (GO) enrichment analysis using the TopGo ‘elim’ method [67]. The elim algorithm iteratively removes the genes mapped to significant terms from higher level GO terms, thus avoiding enrichment of unimportant functional categories.
Generation of co‑expression networks using the MACCU toolbox
Gene functional networks were constructed based on 300 publicly available root-related microarrays using the MACCU toolbox [41], with a Pearson correlation thresh-old of 0.7. The generated co-expression networks were visualized by Cytoscape (http://www.cytoscape.org). If one cluster of genes did not have any connection (edges) to any other cluster in the co-expression network, it was referred to as a module.
Additional files
Additional file 1. Subset of 579 overlapping genes between phosphate-deficiency regulated and iron-phosphate-deficiency regulated in the Arabidopsis roots (P < 0.05). The fold change of the gene expression was indicated as mean with standard deviation (SD).
Additional file 2. Hierarchical cluster analysis of 579 overlapping genes with greater than twofold changes in transcript abundance in Arabidopsis roots grown under Fe- or Pi-deficient conditions.
Additional file 3. Gene Ontology enrichment was assessed using GOBU (Lin et al. [66]) in the 579 overlapping genes (elim, P < 0.01). In the term type column, P, F and C indicate biological process, functional process and subcellular localization, respectively.
Additional file 4. Representative Gene Ontology categories (in biological process) enriched in the 137 overlapping genes with twofold change in expression.
Additional file 5. Co-expression relationships of the 579 differentially expressed overlapping genes.
Additional file 6. Subset of 210 overlapping genes consists of the larg-est co-expression module. The fold change of the gene expression was indicated as mean with standard deviation (SD).
Additional file 7. Gene ontology enrichment was assessed using GOBU (Lin et al. [66]) in the 210 overlapping genes comprising the largest model in Figure S2 (elim, P < 0.01). In the term type column, P, F and C indicate biological process, functional process and subcellular localization, respectively.
Additional file 8. Co-expression relationships of the 97 differentially expressed overlapping genes induced by Pi starvation but repressed by Fe deficiency.
Additional file 9. Subset of 35 overlapping genes induced by iron deficiency with fold change more than 1.5-fold but down-regulated by Pi starvation the Arabidopsis roots (P < 0.05). The fold change of the gene expression was indicated as mean with standard deviation (SD).
Additional file 10. Primers used in this study.
Authors’ contributions
WL and PL performed the data analysis and drafted the manuscript. PL con-ceived the study. Both authors read and approved the final manuscript.
Author details
1 Collaborative Innovation Center of Sustainable Forestry in Southern China
of Jiangsu Province, College of Biology and the Environment, Nanjing Forestry University, Nanjing 210037, People’s Republic of China. 2 State Key Laboratory of Soil and Sustainable Agriculture, Institute of Soil Science, Chinese Academy of Sciences, Nanjing 210008, People’s Republic of China.
Acknowledgements
This work was supported by the Strategic Priority Research Program of the Chinese Academy of Sciences (Grant No. XDB15030103), the National Key Basic Research Program of China (No. 2015CB150501), the Natural Science Foundation of China (31470346, 31370280) and the Project Funded by the Priority Academic Program Development of Jiangsu Higher Education Institu-tions (PAPD).
Compliance with ethical guidelines
Competing interests
The authors declare that they have no competing interests.
Received: 9 September 2015 Accepted: 23 September 2015
References
1. Kobayashi T, Nishizawa NK. Iron uptake, translocation, and regulation in higher plants. Annu Rev Plant Biol. 2012;63:131–52.
2. Lopez-Millan AF, Grusak MA, Abadia A, Abadia J. Iron deficiency in plants: an insight from proteomic approaches. Front Plant Sci. 2013;4:254. 3. Samira R, Stallmann A, Massenburg LN, Long TA. Ironing out the issues:
integrated approaches to understanding iron homeostasis in plants. Plant Sci Int J Exp Plant Biol. 2013;210:250–9.
4. Brumbarova T, Bauer P, Ivanov R. Molecular mechanisms governing Arabi-dopsis iron uptake. Trends Plant Sci. 2014;20:124–33.
5. Briat J, Dubos C, Gaymard F. Iron nutrition, biomass production, and plant product quality. Trends Plant Sci. 2015;20(1):33–40.
6. Ivanov R, Brumbarova T, Bauer P. Fitting into the harsh reality: regula-tion of iron-deficiency responses in dicotyledonous plants. Mol Plant. 2012;5(1):27–42.
7. Rellan-Alvarez R, El-Jendoubi H, Wohlgemuth G, Abadia A, Fiehn O, Abadia J, Alvarez-Fernandez A. Metabolite profile changes in xylem sap and leaf extracts of strategy I plants in response to iron deficiency and resupply. Front Plant Sci. 2011;2:66.
8. Jeong J, Guerinot ML. Homing in on iron homeostasis in plants. Trends Plant Sci. 2009;14(5):280–5.
9. Hindt MN, Guerinot ML. Getting a sense for signals: regula-tion of the plant iron deficiency response. Biochim Biophys Acta. 2012;1823(9):1521–30.
10. Romheld V, Marschner H. Evidence for a specific uptake system for iron phytosiderophores in roots of grasses. Plant Physiol. 1986;80(1):175–80. 11. Santi S, Schmidt W. Dissecting iron deficiency-induced proton extrusion
in Arabidopsis roots. New Phytol. 2009;183(4):1072–84.
12. Robinson NJ, Procter CM, Connolly EL, Guerinot ML. A ferric-chelate reductase for iron uptake from soils. Nature. 1999;397(6721):694–7. 13. Eide D, Broderius M, Fett J, Guerinot ML. A novel iron-regulated metal
transporter from plants identified by functional expression in yeast. Proc Natl Acad Sci USA. 1996;93(11):5624–8.
14. Colangelo EP, Guerinot ML. The essential basic helix-loop-helix protein FIT1 is required for the iron deficiency response. Plant Cell. 2004;16(12):3400–12.
16. Long TA, Tsukagoshi H, Busch W, Lahner B, Salt DE, Benfey PN. The bHLH transcription factor POPEYE regulates response to iron deficiency in Arabidopsis roots. Plant Cell. 2010;22(7):2219–36.
17. Schmidt W, Buckhout TJ. A hitchhiker’s guide to the Arabidopsis ferrome. Plant Physiol Biochem PPB/Soc Fr de Physiol Veg. 2011;49(5):462–70. 18. Vert G, Grotz N, Dedaldechamp F, Gaymard F, Guerinot ML, Briat JF, Curie
C. IRT1, an Arabidopsis transporter essential for iron uptake from the soil and for plant growth. Plant Cell. 2002;14(6):1223–33.
19. Yuan Y, Wu H, Wang N, Li J, Zhao W, Du J, Wang D, Ling HQ. FIT interacts with AtbHLH38 and AtbHLH39 in regulating iron uptake gene expression for iron homeostasis in Arabidopsis. Cell Res. 2008;18(3):385–97. 20. Wang N, Cui Y, Liu Y, Fan H, Du J, Huang Z, Yuan Y, Wu H, Ling HQ.
Require-ment and functional redundancy of Ib subgroup bHLH proteins for iron deficiency responses and uptake in Arabidopsis thaliana. Mol Plant. 2013;6(2):503–13.
21. Sivitz AB, Hermand V, Curie C, Vert G. Arabidopsis bHLH100 and bHLH101 control iron homeostasis via a FIT-independent pathway. PLoS One. 2012;7(9):e44843.
22. Vert GA, Briat JF, Curie C. Dual regulation of the Arabidopsis high-affinity root iron uptake system by local and long-distance signals. Plant Physiol. 2003;132(2):796–804.
23. Giehl RF, Lima JE, von Wiren N. Localized iron supply triggers lateral root elongation in Arabidopsis by altering the AUX1-mediated auxin distribu-tion. Plant Cell. 2012;24(1):33–49.
24. Rogers EE, Guerinot ML. FRD3, a member of the multidrug and toxin efflux family, controls iron deficiency responses in Arabidopsis. Plant Cell. 2002;14(8):1787–99.
25. Durrett TP, Gassmann W, Rogers EE. The FRD3-mediated efflux of citrate into the root vasculature is necessary for efficient iron translocation. Plant Physiol. 2007;144(1):197–205.
26. Stacey MG, Patel A, McClain WE, Mathieu M, Remley M, Rogers EE, Gassmann W, Blevins DG, Stacey G. The Arabidopsis AtOPT3 protein func-tions in metal homeostasis and movement of iron to developing seeds. Plant Physiol. 2008;146(2):589–601.
27. Schuler M, Rellan-Alvarez R, Fink-Straube C, Abadia J, Bauer P. Nicotian-amine functions in the phloem-based transport of iron to sink organs, in pollen development and pollen tube growth in Arabidopsis. Plant Cell. 2012;24:2380–400.
28. Grusak MA, Welch RM, Kochian LV. Physiological characterization of a sin-gle-gene mutant of pisum sativum exhibiting excess iron accumulation: I. Root iron reduction and iron uptake. Plant Physiol. 1990;93(3):976–81. 29. Grusak MA, Pezeshgi S. Shoot-to-root signal transmission regulates
root Fe(III) reductase activity in the dgl mutant of pea. Plant Physiol. 1996;110(1):329–34.
30. Kneen BE, Larue TA, Welch RM, Weeden NF. Pleiotropic effects of brz: a muta-tion in Pisum sativum (L.) cv; sparkle’ conditioning decreased nodulation and increased iron uptake and leaf necrosis. Plant Physiol. 1990;93(2):717–22. 31. Becker R, Grun M, Scholz G. Nicotianamine and the distribution of iron
into the apoplasm and symplasm of tomato (Lycopersicon esculentum Mill.): I. Determination of the apoplasmic and symplasmic iron pools in roots and leaves of the cultivar Bonner Beste and its nicotianamine-less mutant chloronerva. Planta. 1992;187(1):48–52.
32. Lei M, Liu Y, Zhang B, Zhao Y, Wang X, Zhou Y, Raghothama KG, Liu D. Genetic and genomic evidence that sucrose is a global regulator of plant responses to phosphate starvation in Arabidopsis. Plant Physiol. 2011;156(3):1116–30.
33. Misson J, Raghothama KG, Jain A, Jouhet J, Block MA, Bligny R, Ortet P, Creff A, Somerville S, Rolland N, et al. A genome-wide transcriptional analysis using Arabidopsis thaliana Affymetrix gene chips determined plant responses to phosphate deprivation. Proc Natl Acad Sci USA. 2005;102(33):11934–9.
34. Secco D, Jabnoune M, Walker H, Shou H, Wu P, Poirier Y, Whelan J. Spatio-temporal transcript profiling of rice roots and shoots in response to phosphate starvation and recovery. Plant Cell. 2013;25(11):4285–304. 35. Thibaud MC, Arrighi JF, Bayle V, Chiarenza S, Creff A, Bustos R, Paz-Ares
J, Poirier Y, Nussaume L. Dissection of local and systemic transcriptional responses to phosphate starvation in Arabidopsis. Plant J Cell Mol Biol. 2010;64(5):775–89.
36. Lan P, Li W, Schmidt W. Complementary proteome and transcriptome profiling in phosphate-deficient Arabidopsis roots reveals multiple levels of gene regulation. Mol Cell Proteom MCP. 2012;11(11):1156–66.
37. Bournier M, Tissot N, Mari S, Boucherez J, Lacombe E, Briat JF, Gaymard F. Arabidopsis ferritin 1 (AtFer1) gene regulation by the phosphate starvation response 1 (AtPHR1) transcription factor reveals a direct molecular link between iron and phosphate homeostasis. J Biol Chem. 2013;288(31):22670–80.
38. Hirsch J, Marin E, Floriani M, Chiarenza S, Richaud P, Nussaume L, Thibaud MC. Phosphate deficiency promotes modification of iron distribution in Arabidopsis plants. Biochimie. 2006;88(11):1767–71.
39. Ward JT, Lahner B, Yakubova E, Salt DE, Raghothama KG. The effect of iron on the primary root elongation of Arabidopsis during phosphate deficiency. Plant Physiol. 2008;147(3):1181–91.
40. Li W, Lin WD, Ray P, Lan P, Schmidt W. Genome-wide detection of condition-sensitive alternative splicing in Arabidopsis roots. Plant Physiol. 2013;162(3):1750–63.
41. Lin WD, Liao YY, Yang TJ, Pan CY, Buckhout TJ, Schmidt W. Coexpres-sion-based clustering of Arabidopsis root genes predicts functional modules in early phosphate deficiency signaling. Plant Physiol. 2011;155(3):1383–402.
42. Lan P, Li W, Schmidt W. Genome-wide co-expression analysis predicts protein kinases as important regulators of phosphate deficiency-induced root hair remodeling in Arabidopsis. BMC Genom. 2013;14:210. 43. Wang J, Lan P, Gao H, Zheng L, Li W, Schmidt W. Expression changes of
ribosomal proteins in phosphate- and iron-deficient Arabidopsis roots predict stress-specific alterations in ribosome composition. BMC Genom. 2013;14:783.
44. Lan P, Li W, Schmidt W. A digital compendium of genes mediating the reversible phosphorylation of proteins in fe-deficient Arabidopsis roots. Front Plant Sci. 2013;4:173.
45. Rubio V, Linhares F, Solano R, Martin AC, Iglesias J, Leyva A, Paz-Ares J. A conserved MYB transcription factor involved in phosphate starvation signaling both in vascular plants and in unicellular algae. Genes Dev. 2001;15(16):2122–33.
46. Liu TY, Aung K, Tseng CY, Chang TY, Chen YS, Chiou TJ. Vacuolar Ca2+/ H+ transport activity is required for systemic phosphate homeosta-sis involving shoot-to-root signaling in Arabidophomeosta-sis. Plant Physiol. 2011;156(3):1176–89.
47. Puga MI, Mateos I, Charukesi R, Wang Z, Franco-Zorrilla JM, de Lorenzo L, Irigoyen ML, Masiero S, Bustos R, Rodriguez J, et al. SPX1 is a phosphate-dependent inhibitor of PHOSPHATE STARVATION RESPONSE 1 in Arabi-dopsis. Proc Natl Acad Sci USA. 2014;111(41):14947–52.
48. Zamboni A, Zanin L, Tomasi N, Pezzotti M, Pinton R, Varanini Z, Cesco S. Genome-wide microarray analysis of tomato roots showed defined responses to iron deficiency. BMC Genom. 2012;13:101.
49. Urzica EI, Casero D, Yamasaki H, Hsieh SI, Adler LN, Karpowicz SJ, Blaby-Haas CE, Clarke SG, Loo JA, Pellegrini M, et al. Systems and trans-system level analysis identifies conserved iron deficiency responses in the plant lineage. Plant Cell. 2012;24(10):3921–48.
50. Lan P, Li W, Wen TN, Schmidt W. Quantitative phosphopro-teome profiling of iron-deficient Arabidopsis roots. Plant Physiol. 2012;159(1):403–17.
51. Lan P, Li W, Wen TN, Shiau JY, Wu YC, Lin W, Schmidt W. iTRAQ protein profile analysis of Arabidopsis roots reveals new aspects critical for iron homeostasis. Plant Physiol. 2011;155(2):821–34.
52. Bauer P, Blondet E. Transcriptome analysis of ein3 eil1 mutants in response to iron deficiency. Plant Signal Behav. 2011;6(11):1669–71. 53. Yang TJ, Lin WD, Schmidt W. Transcriptional profiling of the Arabidopsis
iron deficiency response reveals conserved transition metal homeostasis networks. Plant Physiol. 2010;152(4):2130–41.
54. Buckhout TJ, Yang TJ, Schmidt W. Early iron-deficiency-induced transcrip-tional changes in Arabidopsis roots as revealed by microarray analyses. BMC Genom. 2009;10:147.
55. Dinneny JR, Long TA, Wang JY, Jung JW, Mace D, Pointer S, Barron C, Brady SM, Schiefelbein J, Benfey PN. Cell identity mediates the response of Arabidopsis roots to abiotic stress. Science (New York, NY). 2008;320(5878):942–5.
56. Wang YH, Garvin DF, Kochian LV. Rapid induction of regulatory and trans-porter genes in response to phosphorus, potassium, and iron deficiencies in tomato roots. Evidence for cross talk and root/rhizosphere-mediated signals. Plant Physiol. 2002;130(3):1361–70.
58. Zheng L, Huang F, Narsai R, Wu J, Giraud E, He F, Cheng L, Wang F, Wu P, Whelan J, et al. Physiological and transcriptome analysis of iron and phos-phorus interaction in rice seedlings. Plant Physiol. 2009;151(1):262–74. 59. Perea-Garcia A, Garcia-Molina A, Andres-Colas N, Vera-Sirera F,
Perez-Amador MA, Puig S, Penarrubia L. Arabidopsis copper transport protein COPT2 participates in the cross talk between iron deficiency responses and low-phosphate signaling. Plant Physiol. 2013;162(1):180–94. 60. Lelandais-Briere C, Jovanovic M, Torres GA, Perrin Y, Lemoine R,
Corre-Menguy F, Hartmann C. Disruption of AtOCT1, an organic cation trans-porter gene, affects root development and carnitine-related responses in Arabidopsis. Plant J Cell Mol Biol. 2007;51(2):154–64.
61. Eisen MB, Spellman PT, Brown PO, Botstein D. Cluster analysis and display of genome-wide expression patterns. Proc Natl Acad Sci USA. 1998;95(25):14863–8.
62. Usadel B, Obayashi T, Mutwil M, Giorgi FM, Bassel GW, Tanimoto M, Chow A, Steinhauser D, Persson S, Provart NJ. Co-expression tools for plant biology: opportunities for hypothesis generation and caveats. Plant Cell Environ. 2009;32(12):1633–51.
63. Aoki K, Ogata Y, Shibata D. Approaches for extracting practical informa-tion from gene co-expression networks in plant biology. Plant Cell Physiol. 2007;48(3):381–90.
64. Kuo HF, Chang TY, Chiang SF, Wang WD, Charng YY, Chiou TJ. Arabidopsis inositol pentakisphosphate 2-kinase, AtIPK1, is required for growth and modulates phosphate homeostasis at the transcriptional level. Plant J Cell Mol Biol. 2014;80(3):503–15.
65. Estelle MA, Somerville C. Auxin-resistant mutants of Arabidopsis thaliana with an altered morphology. Mol Gen Genet. 1987;206(2):200–6. 66. Lin W-D, Chen Y-C, Ho J-M, Hsiao C-D. GOBU: toward an integration
interface for biological objects. J Inf Sci Eng. 2006;22(1):19. 67. Alexa A, Rahnenfuhrer J, Lengauer T. Improved scoring of functional
groups from gene expression data by decorrelating GO graph structure. Bioinformatics (Oxford, England). 2006;22(13):1600–07.
Submit your next manuscript to BioMed Central and take full advantage of:
• Convenient online submission • Thorough peer review
• No space constraints or color figure charges • Immediate publication on acceptance
• Inclusion in PubMed, CAS, Scopus and Google Scholar • Research which is freely available for redistribution