R E S E A R C H A R T I C L E
Open Access
Mammographically dense human breast
tissue stimulates MCF10DCIS.com
progression to invasive lesions and
metastasis
Cecilia W. Huo
1, Mark Waltham
1,2, Christine Khoo
3, Stephen B. Fox
3,4,5, Prue Hill
6, Shou Chen
6, Grace L. Chew
1,7,
John T. Price
8,9,10, Chau H. Nguyen
8, Elizabeth D. Williams
11,12,13, Michael Henderson
1,14, Erik W. Thompson
1,2,11,12*†and Kara L. Britt
5,15,16†Abstract
Background:
High mammographic density (HMD) not only confers a significantly increased risk of breast cancer
(BC) but also is associated with BCs of more advanced stages. However, it is unclear whether BC progression and
metastasis are stimulated by HMD. We investigated whether patient-derived HMD breast tissue could stimulate the
progression of MCF10DCIS.com cells compared with patient-matched low mammographic density (LMD) tissue.
Methods:
Sterile breast specimens were obtained immediately after prophylactic mastectomy from high-risk
women (
n
= 10). HMD and LMD regions of each specimen were resected under radiological guidance. Human
MCF10DCIS.com cells, a model of ductal carcinoma in situ (DCIS), were implanted into silicone biochambers in the
groins of severe combined immunodeficiency mice, either alone or with matched LMD or HMD tissue (1:1), and
maintained for 6 weeks. We assessed biochamber weight as a measure of primary tumour growth, histological
grade of the biochamber material, circulating tumour cells and metastatic burden by luciferase and histology. All
statistical tests were two-sided.
Results:
HMD breast tissue led to increased primary tumour take, increased biochamber weight and increased
proportions of high-grade DCIS and grade 3 invasive BCs compared with LMD. This correlated with an increased
metastatic burden in the mice co-implanted with HMD tissue.
Conclusions:
Our study is the first to explore the direct effect of HMD and LMD human breast tissue on the
progression and dissemination of BC cells in vivo. The results suggest that HMD status should be a consideration in
decision-making for management of patients with DCIS lesions.
Keywords:
Breast cancer, MCF10DCIS.com, Mammographic density, Murine biochamber
* Correspondence:e2.thompson@qut.edu.au †Equal contributors
1Department of Surgery, University of Melbourne, St Vincent’s Hospital,
Melbourne, VIC 3156, Australia
2St Vincent’s Institute of Medical Research, Melbourne, VIC 3156, Australia
Full list of author information is available at the end of the article
Background
Mammographic density
(MD) refers to the radio-opaque
tissue on a mammogram. High mammographic density
(HMD) is associated with a higher rate of breast cancer
(BC). Indeed, women in the highest MD quartile have a
four to six times increased risk of BC compared with the
lowest quartile after adjustment for age and body mass
index (BMI), a relative risk that is second only to
BRCA1/2
gene mutation [1, 2]. It is not clear why HMD
is associated with this increased BC risk, although
re-duced MD has been associated with response to
hor-mone therapy in both prevention and treatment settings,
as reviewed by Huo et al. [3, 4]. HMD is not uncommon;
42 % of women in the 40- to 59-year-old age group and
25 % of women in the 60- to 79-year-old age group have
breasts that are at least 50 % mammographically dense [5].
Ursin and colleagues retrospectively assessed
mammo-grams taken prior to and at the time of ductal carcinoma
in situ (DCIS) diagnosis. They found that DCIS lesions
occurred primarily in areas of HMD, suggesting that
MD may stimulate BC initiation [6]. BCs that arise
within areas of HMD are more commonly associated
with factors indicative of a poor prognosis, including
large tumour size, high histological grade,
lymphovascu-lar invasion and advanced stage, as compared with those
arising within low mammographic density (LMD) [7
–
9].
It is not clear whether HMD increases the risk of
metas-tasis. Two studies have shown that HMD is associated
with an increased rate of local recurrence after
breast-conserving surgery, but not with distant recurrence
[10, 11]. We found that cytokeratin (CK)-positive
tumour cells in HMD connective tissue are associated
with local recurrence but not with distant metastasis
[12]. Also, we discovered that collagen matrices
repre-senting concentrations of HMD seen in ductal
carcin-oma tissues induced increased BC cell migration
compared with LMD tissue [13]. Increased stromal
collagen in mouse mammary tissue was also shown to
result in more invasive tumour phenotypes [14].
In order to assess whether HMD has any causal
rela-tionship with BC risk, we developed a biochamber
mouse model that can viably grow and maintain the MD
differential of normal breast tissue [15]. In the present
study, we used it to determine whether HMD could
stimulate the progression of DCIS-like lesions.
Methods
Sample accrual
This study was approved by the Peter MacCallum Human
Research Ethics Committee (08/21) and St Vincent
’
s
Hospital Melbourne Animal Ethics Committee (09/14).
Between 2014 and 2015, ten women undergoing
prophylac-tic mastectomy at St Vincent
’
s Hospital Melbourne
pro-vided consent through the Victorian Cancer Biobank. All
participants gave their written informed consent for tissue
accrual and publication of the study results. These women
underwent the prophylactic procedure because of
con-firmed gene mutation carrier status and/or a strong family
or past history of BC. Women were excluded from the
study if suspicious lesions were visualised by pre-operative
imaging.
Tissue handling and selection of high and low
mammographic density regions
Tissue sampling was carried out as previously described
[15
–
18]. In brief, immediately after mastectomy, a 1-cm
slice of breast tissue was resected from the fresh
mastec-tomy specimen in a sterile environment by breast
pa-thologists. HMD and LMD regions of the tissue slice
were identified by examining specimen radiograms.
Se-lected HMD and LMD tissues were then separately
minced with a scalpel and mixed 1:1 with BD Matrigel
™
(BD Biosciences, Billerica, MA, USA) supplemented with
basic fibroblast growth factor (1
μ
g/ml; Sigma-Aldrich,
Sydney, Australia) using sterile technique [16].
Preparation for in vivo monitoring of MCF10DCIS.com cells
MCF10DCIS.com (DCIS.com) cells were provided by
Robert J. Pauley, Barbara Ann Karmanos Cancer Institute,
Detroit, MI, USA [19]. Luciferase/mCherry tagging
[20] of DCIS.com cells is described in Additional file 1:
Supplementary Methods. Cells were maintained in
DMEM/F-12 medium (1:1) supplemented with 5 % horse
serum and 4 mM glutamine [21, 22] in a humidified
incubator (37 °C/5 % CO
2). The top 10 % of
mCherry-expressing cells were selected using flow cytometry and
propagated in vitro for a maximum of two passages in
preparation for murine chamber implantation, with or
without fresh human mammary tissue.
Murine xenograft model and ex vivo analysis of tumour
burden using bioluminescence
For all experiments, mouse care was carried out in
accord-ance with St Vincent
’
s Animal Ethics Committee guidelines.
Patient-paired HMD or LMD breast tissue was mixed with
1 × 10
5DCIS.com cells and then suspended in Matrigel
™
be-fore being placed in the silicone chamber in the right groin
of 6 week-old female severe combined immunodeficiency
mice (
n
= 4 for HMD/woman, 4 for LMD/woman, 40
μ
l per
chamber) vascularised by the inferior epigastric pedicle, as
described previously [15, 17, 18]. As controls, 1 × 10
5DCIS.-com cells were also inserted into biochambers with
Matri-gel
™
without prior mixing with any human breast tissue in
four separate mice each time a patient sample was processed
(i.e.,
n
= 4/woman) (see Additional file 2: Figure S1).
placed under anaesthesia using inhaled isoflurane, had
blood drawn via cardiac puncture and then were humanely
killed after 10 minutes. Biochamber material and mouse
organs were removed and imaged ex vivo. Further details
on luciferase and mCherry/red fluorescent protein (RFP)
imaging are provided in Additional file 1: Supplementary
Methods. Following imaging, the harvested materials were
immediately fixed in 10 % neutral buffered formalin for
24 h before being transferred to 70 % ethanol for storage.
Samples were subsequently processed, embedded in
paraf-fin and sectioned at 5-
μ
m thickness for histological and
immunohistochemical analyses.
Circulating tumour cell processing and quantification
Mouse blood was processed with red blood cell lysis
buf-fer and PBS to remove serum and bulk erythrocytes.
Further details on circulating tumour cell (CTC)
pro-cessing are provided in Additional file 1: Supplementary
Methods. The resulting pellets were then mixed with
500
μ
l of DCIS.com cell culture medium, and 400
μ
l of the
suspension were plated in 60 × 15-mm cell culture dishes
(CELLSTAR®; Greiner Bio-One GmbH, Frickenhausen,
Germany) along with additional 1.5 ml of DCIS.com
cul-ture medium. This mixcul-ture was maintained in culcul-ture for
7 days. Plates were washed with PBS prior to crystal violet
staining and inspection for mCherry-positive CTCs. Blood
from naïve mice (
n
= 7) was also collected, processed and
cultured as a negative control. Fluorescence microscopy
was performed (Zeiss Axio Vert.A1; Carl Zeiss
Micros-copy, Thornwood, NY, USA) to identify mCherry-tagged
DCIS.com cells. A bright-field Leica DFC425 microscope
(Leica Microsystems, Buffalo Grove, IL, USA) was then
used to image four random areas of each plate at × 20
magnification for manual counting and comparison of
CTCs. CTCs were identified using bright field microscopy
on the basis of their size and morphology that were
evident under the fluorescence microscope.
Assessment of harvested chamber tissue
Haematoxylin and eosin (H&E) staining was performed
with all biochamber explants (harvested chamber tissue)
and organ specimens in which positive luciferase and
fluorescent signals were detected. A consultant
patholo-gist (CK) who was blinded to the experimental groups
assessed the H&E-stained slides of all chamber explants
to determine the presence or absence of DCIS and
inva-sive ductal carcinoma (IDC). Invainva-sive carcinomas, when
present, were scored for glandular differentiation,
nu-clear pleomorphism and mitotic count using the
Not-tingham grading system [23, 24].
Immunohistochemical staining
The presence of DCIS versus IDC was further confirmed
on representative slides with myoepithelial marker
human-specific p63 immunohistochemical nuclear staining (Dako
M7247, clone 4A4; Dako, Carpinteria, CA, USA) [25, 26].
Numerical categories were assigned to the histological
results for comparisons among the three groups. These
details are given in Additional file 1: Supplementary
Methods. Tissue sections were photographed at × 10
and × 20 magnification using an AxioVision microscope
(Carl Zeiss Microscopy).
To confirm metastases in luciferase-positive organs that
did not show clear evidence of cancer on H&E stains, we
sectioned the entire paraffin tissue block and stained
con-secutive sections with human-specific antibodies against
cytokeratin 5 (CK5) (NCL-CK5, clone XM26; Leica
Bio-systems, Buffalo Grove, IL, USA) [27, 28] and DNA repair
protein Ku70 (ab58150; Abcam, Cambridge, MA, USA)
[29, 30]. Details regarding Ku70 and CK5 staining are
provided in Additional file 1: Supplementary Methods.
Statistical analyses
For each of the ten women, four mice were used for
each of the DCIS.com + HMD, DCIS.com + LMD and
DCIS.com-only groups. The mean value of all four mice
from each experimental group was calculated and used as
a representative value for that woman. HMD + DCIS.com,
LMD + DCIS.com, and DCIS.only groups were
com-pared using patient-matched (paired) one-way analysis of
variance and Tukey
’
s multiple comparisons test using
GraphPad Prism® version 6.00 for Windows software
(GraphPad Software, La Jolla, CA, USA). Prior to all
ana-lyses, normality tests were used to confirm whether
para-metric tests were appropriate. The Grubbs test was used
to detect any significant outliers for each set of data before
it was analysed. All statistical tests were two-sided. Error
bars in all graphs indicate SEM, and a
P
value <0.05 was
considered to be statistically significant.
Results
Demographic characteristics of study participants
Our cohort of mammary tissue donors comprised a group
of pre-menopausal and post-menopausal women with a
mean age of 45 years. Six of them had confirmed gene
mutation carrier status. The other four women underwent
prophylactic mastectomy because of a significant past or
family history of BC. Breast Imaging-Reporting and Data
System (BI-RADS) scores ranged from 1 to 4 across the
cohort. The demographic characteristics of the cohort are
summarised in Table 1.
Analyses of weights and histopathology of chamber
explant materials
groups (Fig. 1). Biochamber weights from the HMD +
DCIS.com group were significantly greater than those in
the LMD + DCIS.com group (
P
= 0.002), but they were not
significantly greater than those in the DCIS.com-only
group. Explant weights from the LMD + DCIS.com group
tended to be less than those in the DCIS.com-only group,
but this difference was not statistically significant (Fig. 1).
The histology of the biochamber materials contained
benign mammary tissue, high-grade DCIS lesions only
or high-grade DCIS with grade 3 IDC (Fig. 2a
–
d). p63
staining showed that the myoepithelial layer remained
intact in normal mammary ducts as well as in DCIS
le-sions; however, this integrity was lost in IDC, despite
tumour cells staining positive with p63 because of their
basal phenotype (see Additional file 3: Figure S2). The
percentage of high-grade DCIS with grade 3 IDC in the
HMD + DCIS.com group was higher than in both the
DCIS.com-only and LMD + DCIS.com groups for nine
of ten women (Fig. 2e). When we compared the mean
values of all ten women, we observed that the HMD +
DCIS.com group had a significantly higher proportion of
high-grade DCIS and grade 3 IDC than the other groups
(Fig. 2f ). In the presence of LMD tissue, the resulting
percentage of high-grade DCIS and grade 3 IDC was
often lower than in the DCIS.com-only group; however,
this trend was not statistically significant.
Luciferase signal and tumour burden
Both luciferase and mCherry images were collected for
the first three accruals, and the results were comparable
(Additional file 4: Figure S3). Hence, only
biolumines-cence images were used for analyses thereafter. HMD +
DCIS.com biochambers showed significantly higher
bioluminescent signalling than the LMD + DCIS.com
group (
P
= 0.005). Interestingly, the LMD + DCIS.com
group also showed a significant reduction in
biolumines-cent signalling compared with the DCIS.com-only group
(
P
= 0.03) (Fig. 3).
Comparison of
‘
take
’
rates of MCF10DCIS.com cells in
biochambers
[image:4.595.55.291.108.400.2]For each woman, the
‘
take
’
rate was assessed as the
propor-tion of mice in each experimental sub-group (
n
= 4) that
had a positive DCIS.com presence after 6 weeks as
con-firmed by IVIS in vivo imaging and histology (PerkinElmer,
Table 1
Demographic characteristic of study participants
(n
= 10)
Selected characteristics Number or mean
Age at surgery date Mean 45 years, median 43 years, range 31–64 years
BI-RADS score,n
4 2
3 2
2 4
1 2
Risk factors (some women had more than one risk factor)
Strong family history 6
BRCA1mutation-positive 2
BRCA2mutation-positive 3
PTENmutation-positive 1
Past history of BC or DCIS 7
Menopausal status
Pre-menopausal 5
Peri-menopausal 2
Post-menopausal 3
Parity
Parous 8
Nulliparous 2
Abbreviations: BI-RADSBreast Imaging-Reporting and Data System,BCBreast cancer,IDCInvasive ductal carcinoma,DCISDuctal carcinoma in situ BI-RADS score 1 = predominantly fat, 2 = scattered fibroglandular densities, 3 = heterogeneously dense, 4 = extremely dense
Fig. 1Quantitative analyses of chamber explant weights.aColoured bar graphs show patient-matched DCIS-only (blue), DCIS + HMD (red) and DCIS + LMD (green) comparisons of chamber explant weights for all ten women.bAverage values for each woman are shown as scatterplots.
[image:4.595.57.539.556.684.2]Waltham, MA, USA). The HMD + DCIS.com group was
the only group to have a 100 % take rate, while the DCIS.
com-only and LMD + DCIS.com groups had 82.5 % and
70.0 % take rates, respectively (
n
= 10 women) (Fig. 4).
Comparison of tumour metastasis in DCIS.com + HMD,
DCIS.com + LMD and DCIS.com-only groups
Cancer metastases were detected by ex vivo
biolumines-cence imaging most frequently in axillary lymph nodes
and lungs, and occasionally in the liver and/or bowel.
Areas with positive luciferase signals were dissected and
stained with H&E for histological confirmation of
metas-tasis (Fig. 5a1, a2). Occasionally, small clusters of cancer
cells were visualised by imaging (
arrow
in Fig. 5b1), but
they were not readily identified upon H&E staining. In
those cases, human-specific CK5 and Ku70 staining
con-firmed the presence of tumour cells of human origin
(Fig. 5b1
–
b3).
The number of organs with cancer metastases was
counted per mouse for each group (Fig. 6a). The HMD +
DCIS.com group had significantly higher mean numbers
of metastasis-positive organs than the LMD + DCIS.com
group across all ten women (
P
= 0.0234) (Fig. 6b). The
mean quantities of bioluminescent signalling in
metasta-ses were significantly increased in the HMD + DCIS.com
compared with the LMD + DCIS.com group (
P
= 0.008)
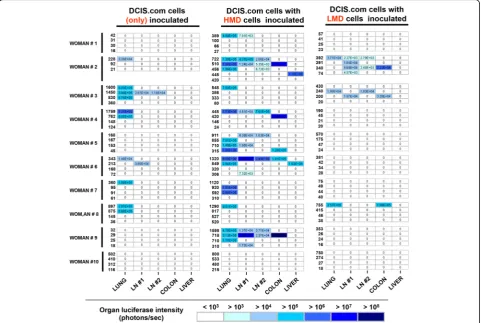
(Fig. 6c and d). As an alternate representation of the data,
the heat map shown in Fig. 7 depicts that mice implanted
with HMD + DCIS.com tissue had higher frequencies and
amounts of distal metastatic burden.
To assess the levels of CTCs, mouse blood was
col-lected from nine of the ten independent experiments
and cultured for 7 days. CTCs of approximately 50
μ
m
in diameter that were mCherry-positive and stained with
crystal violet were detected in the blood samples from
all nine accruals (Fig. 8). By contrast, there were no
simi-larly sized colonies present in cultures generated from
Fig. 2Quantitative analysis of the histopathological results of chamber material.a–dRepresentative photomicrographs of the various numerical categories used to score human breast histopathology observed in biochambers.aCategory 0, the absence of DCIS and cancer and the presence of fatty normal breast tissue.bCategory 0, the absence of DCIS and cancer and the presence of dense normal breast tissue.cCategory 1, high-grade DCIS only.dCategory 2-3, grade 3 invasive carcinoma.eThe numerical histological categories 0–3 included a breakdown of the presence of high-grade DCIS alone or along with a certain percentage of grade 3 IDC. The mean histological category for the chamber explants for each of the ten women according to the type of input material.fAverage values for each woman for the histological category of the chamber material. [image:5.595.57.535.87.407.2]tumour-naïve mice. These cultures also lacked mCherry
signalling and crystal violet staining. The number of CTCs
per mouse was counted and adjusted for the volume of
blood collected. When averaged per patient, the number
of CTCs per millilitre was not significantly increased in
the HMD + DCIS.com group compared with the LMD +
DCIS.com group (
P
= 0.0876) (Fig. 8).
Correlation between participant demographics and
DCIS.com cellular responses
When assessing the chamber responses of patient-matched
HMD + DCIS.com, LMD + DCIS.com and DCIS.com-alone
groups according to individual women
’
s demographic
characteristics (see Additional file 5: Figure S4), we found
that the results from post-menopausal women (patients 3,
4 and 7, all of whom were parous and known to be
gene mutation-negative and had overall non-dense
breasts [BI-RADS scores 2 and 1]) did not differ from
those of pre-menopausal women (
n
= 7) in terms of mean
histological categories and CTCs. However, the mean
cham-ber explant weight, luciferase signalling and metastases from
HMD tissue of patient 3 were all lower than corresponding
parameters of the DCIS.com-alone group, which may have
been due to variations in the DCIS.com cells alone. These
results from patient 7 followed the overall trend of the
HMD group being associated with increased tumour
growth. When we compared the chamber responses from
breast tissues of gene mutation carrier-positive women
(pa-tients 1, 2, 4, 5, 9 and 10) with those of gene
mutation-negative women (patients 3, 6, 7 and 8), and between
women with overall dense breasts (BI-RADS score 3 or 4:
patients 2, 6, 8 and 9) and women with overall non-dense
breasts (BI-RADS score 1 or 2: patients 1, 3, 4, 5, 7 and 10),
we found no significant differences. Furthermore,
nullipar-ous women (patients 8 and 10) did not show a different
trend with regard to chamber outgrowth weights or
histo-logical results. Both women had elevated numbers of CTCs
in their HMD group, although no metastasis was found in
mice for patient 10, and the number of metastasis-positive
organs in the tissue groups of patient 8 was lower than that
of the DCIS.com-alone arm (Additional file 5: Figure S4d
–
f).
Overall, the finding of increased tumour growth and
dissemination associated with the HMD + DCIS.com group
as compared with the other two groups did not differ
signifi-cantly by age, menopausal status, gene mutation carrier
status, overall breast BI-RADS category or parity. Future
studies with larger study cohorts are needed to provide
suffi-cient power for assessing whether the pro-malignant effect
of HMD is modulated by any of the aforementioned factors.
Discussion
In this within-individual matched-sample study, we found
that HMD breast tissue led to significantly increased
tumour weight, greater proportions of high-grade DCIS
and grade 3 IDCs, and metastasis of DCIS.com cells
Fig. 3Analyses of chamber explant luciferase signalling.aLuciferase signal measured in the chambers at explant (×108photons per second) for each of the ten women.bAverage values for each woman are shown as scatterplots after removal of a significant outlier (patient 6).HMDHigh mammographic density,LMDLow mammographic density,DCISMCF10DCIS.com cells. *P= 0.03; **P= 0.005. All bar and scatterplot graphs represent mean ± SEMFig. 4Comparison of chamber‘take’rates representing the viability of input MCF10DCIS.com cells. The average number of positive biochambers (contained a histological category of at least 1: DCIS material only) as a percentage of the total number of chambers implanted.HMDHigh mammographic density,LMDLow mammographic density,DCIS
[image:6.595.57.540.88.213.2] [image:6.595.59.291.524.664.2]compared with LMD tissue from the same woman. The
tumour-promoting effect of HMD was observed across
women, despite the heterogeneous demographic
charac-teristics of our cohort (mixed menopausal statuses and
risk profiles). The finding of high-grade DCIS with grade
3 IDC was consistent with the characteristics of DCIS.com
cells to form high-grade DCIS that progresses to
corres-pondingly high-grade IDC in vivo [22]. To our knowledge,
we are the first to demonstrate a causal relationship
between HMD tissue and BC progression and
metas-tasis in an in vivo setting. We also found a trend of
increased CTCs in mice carrying biochambers
im-planted with HMD tissue compared with LMD and
DCIS.com only; however, this was not statistically
sig-nificant, which may be due to the variation in CTC
numbers per mouse for each woman and between
women, as well as to our small sample size.
There is little evidence on whether HMD directly
af-fects the progression and metastasis of already
estab-lished tumours; however, the pathobiology of HMD does
support stimulated cancer progression [16, 31]. Boyd
and colleagues found that HMD is associated with
in-creased breast tissue stiffness [31], and HMD stroma
has increased collagen organisation compared with
LMD from the same woman [16, 32, 33]. Specifically,
McConnell and colleagues found that increased
colla-gen stiffness and organisation, not abundance,
corre-lated with HMD in a cohort of 22 post-menopausal
women (4 cancer-free and 18 with BC). In their
study, the tissues from 18 women were sampled at
least 4 cm away from tumours, albeit within the same
breasts where cancer had initially arisen, and a total
of 6 HMD samples were compared with 6 LMD
tis-sue specimens of different women matched for age
and menopausal status, but not for BMI or other
confounding factors [32]. Their findings contrast with
our earlier association of HMD with increased stroma
and collagen content [16], where paired HMD breast
tissue showed increased collagen organisation as well
as abundance compared with LMD tissue of the same
woman in a group of 15 cancer-free women. As
McConnell et al. used Picrosirius red staining and
atomic force microscopy, whereas we used second
harmonic generation imaging coupled with grey-level
co-occurrence matrix analysis; variable methodologies
may also contribute to the differences in the results.
Collagen of altered alignment, through mechanical
and other unknown properties, have been shown to
facilitate tumour growth [14, 34, 35]. The breast
stroma is a rich source of numerous cell types,
Fig. 5Representative images of tumour metastasis obtained by imaging and histology.a1anda2Images from the same mouse lymph node.b1–b3Images illustrate the lymph node of a different mouse.a1Thewhite arrowindicates a luciferase (luc) signal in a mouse lymph node.a2
Haematoxylin and eosin staining of the luc-positive lymph node froma1.b1Thewhite arrowindicates a luc signal in a mouse lymph node.b2
[image:7.595.55.537.89.342.2]including
fibroblasts,
adipocytes
and
extracellular
matrix (ECM) proteins [36
–
38]. ECM comprises not
only collagen but also fibronectin, proteoglycans and
matrix metalloproteinase (MMP) inhibitors, which
have also been shown to enhance collagen stiffness
and regulate growth factors and susceptibility to BC
[3, 39
–
43]. Although BC is of epithelial cell origin
and HMD is associated with increased benign
epithe-lial lesions [44, 45], an increasing body of data
sup-ports the hypothesis that perturbations in stromal
architecture are key to establishing a pro-neoplastic
environment that enhances cancer growth [46, 47].
In addition, fibroblasts are a major stromal
compo-nent and have been implicated in pro-malignant
ac-tivity through the production and/or modification of
cytokines, growth factors, ECM components and
MMPs [48, 49].
Our results show that the incorporation of LMD
breast tissue into DCIS.com cell inoculations reduced
tumour weight, lowered the proportion of high-grade
DCIS with grade 3 IDCs and led to less metastasis
compared with incorporating HMD tissue, suggesting
a protective role of the adipose-rich, dense, connective
tissue-poor LMD tissue. Consistent with the trends and
[image:8.595.56.540.86.343.2]effects seen in our studies, the association of absolute
dense area with BC risk was found to be decreased for
lar-ger breasts [50]. Investigators in two large case-control
studies (634 cases:1880 controls [51] and 1424 cases:2660
controls [52]) and a prospective study of 111 cases of BC
[53] all found statistically significant inverse associations
of non-dense breast area with BC risk. There is limited
evidence on how adipose tissue modifies BC risk and
can-cer progression. Fatty breast tissue secretes leptin, which
was found to enhance BC cell proliferation, as well as
adi-ponectin, which limits cell proliferation and promotes
apoptosis of aberrant cells [54]. Whilst it is unknown
whether adipose tissue produces more adiponectin than
leptin, a balance between the two was proposed to alter
BC risk [55]. Adipose tissue also stores vitamin D, known
for its protective effect against cancer development
through a wide range of roles, including cell-cycle arrest,
apoptosis, repair and promotion of differentiation
[56
–
58].
Little is currently known about
cancer-associated adipose tissue, although it is known to secrete a
range of cytokines (interleukin [IL]-6, IL-8, chemokine
[C-C motif] ligand 5) and collagen VI, promoting B[C-C
progression and metastasis [59
–
63]. Further work on
cytokines and ECM from HMD and LMD tissue is
Fig. 6Quantitative analyses of metastases in terms of metastasis-positive organ numbers and luciferase signalling.aColoured bar graphs of the mean value of all four mice for each group for mean metastasis + organ numbers.bAveraged values of the mean number of metastasis-positive organs for each woman according to the type of input material.cColoured bar graphs of the mean level of luciferase in metastasis-positive organs (×105photons/second).dAveraged values of the mean luciferase load in metastasis for each woman.HMDHigh mammographic density,LMDLow mammographic density,DCISMCF10DCIS.com cells. *P= 0.02; **P= 0.008. All bar and scatterplot graphs represent mean ± SEM;triangles
required to understand the relationship of the
de-creased adipose content in HMD and BC.
Strengths and limitations
Previous work conducted by Chew and colleagues
showed that human HMD and LMD breast tissues that
were sampled from prophylactic mastectomy specimens,
mechanically minced, mixed with Matrigel
™
and then
in-cubated in murine biochambers for 6 weeks remained
viable, maintained their original histological
characteris-tics and their MD status [15]. H&E, Masson
’
s trichrome
blue and vimentin staining showed increased collagen
and stromal content and a lower fat percentage in
HMD chamber tissue compared with that in LMD,
correlating with the histological composition of the
original mastectomy specimens. Thus, we believe that
mechanical mincing in preparation for chamber
im-plantation and supplementation with Matrigel
™
did
not have a significant impact on the histological
[image:9.595.58.540.89.412.2]population, in particular for post-menopausal women.
However, studying normal breast tissue of different
MDs enabled us to examine features of MD that may
elevate BC risk prior to established tumour burdens
in the breast. The within-individual study design also
allowed us to compare HMD and LMD breast tissues
of the same patient, eliminating all important
con-founding factors, such as age, BMI and menopausal
status, which can be difficult to adjust for in
across-patient studies.
Conclusions
To the best of our knowledge, this study is the first
to demonstrate the direct effects of HMD and LMD
human breast tissue on the growth and
dissemin-ation of BC cells in vivo. Further studies on stromal
and ECM components will improve understanding of
BC evolution and help to identify potential biological
markers and therapeutic targets for more
individua-lised management of patients with, or at high risk
for, BC. Our data suggest a benefit of including the
Fig. 8CTC analyses.aRepresentative photomicrographs under bright field of CTCs isolated and cultured blood from mice blood.bCorresponding fluorescence image to demonstrate RFP tagging in CTCs.cRepresentative photomicrographs of CTCs after crystal violet staining.
[image:10.595.59.537.88.512.2]MD status in the assessment and therapeutic
man-agement of BC and DCIS.
Additional files
Additional file 1:The murine xenograft model Schematic diagrams illustrate the use of 12 SCID mice associated with each woman’s tissue accrual and the allocation of 4 mice into HMD, LMD and DCIS.com only groups. HMD: high mammographic density; LMD: low mammographic density; DCIS.com: MFC10DCIS.COM cells. (DOCX 16kb)
Additional file 2: Figure S1.The murine xenograft model. Schematic diagrams illustrate the use of 12 SCID mice associated with each patient’s tissue accrual and the allocation of 4 mice into DCIS.com + HMD, DCIS.com + LMD and DCIS.com-only groups. The schematic mouse shows a silicone chamber inserted in the groin with chamber material (ingrey) vascularised by the inferior epigastric pedicle (inred).HMDHigh mammographic density,LMDlow mammographic density,DCIS.com
MFC10DCIS.com cells. (TIF 537 kb)
Additional file 3: Figure S2.p63 immunohistochemical nuclear staining.
aRepresentative photomicrograph of punctate brown nuclear staining with p63 of normal human mammary glands adjacent to invasive tumour cells from a chamber explant at × 10 original magnification.bNormal mammary ducts shown in (a) at × 20 original magnification.cRepresentative photomicrograph of punctate brown nuclear staining with p63 of a ductal carcinoma in situ lesion from a chamber explant at × 10 original
magnification.dDuctal carcinoma in situ lesion shown in (c) at × 20 original magnification.eRepresentative photomicrograph of punctate brown nuclear staining with p63 of invasive ductal carcinoma adjacent to ductal carcinoma in situ lesions at × 10 original magnification.fInvasive ductal carcinoma cells adjacent to ductal carcinoma in situ lesions shown in (e) at × 20 original magnification. (TIF 7517 kb)
Additional file 4: Figure S3.Comparison of luciferase and mCherry imaging.aRepresentative luciferase imaging of three chamber explants.
bRepresentative mCherry imaging of the same chamber explants shown ina. (TIF 2371 kb)
Additional file 5: Figure S4.Correlation between participant demographics and DCIS.com cellular responses. The table outlines the individual demographic characteristics of each patient (n= 10).a
Coloured bar graphs show patient-matched DCIS.com only (blue), DCIS.com + HMD (red) and DCIS.com + LMD (green) comparisons of chamber explant weights (a), chamber explant luciferase signals (b), mean histological category of chamber explants (c), mean number of CTCs/ml (d), mean number of metastasis-positive mouse organs (e) and mean luciferase signals for total metastases (f) for each patient.HMD
high mammographic density,LMDlow mammographic density,DCIS
MCF10DCIS.com cells,CTCcirculating tumour cells,BCbreast cancer, + positive,N/ANot available.Trianglesindicate data value of 0. BI-RADS score 1 = predominantly fat, 2 = scattered fibroglandular densities, 3 = heterogeneously dense, 4 = extremely dense. (PPTX 500 kb)
Abbreviations
BC:Breast cancer; BI-RADS: Breast Imaging-Reporting and Data System; CK: Cytokeratin; CTC: Circulating tumour cell; DCIS: Ductal carcinoma in situ; DCIS.com: MCF10DCIS.com cells; ECM: Extracellular matrix; H&E: Haematoxylin and eosin; HMD: High mammographic density; IDC: Invasive ductal carcinoma; IL: Interleukin; LMD: Low mammographic density; MD: Mammographic density; MMP: Matrix metalloproteinase; RFP: Red fluorescent protein
Acknowledgements
We thank St Vincent’s Experimental Medical and Surgical Unit as well as its BioResources Centre for all animal-related work. We also thank St Vincent’s BreastScreen, St Vincent’s Hospital, for help with radiography and tissue sampling and Victorian Cancer Biobank and St Vincent’s Department of Pathology for assistance with tissue accrual, processing and staining.
Funding
This work was supported in part by the Victorian Breast Cancer Research Consortium, the St Vincent’s Hospital Melbourne Research Endowment Fund,
the National Breast Cancer Foundation and the University of Melbourne Research Grant Support Scheme (MRGSS). CWH was supported by an Australian Postgraduate Award scholarship. GLC was supported by a postgraduate scholarship from the National Health and Medical Research Council. EDW was supported by funding from the Australian Government Department of Health and the Movember Foundation and Prostate Cancer Foundation of Australia through a Movember Revolutionary Team Award. EWT was supported in part by the Australian National Breast Cancer Foundation through the EMPathyNational Collaborative Research Program (CG-10-04). KB was supported by a National Breast Cancer Foundation Early Career Fellowship. The study sponsors had no role in the design of the study; the collection, analysis or interpretation of data; or the writing of the manuscript.
Availability of data and materials
Not applicable.
Authors’contributions
CWH carried out the majority of the experimental work, including collecting processing, embedding and staining tissues; performed data analyses and imaging; and drafted the manuscript. MW performed the ex vivo imaging and analysis of imaging results, and helped to revise the manuscript. CK reviewed all histological results and helped to revise the manuscript. SF participated in study design, helped to review the histological results and revised the manuscript. PH participated in histological results review and revised the manuscript. SC participated in tissue processing, embedding, sectioning and staining, and also revised the manuscript. GLC contributed to the study design, helped with some of the tissue sample accruals and revised the manuscript. JP participated in preparation of the cancer cell line and revised the manuscript. CHN participated in preparation of the cancer cell line and revised the manuscript. EDW performed some of the immunohistochemical staining, participated in interpretation of the data and revised the manuscript. MH helped to conceive of the study design, interpreted the data and revised the manuscript. EWT conceived of the study, participated in its design and in interpretation of the data, and revised the manuscript. KB participated in study design, harvested all biochamber material, assisted with analysis of the data and revised the manuscript. All authors read and approved the final manuscript.
Authors’information
CWH is a full-time doctoral degree candidate in the Department of Surgery, St Vincent’s Hospital and the University of Melbourne. MW is a scientist at St Vincent’s Institute of Medical Research, Melbourne. CK and SF are consultant pathologists at Peter MacCallum Cancer Centre. PH is a consultant pathologist at St Vincent’s Hospital. SC is a scientist in the Department of Pathology at St Vincent’s Hospital, Melbourne. GLC is a consultant general surgeon at Austin Health and the Northern Hospital, Melbourne. JP and CHN are scientists in the School of Biomedical Sciences at Monash University, Melbourne. EDW is a senior research fellow at Queensland University of Technology, Australian Prostate Cancer Research Centre - Queenland, and the Translational Research Institute, Brisbane, Australia. MH is a professor of surgery at Peter MacCallum Cancer Centre. EWT is a professor of medical science at Queensland University of Technology and the Translational Research Institute. KB is a senior research fellow at Peter MacCallum Cancer Centre, Melbourne, Australia.
Competing interests
The authors declare that they have no competing interests.
Consent for publication
All women whose breast specimens were used in this study were provided consent for participation in the study and for publication of the study results in a peer-reviewed scientific journal.
Ethics approval and consent to participate
This study was approved by the Peter MacCallum Human Research Ethics Committee (08/21) and St Vincent’s Hospital Animal Ethics Committee (009/14). It was conducted in accordance with the Australian National Statement on Ethical Conduct in Human and Animal Research (2007).
Author details
1Department of Surgery, University of Melbourne, St Vincent’s Hospital,
Melbourne, VIC 3156, Australia.2St Vincent’s Institute of Medical Research,
Cancer Centre, 305 Grattan St, Melbourne, VIC 3000, Australia.4Department
of Pathology, University of Melbourne, Grattan Street, Parkville, VIC 3010, Australia.5Sir Peter MacCallum Department of Oncology, University of
Melbourne, Grattan Street, Parkville, VIC 3010, Australia.6Department of Pathology, St Vincent’s Hospital, Melbourne, VIC 3156, Australia.7Austin
Health and Northern Health, Melbourne, VIC 3084, Australia.8College of
Health and Biomedicine, Victoria University, St Albans, VIC 8001, Australia.
9
Department of Biochemistry and Molecular Biology, School of Biomedical Sciences, Monash University, Clayton, VIC 3800, Australia.10Australian Institute
for Musculoskeletal Science (AIMSS), Victoria University, University of Melbourne and Western Health, Sunshine Hospital, St Albans, VIC 3021, Australia.11Institute of Health and Biomedical Innovation and School of Biomedical Sciences, Queensland University of Technology, 2 George Street, Brisbane, QLD 4001, Australia.12Translational Research Institute, 37 Kent
Street, Woolloongabba, QLD 4102, Australia.13Australian Prostate Cancer
Centre–Queensland, Brisbane, QLD 4102, Australia.14Division of Surgery, Peter MacCallum Cancer Centre, Melbourne, VIC 3002, Australia.
15Department of Anatomy and Developmental Biology, Monash University,
Melbourne, VIC 3800, Australia.16Metastasis Research Laboratory, Peter
MacCallum Cancer Centre, Melbourne, Victoria 3000, Australia.
Received: 9 June 2016 Accepted: 5 October 2016
References
1. McCormack VA, dos Santos Silva I. Breast density and parenchymal patterns as markers of breast cancer risk: a meta-analysis. Cancer Epidemiol Biomarkers Prev. 2006;15(6):1159–69.
2. Boyd NF, Guo H, Martin LJ, Sun L, Stone J, Fishell E, et al. Mammographic density and the risk and detection of breast cancer. N Engl J Med. 2007;356(3):227–36. 3. Huo CW, Chew GL, Britt KL, Ingman WV, Henderson MA, Hopper JL, et al. Mammographic density—a review on the current understanding of its association with breast cancer. Breast Cancer Res Treat. 2014;144(3):479–502. 4. Mullooly M, Pfeiffer RM, Nyante SJ, Heckman-Stoddard BM, Perloff M, Jatoi I, et al. Mammographic density as a biosensor of tamoxifen effectiveness in adjuvant endocrine treatment of breast cancer: opportunities and implications. J Clin Oncol. 2016;34(18):2093–7.
5. Stomper PC, D’Souza DJ, DiNitto PA, Arredondo MA. Analysis of parenchymal density on mammograms in 1353 women 25-79 years old. AJR Am J Roentgenol. 1996;167(5):1261–5.
6. Ursin G, Hovanessian-Larsen L, Parisky YR, Pike MC, Wu AH. Greatly increased occurrence of breast cancers in areas of mammographically dense tissue. Breast Cancer Res. 2005;7(5):R605–8.
7. Aiello EJ, Buist DS, White E, Porter PL. Association between mammographic breast density and breast cancer tumor characteristics. Cancer Epidemiol Biomarkers Prev. 2005;14(3):662–8.
8. Yaghjyan L, Colditz GA, Collins LC, Schnitt SJ, Rosner B, Vachon C, et al. Mammographic breast density and subsequent risk of breast cancer in postmenopausal women according to tumor characteristics. J Natl Cancer Inst. 2011;103(15):1179–89.
9. Kerlikowske K, Cook AJ, Buist DS, Cummings SR, Vachon C, Vacek P, et al. Breast cancer risk by breast density, menopause, and postmenopausal hormone therapy use. J Clin Oncol. 2010;28(24):3830–7.
10. Cil T, Fishell E, Hanna W, Sun P, Rawlinson E, Narod SA, et al. Mammographic density and the risk of breast cancer recurrence after breast-conserving surgery. Cancer. 2009;115(24):5780–7.
11. Park CC, Rembert J, Chew K, Moore D, Kerlikowske K. High mammographic breast density is independent predictor of local but not distant recurrence after lumpectomy and radiotherapy for invasive breast cancer. Int J Radiat Oncol Biol Phys. 2009;73(1):75–9.
12. Raviraj V, Zhang H, Chien HY, Cole L, Thompson EW, Soon L. Dormant but migratory tumour cells in desmoplastic stroma of invasive ductal carcinomas. Clin Exp Metastasis. 2012;29(3):273–92.
13. Raviraj V, Fok S, Zhao J, Chien HY, Lyons JG, Thompson EW, et al. Regulation of ROCK1 via Notch1 during breast cancer cell migration into dense matrices. BMC Cell Biol. 2012;13:12.
14. Provenzano PP, Inman DR, Eliceiri KW, Knittel JG, Yan L, Rueden CT, Keely PJ, et al. Collagen density promotes mammary tumor initiation and progression. BMC Med. 2008;6:11.
15. Chew GL, Huang D, Lin SJ, Huo C, Blick T, Henderson MA, et al. High and low mammographic density human breast tissues maintain histological
differential in murine tissue engineering chambers. Breast Cancer Res Treat. 2012;135(1):177–87.
16. Huo CW, Chew G, Hill P, Huang D, Ingman W, Hodson L, et al. High mammographic density is associated with an increase in stromal collagen and immune cells within the mammary epithelium. Breast Cancer Res. 2015;17:79. 17. Chew GL, Huo CW, Huang D, Blick T, Hill P, Cawson J, et al. Effects of
tamoxifen and oestrogen on histology and radiographic density in high and low mammographic density human breast tissues maintained in murine tissue engineering chambers. Breast Cancer Res Treat. 2014;148(2):303–14. 18. Chew GL, Huang D, Huo CW, Blick T, Hill P, Cawson J, et al. Dynamic
changes in high and low mammographic density human breast tissues maintained in murine tissue engineering chambers during various murine peripartum states and over time. Breast Cancer Res Treat. 2013;140(2):285–97. 19 Miller NA, Chapman JA, Qian J, Christens-Barry WA, Fu Y, Yuan Y, et al.
Heterogeneity between ducts of the same nuclear grade involved by duct carcinoma in situ (DCIS) of the breast. Cancer Inform. 2010;9:209–16. 20 Nguyen CH, Lang BJ, Chai RC, Vieusseux JL, Kouspou MM, Price JT.
Heat-shock factor 1 both positively and negatively affects cellular clonogenic growth depending on p53 status. Biochem J. 2013;452(2):321–9.
21 Miller FR, Santner SJ, Tait L, Dawson PJ. MCF10DCIS.com xenograft model of human comedo ductal carcinoma in situ. J Natl Cancer Inst. 2000;92(14):1185–6. 22 Tait LR, Pauley RJ, Santner SJ, Heppner GH, Heng HH, Rak JW, et al. Dynamic
stromal-epithelial interactions during progression of MCF10DCIS.com xenografts. Int J Cancer. 2007;120(10):2127–34.
23 Elston CW, Ellis IO. Pathological prognostic factors in breast cancer. I. The value of histological grade in breast cancer: experience from a large study with long-term follow-up. Histopathology. 1991;19(5):403–10.
24 Papadimitriou M, Kaptanis S, Polymeropoulos E, Mitsopoulos G, Stogiannis D, Caroni C, et al. Nuclear grade plus proliferation grading system for invasive ductal carcinoma of the breast: validation in a tertiary referral hospital cohort. Am J Clin Pathol. 2015;144(6):837–43.
25 Sailer V, Luders C, Kuhn W, Pelzer V, Kristiansen G. Immunostaining of Np63 (using the p40 antibody) is equal to that of p63 and CK5/6 in high-grade ductal carcinoma in situ of the breast. Virchows Arch. 2015;467(1):67–70. 26 Lodillinsky C, Infante E, Guichard A, Chaligne R, Fuhrmann L, Cyrta J, et al.
p63/MT1-MMP axis is required for in situ to invasive transition in basal-like breast cancer. Oncogene. 2016;35(3):344–57.
27 Bhargava R, Beriwal S, McManus K, Dabbs DJ. CK5 is more sensitive than CK5/6 in identifying the“basal-like”phenotype of breast carcinoma. Am J Clin Pathol. 2008;130(5):724–30.
28 Grin A, O’Malley FP, Mulligan AM. Cytokeratin 5 and estrogen receptor immunohistochemistry as a useful adjunct in identifying atypical papillary lesions on breast needle core biopsy. Am J Surg Pathol. 2009;33(11):1615–23. 29 Zheng Y, Ao Z, Wang B, Jayappa KD, Yao X. Host protein Ku70 binds and
protects HIV-1 integrase from proteasomal degradation and is required for HIV replication. J Biol Chem. 2011;286(20):17722–35.
30 Thong AE, Zhao H, Ingels A, Valta MP, Nolley R, Santos J, et al. Tissue slice grafts of human renal cell carcinoma: an authentic preclinical model with high engraftment rate and metastatic potential. Urol Oncol. 2014;32(1):43. e23–30. 31 Boyd NF, Li Q, Melnichouk O, Huszti E, Martin LJ, Gunasekara A, et al. Evidence
that breast tissue stiffness is associated with risk of breast cancer. PLoS One. 2014;9(7):e100937.
32 McConnell JC, O’Connell OV, Brennan K, Weiping L, Howe M, Joseph L, et al. Increased peri-ductal collagen micro-organization may contribute to raised mammographic density. Breast Cancer Res. 2016;18:5.
33 Pang JM, Byrne DJ, Takano EA, Jene N, Petelin L, McKinley J, et al. Breast tissue composition and immunophenotype and its relationship with mammographic density in women at high risk of breast cancer. PLoS One. 2015;10(6):e0128861.
34 Levental KR, Yu H, Kass L, Lakins JN, Egeblad M, Erler JT, et al. Matrix crosslinking forces tumor progression by enhancing integrin signaling. Cell. 2009;139(5):891–906. 35 Conklin MW, Eickhoff JC, Riching KM, Pehlke CA, Eliceiri KW, Provenzano PP,
et al. Aligned collagen is a prognostic signature for survival in human breast carcinoma. Am J Pathol. 2011;178(3):1221–32.
36 Zangani D, Darcy KM, Shoemaker S, Ip MM. Adipocyte-epithelial interactions regulate the in vitro development of normal mammary epithelial cells. Exp Cell Res. 1999;247(2):399–409.
38 Hagios C, Lochter A, Bissell MJ. Tissue architecture: the ultimate regulator of epithelial function? Philos Trans R Soc Lond B Biol Sci. 1998;353(1370):857–70. 39 Guo YP, Martin LJ, Hanna W, Banerjee D, Miller N, Fishell E, et al. Growth
factors and stromal matrix proteins associated with mammographic densities. Cancer Epidemiol Biomarkers Prev. 2001;10(3):243–8.
40 Paszek MJ, Weaver VM. The tension mounts: mechanics meets morphogenesis and malignancy. J Mammary Gland Biol Neoplasia. 2004;9(4):325–42. 41 Kass L, Erler JT, Dembo M, Weaver VM. Mammary epithelial cell: influence of
extracellular matrix composition and organization during development and tumorigenesis. Int J Biochem Cell Biol. 2007;39(11):1987–94.
42 Lu P, Weaver VM, Werb Z. The extracellular matrix: a dynamic niche in cancer progression. J Cell Biol. 2012;196(4):395–406.
43 Shawky MS, Ricciardelli C, Lord M, Whitelock J, Ferro V, Britt K, et al. Proteoglycans: potential agents in mammographic density and the associated breast cancer risk. J Mammary Gland Biol Neoplasia. 2015;20(3–4):121–31. 44 Reinier KS, Vacek PM, Geller BM. Risk factors for breast carcinoma in situ
versus invasive breast cancer in a prospective study of pre- and post-menopausal women. Breast Cancer Res Treat. 2007;103(3):343–8.
45 MacKenzie TA, Titus-Ernstoff L, Vacek PM, Geller B, Weiss JE, Goodrich ME, et al. Breast density in relation to risk of ductal carcinoma in situ of the breast in women undergoing screening mammography. Cancer Causes Control. 2007;18(9):939–45.
46 Alowami S, Troup S, Al-Haddad S, Kirkpatrick I, Watson PH. Mammographic density is related to stroma and stromal proteoglycan expression. Breast Cancer Res. 2003;5(5):R129–35.
47 Vachon CM, Pankratz VS, Scott CG, Maloney SD, Ghosh K, Brandt KR, et al. Longitudinal trends in mammographic percent density and breast cancer risk. Cancer Epidemiol Biomarkers Prev. 2007;16(5):921–8.
48 Unsworth A, Anderson R, Britt K. Stromal fibroblasts and the immune microenvironment: partners in mammary gland biology and pathology? J Mammary Gland Biol Neoplasia. 2014;19(2):169–82.
49 Orimo A, Gupta PB, Sgroi DC, Arenzana-Seisdedos F, Delaunay T, Naeem R, et al. Stromal fibroblasts present in invasive human breast carcinomas promote tumor growth and angiogenesis through elevated SDF-1/CXCL12 secretion. Cell. 2005;121(3):335–48.
50 Stuedal A, Ma H, Bernstein L, Pike MC, Ursin G. Does breast size modify the association between mammographic density and breast cancer risk? Cancer Epidemiol Biomarkers Prev. 2008;17(3):621–7.
51 Stone J, Ding J, Warren RM, Duffy SW, Hopper JL. Using mammographic density to predict breast cancer risk: dense area or percentage dense area. Breast Cancer Res. 2010;12(6):R97.
52 Pettersson A, Hankinson SE, Willett WC, Lagiou P, Trichopoulos D, Tamimi RM. Nondense mammographic area and risk of breast cancer. Breast Cancer Res. 2011;13(5):R100.
53 Torres-Mejía G, De Stavola B, Allen DS, Pérez-Gavilán JJ, Ferreira JM, Fentiman IS, et al. Mammographic features and subsequent risk of breast cancer: a comparison of qualitative and quantitative evaluations in the Guernsey prospective studies. Cancer Epidemiol Biomarkers Prev. 2005;14(5):1052–9.
54 Grossmann ME, Ray A, Nkhata KJ, Malakhov DA, Rogozina OP, Dogan S, et al. Obesity and breast cancer: status of leptin and adiponectin in pathological processes. Cancer Metastasis Rev. 2010;29(4):641–53. 55 Lokate M, Peeters PH, Peelen LM, Haars G, Veldhuis WB, van Gils CH.
Mammographic density and breast cancer risk: the role of the fat surrounding the fibroglandular tissue. Breast Cancer Res. 2011;13(5):R103. 56 Ching S, Kashinkunti S, Niehaus MD, Zinser GM. Mammary adipocytes bioactivate
25-hydroxyvitamin D3and signal via vitamin D(3) receptor, modulating
mammary epithelial cell growth. J Cell Biochem. 2011;112(11):3393–405. 57 Matthews D, LaPorta E, Zinser GM, Narvaez CJ, Welsh J. Genomic vitamin D
signaling in breast cancer: insights from animal models and human cells. J Steroid Biochem Mol Biol. 2010;121(1-2):362–7.
58 Welsh J. Vitamin D, and breast cancer: insights from animal models. Am J Clin Nutr. 2004;80(6 Suppl):1721S–4S.
59 Iyengar P, Espina V, Williams TW, Lin Y, Berry D, Jelicks LA, et al. Adipocyte-derived collagen VI affects early mammary tumor progression in vivo, demonstrating a critical interaction in the tumor/stroma microenvironment. J Clin Invest. 2005; 115(5):1163–76.
60 Iyengar P, Combs TP, Shah SJ, Gouon-Evans V, Pollard JW, Albanese C, et al. Adipocyte-secreted factors synergistically promote mammary tumorigenesis through induction of anti-apoptotic transcriptional programs and proto-oncogene stabilization. Oncogene. 2003;22(41):6408–23.
61 Welte G, Alt E, Devarajan E, Krishnappa S, Jotzu C, Song YH. Interleukin-8 derived from local tissue-resident stromal cells promotes tumor cell invasion. Mol Carcinog. 2012;51(11):861–8.
62 Walter M, Liang S, Ghosh S, Hornsby PJ, Li R. Interleukin 6 secreted from adipose stromal cells promotes migration and invasion of breast cancer cells. Oncogene. 2009;28(30):2745–55.
63 Yu JM, Jun ES, Bae YC, Jung JS. Mesenchymal stem cells derived from human adipose tissues favor tumor cell growth in vivo. Stem Cells Dev. 2008;17(3):463–73.
64 Huo CW, Huang D, Chew GL, Hill P, Vohora A, Ingman WV, et al. Human glandular organoid formation in murine engineering chambers after collagenase digestion and flow cytometry isolation of normal human breast tissue single cells. Cell Biol Int. 2016;40(11):1212-223.
• We accept pre-submission inquiries
• Our selector tool helps you to find the most relevant journal
• We provide round the clock customer support
• Convenient online submission
• Thorough peer review
• Inclusion in PubMed and all major indexing services
• Maximum visibility for your research
Submit your manuscript at www.biomedcentral.com/submit