RESEARCH NOTE
Patients expectation strongly associated
with patients perception to nursing care:
hospital based cross sectional study
Alem Girmay
*, Tekleweyni Marye, Mebrahtu Haftu, Dawit G/her, Tsion Brhanu and Hadgu Gerensea
Abstract
Objective: Nursing care is one of the most important components of health care and patient expectation toward nursing care is being rising. Accordingly, patients’ expectation needs to be managed adequately in order to improve outcomes and decrease liability through their perception. To improve the outcome based on the expectation of patients, we need to consider patients’ perception to the care they received. So this study aims to identifies the per-ceptions toward nursing care and their associated factors.
Result: From a total of 281 admitted patients 151 (53.7%) were females; 136 (48.4%) were found in the age group of 21–30 years with mean age of 30 (11 ± SD) years. The mean score of overall perception were 62.6 ± 17.9 (95% CI 60.79–64.37). Among all 154 (54.8%) participants had poor perception to nursing care. Occupation, ward and expecta-tion had associaexpecta-tion with percepexpecta-tion. Patient’s level of percepexpecta-tion towards nursing care was poor (54.7%) and ward where patients admitted, expectation of patients, occupation of patients and duration of hospital stay were signifi-cantly associated with patients’ perception. So that health institutions and nurses should focus on perception of their clients.
Keywords: Patient’s perception, Nursing care, Associated factors
© The Author(s) 2018. This article is distributed under the terms of the Creative Commons Attribution 4.0 International License (http://creat iveco mmons .org/licen ses/by/4.0/), which permits unrestricted use, distribution, and reproduction in any medium, provided you give appropriate credit to the original author(s) and the source, provide a link to the Creative Commons license, and indicate if changes were made. The Creative Commons Public Domain Dedication waiver (http://creat iveco mmons .org/ publi cdoma in/zero/1.0/) applies to the data made available in this article, unless otherwise stated.
Introduction
Fundamentally, patients express their requirements in terms of what they need, want, prefer and demand with respect to the nursing care they receive [1]. The require-ments of patients could be considered as a demand for quality nursing care that nurses and health system attempt to meet [2–4]. Excellence in nursing care is what those in need of healthcare services wish for, and it is also the main goal for those providing the care [4–6].
To improve the quality of nursing care that is the com-bined product of patient expectation and perception, health care team especially the nurse should be aware what the patients perceive to nursing care service as well as what factors influence patients perception to nursing care [1].
Different studies revealed that nurses treated patients and relatives of hospitalized patients as inferior, nurses were rude and offered cold reception in public hospitals [7], and patients were dissatisfied with information pro-vided because they felt the information given about their condition or related to their disease was inadequate [8].
A study done in Jordanin 2005 found out that major-ity of participants had positive experiences regarding time nurses spent with patients as well as respect for patients. It is not only the time nurses spent with patients and respect for patients that would determine patients perceptions of nursing care but also other factors such as adequate information about their condition and treat-ment, kindness, cheerfulness and other related things are expected from the nursing care [8, 9].
In another study conducted in Tanzania National Hos-pital revealed that patients were dissatisfied with the atti-tude of health professionals including nurses [7].
Current study reveals that while a very high per-centage of patients have a good perception of the ward
Open Access
*Correspondence: alemgirmay21@gmail.com
organization, capabilities, availability and responsiveness of the nurse quiet a fair percentage of patients perceive explanation and information and caring attitude qualities of the nursing care as poor. Many other studies have also revealed the patients perception of communication and information aspects of nursing care as less than adequate [10].
Still researchers said patients are satisfied or dissatis-fied by using their own criteria which have no consist-ency. For this reason the health system is being blamed by patients at different time with different complaints including the whole community because there is a gap between the reports and actual patient expectation and perception on nursing care. Due to this, the image of nursing care was became ambiguous to patients paral-lel to this it also being disturbing the image of nursing professionals which influences the quality of the whole health system [11, 12].
Researches were done in different related contexts but few of them tried to dig out level of perception of patients with their associated factors to nursing care [3, 11]. Understanding patient’s perceptions towards nurs-ing care enables health institutions to design nursnurs-ing care based on the finding. It helps in identifying areas of patients’ satisfaction and dissatisfaction for the differ-ent items of nursing care. The result also may be used in quality assurance program of the institution, to health planners and to prepare training based on the findings and finally it will be a guide for further related studies. So this study assessed the perception of patients towards nursing care and its associated factors.
Main text
Study area and study design
Quantitative Hospital based cross sectional study was conducted from April 1 to 30, 2017 at Hiwot Fana Spe-cialized University Hospital which is found in Harar Town, 525 km away from Addis Ababa. It provides a broad range of medical services to both in and out patient of all age groups with a total capacity of about 161 in patient beds in four major departments and other specialty units with average annual bed occupancy rate 72.2% and average annual length of stay 4.1 (5.4 for April) with annual turnover rate of 7 and 5 for April.
Sample size
A total of 281 patients from medical, surgical, obstet-rics and gynecology wards who was age greater or equal to 18 years old and admitted for at least 48 h were taken and interviewed randomly. Single population proportion for patients’ perception and associated factors were used to calculate the sample size, with assumptions; preva-lence = 37.5% [13], CI at 95%, margin of error 4% for
perception and power = 80%, the ratio of unexposed to exposed almost equivalent to 1 in Epi Info version 7 for the associated factors.
Data collection tool and analysis
Pretested semi structured data collection tool which had five Likert Scales was used to collect data. To con-trol quality of the data double data entry was done by two data clerks and consistency of the entered data were cross checked by comparing the two separately entered data on Epi Data. The raw data was cleaned, coded and entered into the computer as soon as data generated and analyzed using SPSS version 22. Data was summa-rized using descriptive and inferential statistics. Bivari-ate analysis at 95% confidence interval was used to infer association between the independent and outcome vari-ables. Independent factors, with a p-value < 0.25 obtained in the bivariate logistic regression was entered into the multiple logistic regression model to obtain the signifi-cant variables. Statistical significance was declared at (p < 0.05). Variables which were statistically significant at p-value < 0.05 was identified as factors of patients percep-tion to nursing care.
Operational definitions
Patient’s perception to nursing care; the patient’s view on nursing care after nursing care received.
Good perception; having score above mean score of nursing care items.
Poor perception; having score below mean score of nursing care items.
Ethics approval and consent to participate
Institutional Health Research Ethics Review Committee (IHRERC) of Haramaya University, College of Health and Medical Sciences, reviewed this study to ensure its pro-tection. Following the approval by IHRERC of Haramaya University, official permission was also received from Hiwot Fana Specialized University Hospital (HFSUH). The objective and importance of the study was explained to the study participants. Data was collected after full informed oral consent was obtained from participants. In order to keep confidentiality of any information obtained, the data collection procedure was treated anonymous.
Result
Sociodemographic characteristics and other relevant informations of participants
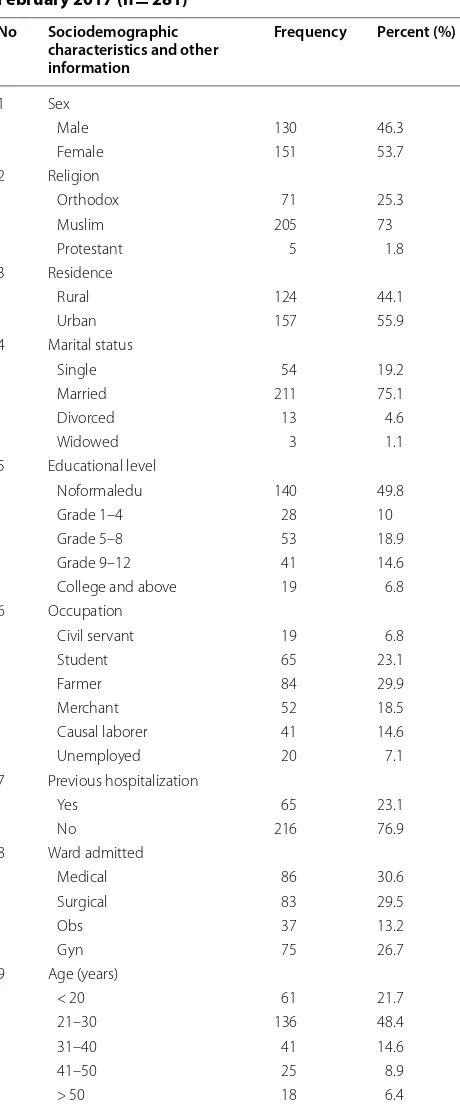
ward; 211 (75.1%) participants were married; 140 (49.8%) had not attended any formal education; 157 (55.9%) were from urban; 205 (73%) were Muslim in their religion and 84 (29.9%) were farmers in their occupation; 65 (23.1%) had history of previous hospitalization (Table 1).
Patient’s perception towards nursing care
Patient’s perception towards nursing care were measured using 22 items which had five Likert Scale response that includes comprehensive nursing care components, physi-cal nursing care components, psychologiphysi-cal components and ethical performance and characteristics of nursing care components.
The Likert Scale result revealed that the mean rat-ing values ranged from 2.06 (± 0.0809) to 3.5 (± 1.1). Responsiveness and cheerfulness of nursing care provi-sion was rated the highest 3.5 (± 1.1) followed by sedat-ing patients pain 3.28 ± 1.17, kindness and politeness of the service 3.23 ± 1.8
The mean score of overall perception were 62.6 ± 17.9 (95% CI 60.79–64.37). Those participants scored below the mean value taken as poor level of perception to nurs-ing care and those participants scored above the mean score taken as good level of perception to nursing care. As to this 154 (54.8%) participants had poor perception to nursing care (Table 2).
Factors associated with patient’s perception towards nursing care
Variables such as age of participants, sex, educational level of participants, marital status, religion, previous hospitalization history, ward and patients expectation were inserted to the binary logistic regression to see vari-ables those have association with the outcome variable, then after wards where patients admitted, occupation, sex, duration of hospital stay and expectation of patients had association with patients perception towards nursing care with p-value ≤ 0.25 in the binary logistic regression. To control multicolinearityVIF was used. Wards where patients admitted, occupation, duration of hospital stay and expectation of patients had significant association with the patients level of perception towards nursing care in the multivariate logistic regression model with p-value less than 0.05 (Table 3).
Discussion
Patient’s perception towards nursing care
Patients had also reflected their perception in five Lik-ert Scale on the nursing care, as to this responsiveness and cheerfulness of nursing care provision was rated the highest 3.5 (± 1.1). Sedating patients pain, kindness and politeness of the service, knowledgeable and competence of nursing care, patient follow up scored highest next to
Table 1 Sociodemographic characteristics and other
relevant data of the study participants at Hiwot Fana Specialized University Hospital (HFSUH), Eastern Ethiopia, February 2017 (n = 281)
No Sociodemographic characteristics and other information
Frequency Percent (%)
1 Sex
Male 130 46.3
Female 151 53.7
2 Religion
Orthodox 71 25.3
Muslim 205 73
Protestant 5 1.8
3 Residence
Rural 124 44.1
Urban 157 55.9
4 Marital status
Single 54 19.2
Married 211 75.1
Divorced 13 4.6
Widowed 3 1.1
5 Educational level
Noformaledu 140 49.8
Grade 1–4 28 10
Grade 5–8 53 18.9
Grade 9–12 41 14.6
College and above 19 6.8
6 Occupation
Civil servant 19 6.8
Student 65 23.1
Farmer 84 29.9
Merchant 52 18.5
Causal laborer 41 14.6
Unemployed 20 7.1
7 Previous hospitalization
Yes 65 23.1
No 216 76.9
8 Ward admitted
Medical 86 30.6
Surgical 83 29.5
Obs 37 13.2
Gyn 75 26.7
9 Age (years)
< 20 61 21.7
21–30 136 48.4
31–40 41 14.6
41–50 25 8.9
[image:3.595.306.536.126.678.2]responsiveness and cheerfulness (3.43 ± 1.19, 3.28 ± 1.17, 3.23 ± 1.11, 3.21 ± 1.245 respectively). Harsh and rude, thinking for patients, privacy provision, education on disease and disease related conditions, paying attention
to patients individual needs got lowest score as compared from the above (2.06 ± 0.809, 2.31 ± 1.345, 2.39 ± 1.31, 2.44 ± 0.996, 2.46 ± 1.152 respectively). This finding was different from the finding in Turkey in 2009 and Iran in 2005 [14, 15], in this study there were high score other than physical care. This may due to the difference in study period, study area and living standard.
The mean score of perception to nursing care in Lik-ert Scale was 2.78 ± 0.95, this was lower than from the finding of study done in China in 2011 [16], which was 4.14 ± 0.62. The mean score of overall total perception to nursing care components were 62.6 ± 17.9, this finding were lower than the finding of study done in Iran in 2015 [17] and study done in Nepal in 2014 [18] which were Table 1 (continued)
No Sociodemographic characteristics and other information
Frequency Percent (%)
10 Duration of stay (in days)
2–7 245 87.2
8–14 30 10.7
> 14 6 2.1
Table 2 Level of patients perception towards nursing care in Likert Scale at Hiwot Fana Specialized University Hospital (HFSUH), Eastern Ethiopia, Feb 2017 (n = 281)
Frequency and percent of participant response [number in bracket indicates percent (%)]
Items Strongly disagree Disagree Neutral Agree Strongly agree Total Mean rating
Education about the disease and disease related
issues to patients 34 (8.8) 238 (61.8) 40 (10.4) 55 (14.3) 18 (4.7) 940 2.44 ± .996
Responding to patients questions and giving
infor-mation about the disease and medications 30 (7.8) 116 (30.1) 127 (33) 89 (23.1) 23 (6) 1114 2.89 ± 1.37 Meeting the patients needs 28 (7.3) 71 (18.4) 125 (32.5) 121 (31.4) 40 (10.4) 1229 3.19 ± 1.082
Sedating the patients pain 35 (9.1) 47 (12.2) 94 (24.4) 136 (35.3) 73 (19) 1320 3.43 ± 1.191
Following up the patients 47 (12.2) 65 (16.9) 94 (24.4) 119 (30.9) 60 (15.6) 1235 3.21 ± 1.245 Frequent presence around the patients and asking
how they feel 50 (13) 87 (22.6) 95 (24.7) 102 (26.5) 51 (23.2) 1172 3.04 ± 1.242
Immediate response to their needs 66 (17.1) 117 (30.4) 93 (24.2) 70 (18.2) 39 (10.1) 1054 2.74 ± 1.23 Paying attention to the patients’ individual needs 85 (22.1) 135 (35.1) 89 (23.1) 53 (13.8) 23 (6) 949 2.46 ± 1.152
Providing comfort patients 92 (23.9) 129 (33.5) 67 (17.4) 61 (15.8) 36 (9.4) 975 2.53 ± 1.268
Keeping patient privacy and screening during
procedure 123 (31.9) 113 (29.4) 58 (15.1) 56 (14.5) 35 (9.1) 922 2.39 ± 1.311
Convincing the patients 29 (7.5) 76 (19.7) 123 (31.9) 112 (29.1) 45 (11.7) 1223 3.18 ± 1.109
Calmly speaking with them 43 (11.2) 64 (16.6) 129 (33.5) 105 (27.3) 44 (11.4) 1198 3.11 ± 1.155
Reassuring them 47 (12.2) 95 (24.7) 108 (28.1) 101 (26.2) 34 (8.8) 1135 2.95 ± 1.163
Not causing them stress 55 (14.3) 96 (24.9) 130 (33.8) 70 (18.2) 34 (8.8) 1087 2.82 ± 1.152
Gaining their trust 76 (19.7) 120 (31.2) 87 (22.6) 63 (16.4) 39 (10.1) 1024 2.66 ± 1.248
Creating relationships with them 107 (27.8) 90 (23.4) 81 (21) 64 (16.6) 43 (11.2) 1001 2.6 ± 1.343
Listening to them 107 (27.8) 114 (29.6) 57 (14.8) 63 (16.4) 44 (11.4) 978 2.54 ± 1.35
Thinking for the patients 148 (38.4) 90 (23.4) 63 (16.4) 47 (12.2) 37 (9.6) 890 2.31 ± 1.345
To be kind, polite, friendly and respectful 25 (6.5) 90 (23.4) 81 (21) 130 (33.8) 59 (15.3) 1263 3.28 ± 1.17
Harsh and rude 73 (19) 247 (64.2) 40 (10.4) 17 (4.4) 8 (2.1) 795 2.06 ± .809
Knowledgeable and competent 34 (8.8) 51 (13.2) 140 (36.4) 111 (28.8) 49 (12.7) 1245 3.23 ± 1.11
Responsive and cheerful 30 (7.8) 34 (8.8) 96 (24.9) 165 (42.9) 60 (15.6) 1346 3.5 ± 1.1
Likert Scale mean score of perception 2.78 ± 0.95
Overall mean score of perception 24,095 62.6 ± 17.9
Overall how do you rate nursing care Excellent 63 (16.4%) 925 2.4 ± .928
Good 160 (41.6%)
Fair 106 (27.5%)
[image:4.595.64.538.318.716.2]93.33 ± 12.43 and 97.32 ± 13.45 respectively, this may be happen due to study area difference.
56.1% of participants had poor perception to nursing care. This finding were different from the study done in Ethiopia, Mekelle in 2013 [13] which was 9.4% poor per-ception. This may be due to the instrument used to meas-ure level of perception and study area.
Factors associated with patient’s perception towards nursing care
Wards where patients admitted had significant associa-tion with patient’s percepassocia-tion towards nursing care. Being treated in medical ward had 0.416 times less percep-tion than other wards (AOR = 0.416; 0.215, 0.806). This finding was different from the previous findings in stud-ies done in Britain in 2001 [19], Brazil in 2009 [15] and Iran in 2013 [11]. This may be due to difference in study period, study area and hospital wards infrastructure.
Patient’s expectation had significant association towards nursing care. Patients having good expectation towards nursing care had 13 time more perception than patients having poor expectation (AOR = 13.146; 11.313,
17.538). This finding was similar with the study done in Philippine 2013 [1].
Occupation had significant association with patient’s perception towards nursing care. Being student was 1.2 times more perception than other occupations (AOR = 1.196; 1.132, 3.312). This finding was similar with study done in Iran in 2013 [11].
Educational status, previous hospitalization, residence and age had positive association with patient’s perception towards nursing care even though not significant. This was similar with study in Britain in 2001 [19].
Conclusion
Patient’s level of perception towards nursing care was poor (54.7%) and ward where patients admitted, expecta-tion of patients and occupaexpecta-tion of patients were factors significantly associated with patients’ perception. So that health institutions and nurses should focus on perception of their clients.
Limitation of the study
Since the study was conducted in specific area the cul-tural and social norms may affect the result so that it Table 3 Factors associated towards patients perception to nursing care at Hiwot Fana Specialized University Hospital (HFSUH), Eastern Ethiopia, Feb 2017 (n = 281)
** Variables having significance difference to patients perception towards nursing care
Independent variables Frequency Level of perception p-value COR 95% CI p-value AOR 95% CI Good Poor
Sex
Female 151 72 79 0.211 0.77 (0.513–1.158) 0.542 0.844 (0.489–1.456)
Male 130 55 75 1 1
Occupation
Civil servant 19 9 10 0.269 1.853 (0.62–5.526) 0.373 1.685 (0.535–5.312)
Student** 65 26 39 0.175 1.547 (0.60–3.974) 0.032** 1.196 (1.132–3.312)
Farmer 84 44 40 0.130 2.011 (0.81–4.96) 0.237 1.788 (0.68–4.685)
Merchant 52 22 30 0.234 1.788 (0.68–4.657) 0.368 1.586 (0.58–4.328)
Causal labor 41 19 22 0.196 1.929 (0.713–5.21) 0.358 1.630 (0.57–4.62)
Unemployed 20 7 13 1
Ward admitted
Medical** 86 31 55 0.001 0.357 (0.20–0.62) 0.009** 0.416 (0.21–0.80)
Surgical 83 41 42 0.155 0.074 (0.39–1.16) 0.364 0.729 (0.37–1.44)
Gynecology** 37 23 14 0.003 0.352 (0.17–0.702) 0.001** 0.268 (0.12–0.58)
Obstetrics 75 41 34 1
Patient expectation
Good** 172 74 98 0.019 2.5 (1.146–5.378) 0.01** 13.146 (11.31–17.5)
Poor 109 53 56 1
Duration of stay in hospital (days)
2–7 245 108 137 0.011 3.3 (1.89–6.43) 0.001** 1.21 (0.98–1.56)
8–14 30 16 14 0.023 1.5 (1.25–2.24) 0.02** 3.4 (1.74–5.97)
[image:5.595.57.540.111.415.2]•fast, convenient online submission
•
thorough peer review by experienced researchers in your field
• rapid publication on acceptance
• support for research data, including large and complex data types
•
gold Open Access which fosters wider collaboration and increased citations maximum visibility for your research: over 100M website views per year
•
At BMC, research is always in progress. Learn more biomedcentral.com/submissions
Ready to submit your research? Choose BMC and benefit from: should be repeated in different population. Moreover,
the study design may not show cause and effect so that it should be repeated with different study design.
Abbreviations
CI: confidence interval; AOR: adjusted odd ratio; SPSS: Statistical Package for Social Sciences.
Authors’ contributions
AG conceived and designed the study, analyzed the data and wrote the manuscript. TM and MH DATA analysis, drafting of the manuscript and advis-ing the whole research paper. DG, TB and HG were involved in the interpreta-tion of the data and contributed to manuscript preparainterpreta-tion. HG involve in title selection, data analysis, drafting of the manuscript. All authors read and approved the final manuscript.
Acknowledgements
We would like to thank all study participants and data collectors for their contribution in success of our work.
Competing interests
The authors declare that they have no competing interests.
Availability of data and materials
The data sets used and analyzed during the current study available from the corresponding author on reasonable request.
Consent to publish
Not applicable.
Ethics approval and consent to participate
Institutional Health Research Ethics Review Committee (IHRERC) of Haramaya University, College of Health and Medical Sciences, reviewed this study to ensure its protection. Following the approval by IHRERC of Haramaya University, official permission was also received from Hiwot Fana Specialized University Hospital (HFSUH). The objective and importance of the study was explained to the study participants. Data was collected after full informed oral consent was obtained from participants. In order to keep confidentiality of any information obtained, the data collection procedure was treated anonymous.
Funding
There is no funding for this research. All cost of data collection and analysis were covered by the authors.
Publisher’s Note
Springer Nature remains neutral with regard to jurisdictional claims in pub-lished maps and institutional affiliations.
Received: 7 March 2018 Accepted: 15 May 2018
References
1. Reck DL. Can and should nurses be aware of patients’ expectations for their nursing care? Nurs Adm Q. 2013;37(2):109–15.
2. Courtenay M, Carey N, Stenner K, Lawton S, Peters J. Patients’ views of nurse prescribing: effects on care, concordance and medicine taking. Br J Dermatol. 2011;164(2):396–401.
3. Sayed HY, Mohamed HA, Mohamed EE. Patients’ perceptions as indicators of quality of nursing service provided At Al noor specialist hospital at Makkah Al Moukarramah, KSA. J Am Sci. 2013;9(5):71–8.
4. Shaller D. Patient-centered care: what does it take?. New York: Common-wealth Fund; 2007.
5. Abrahamsen Grøndahl V. Patients’ perceptions of actual care conditions and patient satisfaction with care quality in hospital. Karlstad: Karlstads Universitet; 2012.
6. Gerensea H, Solomon K, Birhane M, Medhin BG, Mariam TH, et al. Quality of nursing care among in-patient of medical-surgical ward in Axum St. Marry Hospital, Tigray, Ethiopia 2015. Enz Eng. 2015;4:132. https ://doi.
org/10.4172/2329-6674.10001 32.
7. Ahmad MM, Alasad JA. Predictors of patients’ experiences of nursing care in medical-surgical wards. Int J Nurs Pract. 2004;10(5):235–41.
8. Negash AK, Negussie D, Demissie AF. Patients’ satisfaction and associated factors with nursing care services in selected hospitals, Northwest Ethio-pia. Am J Nurs Sci. 2014;3(3):34–42.
9. Hegge M, Bunkers SS. Community change for crystallizing nursing’s focus. Nurs Sci Q. 2016;29(4):262–8.
10. Samina M, Qadri G, Tabish S, Samiya M, Riyaz R. Patient’s perception of nursing care at a large teaching hospital in India. Int J Health Sci. 2008;2(2):92.
11. Laal M. Inpatient’s perspective on nursing care; affecting factors. Procedia Soc Behav Sci. 2013;84:243–7.
12. Abdel Maqsood AS, Oweis AI, Hasna FS. Differences between patients’ expectations and satisfaction with nursing care in a private hospital in Jordan. Int J Nurs Pract. 2012;18(2):140–6.
13. Ghiwet L, Kidanu K. Assessment of patients expectation and perception towards nursing care in Ayder Referral Hospital, MekelleCity, Northern Ethiopia, a cross section study. Int J Nurs Educ Res 2014;1(1):4–11. 14. Varghese J. A study to assess the patient satisfaction with quality nursing
care in neuro medical unit. Trivandrum: SCTIMST; 2009.
15. Dorigan GH, Oliveira HC, Guirardello EDB. Qualitative inquiry into the patients’ expectations regarding nurses and nursing care. Adv Nurs. 2015;24(4):1003–8.
16. Zhao SH, Akkadechanunt T. Patients perceptions of quality nursing care in a Chinese Hospital. Int J Nurs Midwifery. 2011;3(9):145–9.
17. Muraleeeswaran R, Thenuka M. Patient’s perceptions regarding quality nursing care in a Sri Lankan Hospital. Imp J Interdiscipl Res. 2016. https ://
doi.org/10.14445 /24547 484/IJNHS -V4I1P 101.
18. Twayana S, Adhikari RH. Patient’s perception regarding nursing care at inpatient department of hospitals in Bhaktapur District. Int J Sci Res Publ. 2015;5:1–3.