Open Access
Research article
Early indicators of exposure to biological threat agents using host
gene profiles in peripheral blood mononuclear cells
Rina Das
†1, Rasha Hammamieh
†1, Roger Neill
1, George V Ludwig
2,
Steven Eker
3, Patrick Lincoln
3, Preveen Ramamoorthy
1, Apsara Dhokalia
1,
Sachin Mani
1, Chanaka Mendis
1, Christiano Cummings
1, Brian Kearney
4,
Atabak Royaee
5, Xiao-Zhe Huang
6, Chrysanthi Paranavitana
6,
Leonard Smith
2, Sheila Peel
7, Niranjan Kanesa-Thasan
2, David Hoover
6,
Luther E Lindler
6, David Yang
5, Erik Henchal
2and Marti Jett*
1,5Address: 1Division of Pathology, Walter Reed Army Institute of Research, Silver Spring, MD, USA, 2Diagnostic Systems Division, United States
Army Medical Research Institute of Infectious Diseases, USAMRIID, Ft. Detrick, Fredrick, MD, USA, 3Computer Science Laboratory, SRI
International, Menlo Park, CA, USA, 4Geo-Centers, Inc. Rockville, MD; USA, 5Department of Chemistry, Georgetown University, Washington, DC,
USA, 6Department of Bacterial & Rickettsial Diseases, Walter Reed Army Institute of Research, Silver Spring, MD 20910, USA and 7Division of
Retrovirology, Walter Reed Army Institute of Research, Rockville, MD, USA
Email: Rina Das - dasr2@nhlbi.nih.gov; Rasha Hammamieh - rasha.hammamieh@amedd.army.mil; Roger Neill - roger.neill@us.army.mil; George V Ludwig - george.ludwig@det.amedd.army.mil; Steven Eker - eker@csl.sri.com; Patrick Lincoln - lincoln@csl.sri.com;
Preveen Ramamoorthy - ramamoorthyp@medimmune.com; Apsara Dhokalia - apsara.dhokalia@us.army.mil; Sachin Mani - sachin.mani@na.amedd.army.mil; Chanaka Mendis - mendisc@uwplatt.edu;
Christiano Cummings - christiano.cummings@na.amedd.army.mil; Brian Kearney - brian.kearney@det.amedd.army.mil; Atabak Royaee - Atabak.Royaee@finnegan.com; Xiao-Zhe Huang - Xiaozhe.huang@na.amedd.army.mil;
Chrysanthi Paranavitana - chrysanthi.paranavitana@na.amedd.army.mil; Leonard Smith - leonard.smith@det.amedd.army.mil; Sheila Peel - speel@hivresearch.org; Niranjan Kanesa-Thasan - Niranjan.Kanesa_Thasan@cambis.com;
David Hoover - david.hoover@DVC.com; Luther E Lindler - Luther.lindler@us.army.mil; David Yang - yangdc@georgetown.edu; Erik Henchal - erik.henchal@fda.hhs.gov; Marti Jett* - marti.jett@us.army.mil
* Corresponding author †Equal contributors
Abstract
Background: Effective prophylaxis and treatment for infections caused by biological threat agents (BTA) rely upon early diagnosis and rapid initiation of therapy. Most methods for identifying pathogens in body fluids and tissues require that the pathogen proliferate to detectable and dangerous levels, thereby delaying diagnosis and treatment, especially during the prelatent stages when symptoms for most BTA are indistinguishable flu-like signs.
Methods: To detect exposures to the various pathogens more rapidly, especially during these early stages, we evaluated a suite of host responses to biological threat agents using global gene expression profiling on complementary DNA arrays.
Results: We found that certain gene expression patterns were unique to each pathogen and that other gene changes occurred in response to multiple agents, perhaps relating to the eventual
course of illness. Nonhuman primates were exposed to some pathogens and the in vitro and in vivo
findings were compared. We found major gene expression changes at the earliest times tested post
exposure to aerosolized B. anthracis spores and 30 min post exposure to a bacterial toxin.
Published: 30 July 2008
BMC Infectious Diseases 2008, 8:104 doi:10.1186/1471-2334-8-104
Received: 8 February 2008 Accepted: 30 July 2008
This article is available from: http://www.biomedcentral.com/1471-2334/8/104
© 2008 Das et al; licensee BioMed Central Ltd.
Conclusion: Host gene expression patterns have the potential to serve as diagnostic markers or predict the course of impending illness and may lead to new stage-appropriate therapeutic strategies to ameliorate the devastating effects of exposure to biothreat agents.
Background
Recent events have demonstrated that the capability to assess exposure and infection of individuals by biological threat agent (BTA) well in advance of onset of illness or at various stages post-exposure could offer important diag-nostic and therapeutic benefits. Direct pathogen identifi-cation can be elusive since many pathogens sequester in tissues initially. Direct pathogen methods include the classical culture methods, immunoassay, and gene ampli-fication of the pathogen. Although these methods are being improved for incredibly greater sensitivity [1-3], the efficiency of any diagnostic approach for direct pathogen assessment depends upon the presence of agent in a small specimen matrix. By the time detectable levels of patho-gen are reached, it is frequently too late to halt the pro-gression of the intractable illness [4,5]. Host responses that occur rapidly after exposure to specific pathogenic agents could provide the needed information for defense against the biothreat agents at time periods when clinical signs might include general malaise or flu-like symptoms that would not differentiate among diverse pathogenic agents (Additional file 1).
Correlation of the course of the infection and the disease progression with molecular responses provides opportu-nities to understand pathogenesis resulting from biologi-cal agent exposure. Symptoms of exposure to biologibiologi-cal toxins such as Vibrio cholerae toxin (CT), Clostridium botu-linum toxin A (BoNT-A), and Staphylococcal enterotoxin B (SEB) include violent reactions within hours of expo-sure and may lead to death in a few days. In contrast, Bru-cella infection (B. melitensis 16 M) produces late-onset of mild symptoms that persist over a long period of time. Other bacterial pathogens, such as those causing anthrax (B. anthracis) or plague (Yersinia pestis), induce systemic, flu-like symptoms initially and progress to lethal shock and death days later. In the case of viral threat agents, Ven-ezuelan equine encephalitis (VEE) initially causes serious illness, associated with severe malaise and an extended recovery time. Dengue (DEN-2) patients usually recover fully within days (< 1% mortality), but some individuals, especially those with prior dengue exposure, may develop dengue hemorrhagic fever (DHF). Therefore, the time when an individual is exposed, the incubation period, and the time of manifestation of the illness are crucial to designing diagnostic and therapeutic strategies.
In the post-genomic period, it is no longer unrealistic to hope that the examination of host responses, by
interro-gating large numbers of genes, could reveal unique responses to the various BTA. However, there are a number of obstacles yet to be overcome. Various patho-gens may affect different tissues or cells that may not be available for diagnostic purposes. For example, botuli-num toxins target neuromuscular synapses and cholera toxin aims for intestinal epithelial cells. As a first step toward the goal, we focused on gene expression changes in human peripheral blood mononuclear cells (PBMC) since they could be readily obtained from an exposed individual, thus taking advantage of their "reconnais-sance" role. We carried out in vitro exposure to each of 8 biological threat or infectious agents. We confirmed the in vitro results by using peripheral blood mononuclear cells (PBMC) from nonhuman primates (NHP) exposed to a bacterial pathogen (Bacillus anthracis) or, separately, to a toxin (SEB) at various time points post-exposure to com-pare findings in vitro to those seen in vivo. We have identi-fied host gene expression patterns that can discriminate exposure to various BTA, even at early time periods when flu-like symptoms occur.
Methods
For the in vitro studies, the bacterial pathogens used were
Bacillus anthracis, Yersinia pestis, Brucella melitensis; toxins: SEB, CT, BoNT-A; viruses: VEE and DEN-2.
We isolated RNA from human lymphoid cells after expo-sure and analyzed the gene expression patterns induced by these agents using cDNA arrays. We have not amplified our message for gene array analysis in order to avoid PCR-mediated bias.
Bacterial strain and growth conditions
Y. pestis
Y. pestis KIM5 Pgm negative mutant bacteria (Laboratory stock) were grown on Brain Heart Infusion (BHI, Invitro-gen, Rockville, MD) agar plates 30°C for 48 h. Pre-culture of Y. pestis bacteria were grown in BHI broth at 26°C over-night in shaker incubator at 180 rpm and were diluted 1/ 25 in fresh BHI medium. The organism was then grown at 26°C for 5 h (OD 600 ~0.5) and used for infection. To determine the MOI we counted serial dilutions of the bac-terial culture by plating on (BHI) agar plates followed by incubation at 30°C for 48 h.
B. anthracis
plates were inoculated with B. anthracis Ames spores and incubated overnight at 35°C. Several isolated colonies were transferred to a sterile screw capped tube containing 5 ml of sterile PBS. NSM plates (New sporulation medium: per liter added Tryptone; 3 grams. Yeast extract; 3 grams. Agar; 2 grams. Lab Lemco agar; 23 grams. 1% MnCl2·4H2O; 1 ml) (150 × 25 mm Petri plate) was
inoc-ulated with 200 μl of prepared cell suspension. These plates were incubated for 48 hrs at 35°C, then checked for sporulation progress by microscopic examination. Con-tinued incubation at room temperature was performed until free refractive spores constituted 90–99% of total suspension. Spores were then harvested from plates using 5 ml of sterile water. Spores were then washed 4 times in sterile water. Spores were checked for purity by plating 10
μl in triplicate onto 5% SBA plates and incubating over-night @ 35°C. Enumerations of spores were calculated via CFU/ml (determination of viable spores) and also for actual spores/ml using Petroff Hauser chamber.
B. melitensis
B. melitensis 16 M strain was grown in shaker flasks over-night in Brucella broth at 37°C, plated on Brucella agar for 48 h at 37°C to obtain confluent growth. Bacteria were scraped from plates in pyrogen-free, sterile 0.9% NaCl for irrigation (saline), washed twice, concentration adjusted in saline to the appropriate OD600.
Venezuelan Equine Encephalitis Virus (VEE)
The Trinidad (Trd) strain used in these studies is a virulent virus of the epizootic IA/B variety of VEEV and was origi-nally isolated from the brain of a donkey. Virus was diluted to an appropriate concentration in Hank's buff-ered saline solution containing 1% fetal bovine serum.
Dengue 2 Virus
DV-2 was grown and propagated in mycoplasma-free Vero cell lines. The viral titer was determined by limiting dilution plaque assays on Vero cells. All virus stocks and culture supernatants used in the present study were free from LPS and mycoplasma [6].
Isolation of cells from Human PBMC using elutriation methods
Leukopheresis units were obtained from volunteer donors using the procedures outlined in our approved human use protocol, reviewed by the established Institutional Review Board at WRAIR. The written informed consent document was provided to the volunteers in advance of the proce-dure.
We obtained PBMC (74 blood draws over a period of ~2.5 years, and collected from ~8–10 AM to minimize variabil-ity) from healthy human volunteers who had been screened to be HIV and Hepatitis B negative, were from
19–61 years of age and both male and female. Human monocytes and lymphocytes of peripheral blood mono-nuclear cells were purified from leukopacks of healthy donors by centrifugation over lymphocyte separation medium (Organaon Tecknika, NC). Monocytes and lym-phocytes were then further purified by counter flow cen-trifugation-elutriation with pyrogen-free, Ca2+- and Mg2+
-free phosphate-buffered saline as the eluant. The resulting monocytes and lymphocyte preparations had greater than 95% viability. Monocytes and lymphocytes were mixed in the ratio 1:4 and were used immediately. Cell cultures were maintained in RPMI media at 37°C.
Exposure of monocytes and lymphocytes to the various pathogenic agents
Lymphoid cells were then exposed to a pathogenic agent under conditions (dose, exposure time) deemed optimal for biological activity for each agent by the pathogen spe-cialist. The multiplicity of infection (MOI) of the bacteria or viruses to lymphoid cells was as follows: anthrax spores (1 or 3), VEE (1 or 3), DEN-2, (0.2 or 1), Brucella (2), and plague (20). Following a 30-min infection period cells were washed once with Hanks Balance Salt Solution (HBSS, Invitrogen, Rockville, MD). Both uninfected and infected cells were maintained in RPMI Medium 1640 with 10% human AB serum at 37°C 5% CO2 for the dif-ferent time periods post exposure. Cells were harvested and total RNA isolated using Trizol reagent (Invitrogen, Carlsbad, CA).
The bacterial toxins, CT (3 nM), SEB (100 ng/mL), and BoNT-A (1 nM), were added to newly plated cells in flasks for the time period specified. Cells, incubated in the absence and presence of the toxins, were collected by cen-trifugation. Trizol™ (Invitrogen, Carlsbad, CA,) was added to the cells for RNA isolation and the cells were frozen at -70°C until use.
RNA isolation and cDNA arrays
RNA was isolated according to the Trizol method (Invitro-gen, Carlsbad, California) followed with DNAse digestion [7]. The custom cDNA slides contained ~10,000 genes (Additional file 2). Stratagene reference RNA was labeled with Cy3 and used to compare with RNA (Cy5) from either control or exposed samples. RNA was labeled using Micromax-TSA labeling kits (Perkin Elmer, Boston, MA), hybridized and scanned in an Axon scanner. GenePix 3.0 (Axon) was used to analyze the scanned image. For stud-ies using Human cDNA membranes (Clontech Laborato-ries, Palo Alto, California), RNA samples were labeled with radioactive 33P. After washing, the blots were
Statistical analyses and data scrutiny
We have adhered to "MIAME" (minimum information about microarray experiments) for all our studies. For each pathogen, 3–6 successive time periods were studied and for each time period, data from 2–4 separate experi-ments were obtained and, using the data from these mul-tiple experiments, 2-way ANOVA analysis were carried out. GeneSpring version 5.0 (Silicon Genetics, San Carlos, CA) and Partek Pro 5.0 (St. Charles, MO) were used to vis-ualize and analyze the data. Welch's ANOVA (p < 0.05) was performed followed by Benjamini Correction [8] for various sets of data, to find genes that varied significantly across samples and to identify patterns of gene regulation in PBMC exposed to various pathogens. For custom microarrays, we used the scatter plot smoother, Lowess algorithm [9], to normalize for dye bias among samples. We filtered the array data at 2 steps. In the first step, data filtration allowed only elements for which intensities in both channels were above twice background intensity. In the second step, elements that had intensities below twice the background intensity in one channel only were set at twice background levels. Last, to identify patterns of gene
expression among different pathogens, k-means and self-organizing map clustering analyses were performed. Complete linkage hierarchical clustering of an uncentered Pearson correlation similarity matrix was also applied using the Eisen Cluster software [10], and the results were visualized with the program TreeView. We have used the major dataset (data from Figure 1b) as a training set to apply a class prediction method (GeneSpring 6.1) that uses the k-nearest neighborhood algorithm to classify blinded samples used as test sets.
Feature selection, computation and classification
Extracting discrete data: We applied the Greedy algorithm approach (46).
For each of the 8 pathogens at each time point evaluated (29) (where a condition is the combination of a pathogen and a time interval), we compute for each gene a regula-tion type which is a nonempty subset of {U, D, S}. For a given condition and gene, the regulation type contains U (respectively D, S) if for at least one array for that condi-tion, using either sum or median normalization
tech-(a) B. anthracis exposure to PBMC from 3 different donors
Figure 1
(a) B. anthracis exposure to PBMC from 3 different donors. Data shown are from exposures at 2, 4, 8 and 24 h. Data from each exposure time period were separately evaluated in order to identify common trends among the three donors (males, ages 61, 41, and 27 years old (respectively) with diverse ethnicity). (b). Comparisons of gene profiles for 8 pathogenic agents. Human PBMC were exposed to each of these pathogenic agents for at least 3 appropriate time periods. RNA was isolated, and the reverse transcript hybridized to cDNA arrays. Unique gene patterns were induced by BTAs. Cluster diagram of gene expres-sion patterns use Gene Spring analysis to illustrate groups of genes that show discriminatory patterns for various threat agents. These genes were compared for their expression patterns across all agents and time points. Red is up regulated, blue is down regulated and black is no change compared to the control sample. The expression patterns illustrate how one can differentiate pathogenic agents by selection of sets of gene expression patterns for examination. (Gene accession ID numbers, rather than gene names, are all provided legibly in the graphs of Additional files).
Agent Plague , Time 4 Agent Plague , Time 8 >1.3 in 4 of 25
Agent Anthrax , Time 2 Agent Anthrax , Time 4 Agent Anthrax , Time 8 Agent Bot , Time 2 Agent Bot , Time 6 Agent Bot , Time 24 Agent Bru , Time 2 Agent Bru , Time 6 Agent Bru , Time 24 Agent DEN , Time 4 Agent DEN , Time 8 Agent DEN , Time 24 Agent Plague , Time 1 Agent Plague , Time 2
Agent SEB , Time 3 Agent SEB , Time 6 Agent SEB , Time 12 Agent SEB , Time 18 Agent VEE , Time 1 Agent VEE , Time 4 Agent VEE , Time 8
A B C D E F G H
Anthrax 2 Anthrax 4 Anthrax 8 Bot 2 Bot 6 Bot 24 Brucella 2 Brucella 6 Brucella 24 Dengue 4 Dengue 8 Dengue 24 Plague 1 Plague 2 Plague 4 Plague 8 SEB 3 SEB 6 SEB 12 SEB 18 VEE 1 VEE 4 VEE 8
Time Donor Time Donor
niques and either difference or ratio criteria, the gene appears to be up regulated (respectively down regulated, stay the same). Thus we model both variation between donors and experimental error. The regulation type {U, D} is treated as if it were {U, D, S}; i.e. we consider it to provide no information.
Ordering the genes: For each value of n, we would like to select the n genes which best distinguish between the 29 conditions. Since this is an intractable task, we compute an approximation by ordering the genes according to a heuristic, and for each n, choose the first n genes from the list. There are two straightforward greedy approaches to generating such a list. In the grow approach we start with an empty list and at each step add the gene that gives the new list with the best discrimination power. In the shrink approach we generate the list in reverse order by starting with the full set of genes and removing the one that that leaves the remaining set with the best discrimination power.
We estimate the discrimination power of a set of genes by computing an integer vector of length 812, containing an entry for each of the 29 × 28 ordered pairs of distinct con-ditions, which itself is a sum computed over all genes in the set. The values summed are the number of elements in the regulation type for the first condition of the pair that do not occur in the regulation type for the second condi-tion. This vector is then sorted least element first. To com-pare the discrimination power of two gene sets, their vectors are computed and compared lexicographically, with larger vector considered to correspond to the gene set with better discrimination power. The first 50 genes to be ranked by this method are listed in the Additional file 3.
In vivo anthrax exposure
Animal work was conducted in compliance with the Ani-mal Welfare Act and other federal statutes and regulations relating to animals and experiments involving animals and adheres to principles stated in the Guide for the Care and Use of Laboratory Animals, NRC Publication, 1996 edition. Nine anthrax-naïve rhesus macaque NHPs were exposed to approximately 8 LD50 of B. anthracis spores (Ames strain) by a head-only aerosol exposure system. Blood was drawn before exposure to determine baseline values. After exposure, 3 animals were euthanized at each 24, 48 and 72 h and blood taken for various analyses, including gene response patterns. A full necropsy was per-formed to collect biological samples for use in B. anthracis diagnostic assay development.
Primer set design
Primer sets were designed for selected genes for expression profile confirmation. Additional file 4 lists the accession
numbers and sequences for both sense and antisense primers.
Real-time PCR
Total RNA from the all the pathogenic agent studies was reverse-transcribed simultaneously using the same master mix. The cDNA was then used to perform real-time PCR using BIORAD I cycler and the light cycler DNA master SYBR green I kit (Roche Diagnostics, Indianapolis, Indi-ana). The 18S gene was used as an endogenous control to normalize the HIF-1, GBP, and C5AR genes. Serial 10-fold dilutions of lymphoid cDNA were used to determine the PCR efficiency of each primer set. The slope value was applied to the formula E = 10-1/m - 1 where m = slope
value. The Ct (threshold cycle) values for all the genes were converted to fold change using the formula (1 + E)ΔCt, where E denotes the efficiency of the primer set for
a gene. ΔCt denotes the difference between the Ct values of control and treated samples of a given gene. (Personal Communication, C. Baker, National Institutes of Health)
Results
Host gene expression in vitro
Microarray analysis was carried out at 3–6 time periods post exposure of PBMC to each pathogen or vehicle. Prior studies [11] showed specific gene sets related to sex, age and other parameters, therefore it was important to first identify genes that are normally variant among healthy humans. Data from only the control samples of these healthy donors were subjected to ANOVA (p =< 0.05) and 6% of the genes varied widely among the individuals who were healthy human donors. These genes that showed inconsistent expression profiles were excluded from fur-ther comparisons among the data sets from both control and exposed samples. This provided a baseline to confi-dently identify transcriptional responses induced by bac-teria (anthrax, plague, Brucella), toxins (CT, SEB, BoNTA), or viruses (Dengue, VEE). Expression ratios of 10,000 genes on the custom array (accession numbers of which are listed in Additional file 2) and genes (Additional file 5) in Human Atlas 1.2 were determined by comparing the levels of mRNA in control and pathogen-treated PBMC paired for each exposure time frame. Each measurement was carried out at least 3 times.
Consistency of responses
Unique gene patterns induced by BTAs
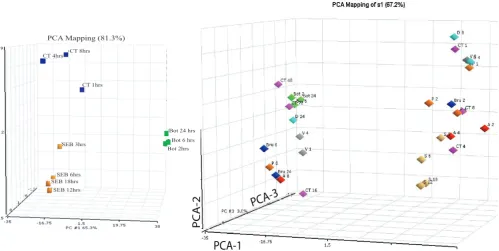
The gene responses were dissected to identify sets of genes that will differentiate one agent from another based on the patterns of host gene induction. The GeneSpring (Sil-icon Genetics, California) clustering diagram illustrates gene expression patterns that can discriminate among the various pathogenic agents (Fig. 1b) by identification of sets of genes where up regulation (red) and down regula-tion (blue) is seen for specific pathogens. The combina-tion of these selected genes can be the foundacombina-tion for designing specific diagnostic assays for exposure to one or more agents. For example, gene sets A and B (column labels at the bottom of the dendogram), differentiate B. anthracis from all other pathogenic agents except Dengue; gene sets F and G readily illustrate expression patterns that differentiate gene responses to these 2 pathogenic agent. Similarly, gene sets D and E and H show host responses to SEB that are distinguishing; BoNTA and VEE show similar patterns with gene sets A and B, but are readily separated by gene set C. Principal component analysis (PCA) (Fig. 2a) illustrates clustering relationships that show marked differences in overall gene patterns among the 3 toxins used in this study. Additionally, gene patterns for the ear-liest exposure for SEB or CT clustered less closely with the later exposure times (Fig. 2b), but when observed relative to all pathogens, the four exposure time periods for SEB
were relatively closely clustered. A striking observation (Fig. 2b) is that for all pathogens except SEB, the longest exposure times differ markedly from the clusters of the early time periods. For B. anthracis, Y. pestis, B. melitensis, and CT, those late exposure times cluster together for these various pathogens. This loss of pathogen-specific responses in vitro after lengthy exposure was not seen for the in vivo studies.
Use of training and test data sets for classifying test exposures
[image:6.612.57.556.418.669.2]To determine whether the microarray data obtained in this study can be used to predict the exposure type of an uncharacterized sample or condition, we applied a super-vised learning method for class prediction (GeneSpring) that uses the k-nearest neighbor algorithm. When algo-rithm was applied on the data set (training set) to predict the exposure type of a data set obtained from an exposure to Y. pestis (test set), we were able to correctly predict the type of exposure with a p < 0.02. We previously reported that a set of predictor genes was identified when samples from exposures of piglets to SEB were used as test sets [12,13].
PCA relational analysis to show how the gene profiles (various exposure times) cluster for each toxin (a) and the relationship among the various pathogens (b)
Figure 2
PCA relational analysis to show how the gene profiles (various exposure times) cluster for each toxin (a) and the relationship among the various pathogens (b). Human PBMC were exposed to each of these pathogenic agents for at least 3 appropriate time periods. RNA was isolated, and the reverse transcript hybridized to cDNA arrays.
CT 8hrs CT 4hrs
CT 1hrs
Bot 24 hrs
Bot 2hrs Bot 6 hrs
SEB 6hrs SEB 18hrs
SEB 12hrs SEB 3hrs
PCA Mapping (81.3%)
PCA-2
PCA-1
Functional classification of genes differentially regulated
Gene ontological analysis was carried out for the genes that were differentially expressed. Comparison of gene responses, based on functional similarities, not surpris-ingly, showed many up regulated genes coding for inflam-matory mediators (Fig. 3). We clustered and sorted the differentially expressed genes by their functional classifi-cation. These functional classifications are depicted in Fig-ure 3. For gene group (i) "Growth Factor, Cytokines & Chemokines," anthrax, Brucella and SEB showed major up regulation of most genes coding for inflammatory media-tors; the other 5 agents had mixed or modest effects. Sim-ilarly, categories (iii) "Interleukins and Interferon Receptors" and (iv) "Interleukins" showed up regulation by most pathogens, notable exceptions being the viruses. Down regulated genes, though seen extensively through-out the study, displayed functional clustering for each pathogenic agent such as (ii) "Homeostasis & detoxifica-tion," (v) "Ligand-gated ion channels," and so forth. Plague induced high levels of interleukin-6, macrophage inflammatory protein-1 beta, tumor necrosis factor-alpha (TNF-α), and granulocyte macrophage colony stimulating
factor (GM-CSF) when compared with Brucella and anthrax. Not surprisingly, the superantigen SEB displayed kinetic patterns for over expression of interferon-γ, IL-2, IL-6, MIP-1α, and GM-CSF (Fig. 3). There are major differ-ences in expression of death receptors, homeostasis, and caspases, examples of which include defensins and certain oxidases (homeostasis) that are down regulated by plague and SEB (Fig. 3, bullet ii). A large number of transcription factors are down regulated by anthrax, Brucella, and SEB, but plague consistently down regulated the widest range of these genes.
Gene responses induced by BTAs in vivo; comparison with
in vitro changes
To determine gene changes induced by BTAs in an animal model, NHP were exposed to B. anthracis spores by aero-sol challenge. This model has been characterized previ-ously to mimic inhalation anthrax in humans. Blood samples were collected 24 h, 48 h, and 72 h post exposure (by 72 h the NHP were beginning to show signs of the ill-ness, which progresses very rapidly to lethality). The gene expression profiles for in vitro exposure of PBMC to
[image:7.612.117.487.367.674.2]Functional categories of genes that show similarities and differences between these pathogens
Figure 3
anthrax spores were compared with those found in iso-lated PBMC at various time periods from NHP. Even by 24 h, a robust response was observed (Fig. 4a), showing up regulation of genes coding for proteases; proteosome components c2, c3, c5; various cytokines; pro-apoptotic genes; cyclic adenosine monophosphate (cAMP)-related kinases, cAMP regulated transcription factors; and hypoxia inducible factor-1 (HIF-1). Down regulated genes included tyrosine kinases, cytokine receptors, growth tors, and adenosine diphosphate (ADP) ribosylation fac-tors. Comparison of the in vivo results with the in vitro
changes induced by anthrax (Fig. 4b), showed remarkable similarities in gene patterns. Clearly many more changes were observed in vivo than in vitro. Certain surface antigens showed significant alteration that was unique to anthrax exposure. Diagrams were constructed to identify sets of
genes that were up regulated (Fig. 5) at either 24 (blue) or 72 h (red); other gene sets showed up regulation at both time periods (center of graph, genes in both blue and red). Similarly, certain gene sets showed unique and common down-regulation patterns (far right, Fig. 5).
A few genes were selected that showed changes induced by
B. anthracis exposure were confirmed by RT-PCR, and the level of expression was compared both in vitro and in vivo
after anthrax exposure. The in vivo/in vitro trends were very similar for many genes including IL-6 (Fig. 6a) and Trans-ducin beta-1 subunit (GNB1) (Fig. 6b). Altered regulation of that G-protein was not seen with the other pathogenic agents. In an experiment of SEB exposure to NHP (Fig. 7), IL-6 and guanylate binding protein GBP-2 were up regu-lated (6- and 65-fold, respectively) by 30 min
[image:8.612.56.554.302.663.2]post-expo-Comparison of host gene responses in vivo and in vitro exposures to anthrax
Figure 4
Comparison of host gene responses in vivo and in vitro exposures to anthrax. Gene expression profiles in PBMC from healthy human donors exposed to anthrax spores in vitro were compared with gene expression patterns obtained in PBMC taken at 24, 48 and 72 hr after exposure of NHP to anthrax spores by aerosol challenge. (a) Gene cluster analysis of significantly altered genes in vivo. (b) comparison of gene expression profile between in vivo and in vitro exposures.
A.
sure and the increased expression persisted through 24 h (the last time point tested, data not shown). Among all the pathogens studied so far, SEB was found to be the only pathogen to dramatically alter GBP-2.
Evaluating the gene selections
In order to evaluate the quality of the set of genes selected by the two methods above, a set of 10 simulated samples was generated for each condition by randomly choosing a set of values consistent with the conditions regulation types. Sets of samples in which values had a 10%, 20%, 30%, 40% and 50% chance of being chosen at random were also generated. Each test sample was then classified using the chosen set of genes by scoring it against each of the 29 conditions. A condition scored 1 for every gene on which its regulation type was consistent with the sample. The test sample was considered to be classified correctly if the condition from which it was originally generated had the unique highest score. The results using the list of genes obtained by the "grow" (respectively "shrink") method are shown in Figure 8.
Comparison of gene selection approaches: Because there is overlap between the gene types for some pairs of condi-tions, there must exist a sample consistent with some con-dition that cannot be classified correctly as that concon-dition. Nevertheless for the generated data, both approaches obtained perfect classification at the 20% noise level for selections of between 150 and 775 genes. Even at the 30% noise level the grow method achieved perfect classifica-tion with 297–305 genes and the shrink method achieved perfect classification with 340–342 genes. Interestingly, in the added noise cases, gene selections above a certain size start to perform worse. This is because removing genes that play little role in distinguishing between conditions removes added noise without removing much discrimina-tion power.
We have used simulated random noise perturbing the input data samples, since we had no prior basis to assume any specific bias in noise (direction or subset of genes). If noise levels on a given sample were for some reason biased toward the identified patterns of some other
dis-Clustered sets of genes to illustrate stage-specific vs. commonly expressed genes for in vivo exposures of NHP at 24, 72 h or at both time periods
Figure 5
Clustered sets of genes to illustrate stage-specific vs. commonly expressed genes for in vivo exposures of NHP at 24, 72 h or at both time periods.
-80 -60 -40 -20 0 20 40 60
ease for that subject, our technique will not perform as well as it does against random noise. Since at this point possible bias or coloration of the noise is unknown, we experimented with a range of noise levels, including levels well higher than the total noise experienced in modern gene expression platforms.
Gene profiles to discriminate control from infected lymphoid cells
To identify common gene profiles that existed among all these individual donors, we used GeneSpring to identify shared baseline expression levels of genes examined for 75 control samples. As these control datasets were sub-jected to various analyses, after excluding normally vary-ing genes, we noticed genes that were expressed at low levels in the control samples but were significantly overex-pressed in response to one or more pathogens. We selected genes that showed a dramatic change in expres-sion level and could be used to discriminate among the pathogens. Gene profiles from two pathogens are shown with BoNT-A (Fig. 9a) or B. melitensis (Fig. 9b) in which the indicated genes readily differentiated it from the other 7 BTAs. Although some of these genes were slightly up reg-ulated by one or more of the other pathogens, even those few genes illustrate the possibilities of distinguishing BoNT-A or B. melitensis from each of the other 7 patho-gens.
Confirmation of gene changes by real-time PCR
To further confirm the expression levels of a few selected genes, we performed semi-quantitative real-time PCR using the same RNA samples isolated from lymphoid cells that had been exposed to the various pathogenic agents/ vehicle and used to carry out the microarray experiments. Gene expression for 3 selected genes are compared based on real-time PCR along with gene array results. Expression of GBP-2, which was significantly up regulated by expo-sure of lymphoid cells to SEB (~10-fold by this technique vs. 6-fold from the microarray analysis), was not altered by any other pathogenic agents studied. Also up regula-tion was observed for HIF-1 and C5AR by BoNTA and CT and there was good agreement with data from the micro-array studies (Fig. 10).
Discussion
The objective of this study was to use host gene expression responses to aid in detection of exposure to biological threat agents, we aimed to a) discriminate among various pathogenic agents that start with similar flu-like symp-toms [14] yet lead to severe illness by various routes (Additional file 1) select sets of genes that can convinc-ingly be used to differentiate normal from exposed sam-ples c) identify sets of genes that could be used for very early detection of exposure or estimating stage of illness post-exposure and d) continue to characterize similarities
Confirmation of selected gene changes by RT-PCR with in vitro and in vivo samples for IL-6 (a) and Transducin beta-1 subunit, GNB1, (b)
Figure 6
Confirmation of selected gene changes by RT-PCR with in vitro and in vivo samples for IL-6 (a) and Transducin beta-1 subunit, GNB1, (b).
and differences in host responses for in vitro exposures to show some predictability for host gene profiles in NHP models that replicate the illness induced in humans. In another study, we found sets of genes from SEB exposures
in vitro also were predictive of in vivo responses in a piglet model of SEB-induced lethal shock [12].
The approach depends on circulating lymphoid cell mRNA responses reflecting a historical record (by their mRNA responses) of encounters with pathogenic agents. Use of unique gene patterns for diagnosis has been shown for certain cancers [15-17]; another study showed that var-ious pathogens induced unique gene responses in lym-phocytes [18] and in dendritic cells [19]. To minimize variability as reported [11] in baseline gene expression among donors, in our study blood was collected at the same time of the day for all donors. Of the 8 pathogenic agents in this study, most have been characterized as hav-ing rapid effects on lymphoid cells [14,20]. For BoNT-A and VEE, the primary target tissues are inaccessible, although VEE has been shown to interact with lymphoid cells [21]. The gene expression data suggest that pathogen binding to specific receptors on the human PBMC initi-ates a series of events that contribute to the ultimate ill-ness, producing host responses indicative of a particular pathogenic agent (Additional file 6) or showing common
responses typical of a severe inflammatory reaction (Fig. 3).
The kinetics of the course of the infection and the disease process is essential in the study of gene changes induced in the host by these pathogens (Additional file 6). Upon inhalation of Y. pestis by NHP, infected alveolar macro-phages migrate to the liver and spleen [22,23] where they proliferate rapidly (~24 h). It is thought that LPS from the bacterial cell wall of Y. pestis (Gram-negative) induces cir-culatory collapse and widespread organ failure, leading to death within days [24]. SEB, CT, and LPS can induce rapid onset of illness (even less than 1 h), involving loss of reg-ulation of vascular tone, vascular leakage and end-stage organ failure, in 1 to 3 days [14,25,26]. B. anthracis
(Gram-positive) is transmitted as spores, which, upon inhalation, become engulfed by macrophages and trans-ported to lymph nodes [20,27-31]. Upon production of a sufficient bacterial load, flu-like symptoms occur fol-lowed by sudden onset of respiratory distress, progressive shock, and death. As recent events have demonstrated, with cases of inhalation anthrax, treatments initiated after patients became seriously symptomatic can be marginally successful [27]. In this study, host gene expression responses in NHP to B. anthracis exposure were seen at the earliest time point examined, 24 h (Fig. 4b). In contrast, in these same NHP, a sufficient pathogen load to be iden-tified by culture techniques did not occur until day 3 and clinical diagnosis would not be possible until ~ day 4–5, much too late to initiate reliably effective treatments.
Studies of pathogenesis show up regulated cytokine genes as a common response for many pathogens [14,32] and that would not, necessarily, distinguish among them (Fig 3). Therefore, we focused on host responses that may potentially identify stage-specific targets and can also serve as early diagnostic markers. The regulation of certain early genes is transient and may relate to factors that par-ticipate in recruitment of monocytes to the sites of infec-tion. The genes that are expressed late relate to DNA damage-inducing proteins, hypoxia-inducible proteins, and proteases. Characterization of apoptosis as a result of exposure was reported for SEB, DEN-2 [33], plague [34], and anthrax [20,27,35] in numerous cell types, including those of lymphoid origin. We observed induction of apoptotic genes by these agents in our studies (Additional file 6). In contrast, Brucellae is known to inhibit apoptosis in their mononuclear phagocytic host cells [36] and we also observed pro-apoptotic genes to be down regulated by Brucella. In regard to the findings with plague expo-sure, it is important to note that these infections occurred under conditions that limit the ability of Yersinia outer proteins (YOP) to alter host cell physiology by down reg-ulation of cytokines [34] and oxygen radicals [37] in cal-cium-free cultures of macrophages. We observed up
Expression of GBP-2 and IL-6 genes after in vivo SEB expo-sure of NHP for 30 min
Figure 7
Expression of GBP-2 and IL-6 genes after in vivo SEB expo-sure of NHP for 30 min. Gene expression profiles in PBMC from NHP exposed to SEB for 30 min. RNA samples were isolated and used in the PCR assays using primers specific for IL-6 and GBP-2.
regulation of certain cytokines after 1–2 hr of exposure to
Y. pestis and a pattern of gene expression that can explain reduced synthesis of oxygen radicals. We suspect that dif-ferent biochemical mechanisms contribute to pathogene-sis when YOPs are produced [38,39].
In contrast to common infectious diseases, human cases of exposure to some of the biological threat agents are rare. Indeed, for certain of these pathogens, there is no appropriate animal model that replicates the illness as it appears in humans. Furthermore, dose effects and other variations suggest the need to investigate in vitro
approaches that show some correlations to in vivo find-ings. For in vivoB. anthracis studies, PBMC from the spore-exposed animals was collected 24, 48, and 72 h. The in vitro study utilized PBMC (from healthy donors) exposed to spores for various time periods. We found many more gene expression changes in vivo than in vitro, perhaps because in vivo changes include both primary and second-ary responses. Comparisons of in vitro/in vivo results showed similarities in genes that code for lymphoid receptors/signaling pathways that, when taken as a group, showed a pattern specific for B. anthracis and include a
G-protein Transducin beta subunit (GNB1), cAMP related genes, Calmodulin regulated genes, cytokines and MAPKK (mitogen activated protein kinase kinase), some of which had previously been reported in response to anthrax exposures [40]. Not unexpectedly, genes coding for cytokines showed similarities in vitro vs in vivo (Fig 5 and 6). Our microarray data were in accordance with recent reports by Pickering et al. that showed up regula-tion of some of the cytokines in response to infecregula-tion by
B. anthracis spores including TNF-α, IL-8, IL-1β, GM-CSF, IFN-γ and IL-6 [41]. However, these genes, alone, would not necessarily distinguish anthrax from other pathogens. In general, the genes expressed by 4 h in vitro and 72 h in vivo were similar and correlated to the symptoms that appear after progression of inhalation anthrax in NHP.
Aerosol challenge of SEB in NHPs up regulated (65-fold) the gene coding for interferon-regulated GBP-2 (Fig. 7) but in vitro (Figure 10) it was up-regulated 10-fold. In vivo, GBP-2 upregulation occurred by 15 min post exposure. Other pathogens showed minor or no effects on the expression of that particular G-protein (Figure 10). This may not be surprising in light of seminal studies showing
[image:12.612.94.515.95.361.2]Ordered genes and resulting percentage correct classifications
Figure 8
that CT and pertussis toxin work through different gua-nine triphosphate (GTP)-binding proteins to regulate intracellular cAMP levels [42,43]. This study confirmed gene expression responses induced by CT, anthrax, and
Brucella that are known participants in regulation of ade-nylyl cyclase as well as those relating to ADP ribosylation factor [44-46] (Additional file 6). We observed a down
regulation of the host adenylyl cyclase but an up regula-tion of cAMP-related genes upon anthrax exposure in NHP samples (Figure 4a). Because B. anthracis has its own adenylyl cyclase, it may be playing a role in affecting cAMP-related genes of the host [29,47].
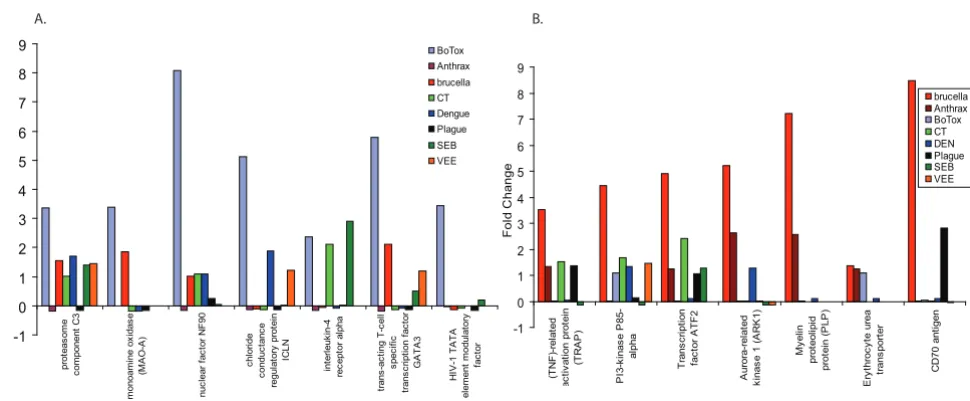
Expression patterns of genes that were at baseline levels in all controls and showed unique expression patterns in (a) BoNT-A exposures or (b) B. melitensis exposures compared to all 8 pathogens
Figure 9
Expression patterns of genes that were at baseline levels in all controls and showed unique expression patterns in (a) BoNT-A
exposures or (b) B. melitensis exposures compared to all 8 pathogens.
-1 0 1 2 3 4 5 6 7 8 9 pr ot eas om e c o m ponent C 3 m onoam in e ox idas e (M A O -A ) nuc lear f a c tor N F 90 ch lo ri d e c o nduc ta nc e regul at or y pr ot ei n IC L N in te rl e u k in -4 rec e pt or al pha tr ans -ac ti ng T -c e ll sp e ci fi c tr ans c ri pt io n f a c tor GA T A 3 HI V -1 T A T A el em ent m odul a to ry fa c to r Fol d C h ange BoTox Anthrax brucella CT Dengue Plague SEB VEE -1 0 1 2 3 4 5 6 7 8 9 (T NF )-re la te d ac ti v at ion pr ot ei n (T RA P ) P I3-k inas e P 85-al pha T rans c ri pt ion fa c to r A TF2 A u ro ra -re la te d k inas
e 1 (
A R K 1) My e lin pr ot eol ipi d pr ot ei n ( P LP ) E ry thr oc y te ur ea tr ans por ter C D 7 0 ant igen F o ld C h ange brucella Anthrax BoTox CT DEN Plague SEB VEE
A. B.
[image:13.612.67.552.87.287.2]Real-time PCR determination of gene expression in response to each of 8 pathogenic agents
Figure 10
Real-time PCR determination of gene expression in response to each of 8 pathogenic agents. Primers were designed for these 3 genes and 18S, which was used as a reference gene for comparison of these 3 test genes. GBP-2 was a gene that was identi-fied as being massively up regulated by SEB using differential display PCR (Mendis, et al) and was of particular interest to us.
-6 -4 -2 0 2 4 6 8 10 12
HIF C5AR GBP-2
Since most biothreat pathogen exposures start with flu-like symptoms, discriminating them from common path-ogenic illnesses for early diagnosis at a treatable stage is one of the critical issue. Even though these 8 pathogens initially cause similar symptoms, such as malaise, fever, headache, and cough, unique sets of genes are induced by each and can be related to the course of illness [14] (Addi-tional files 1 and 6). Using these signature gene profiles to assess possible exposure to pathogenic agents or to differ-entiate them from non-lethal illnesses, when the classical identification of a pathogen is not conclusive, has the potential to fill a gap in the arsenal of diagnostic tools.
Conclusion
Rapid detection, before the symptoms appear or even at various stages of illness offers the opportunity to initiate stage-specific therapeutic approaches to ameliorate the devastating results of these pathogenic agents. The use of host genomic markers offers an option to differentiate classes of pathogen exposure, gauge severity of impending illness and apply appropriate therapeutic strategies.
1Genes were selected and their expression profiles
com-pared with gene array and real-time PCR. 18S was used as a reference gene for comparison of these 3 test genes.
2GBP-2 was a gene that was identified as being massively
up regulated by SEB using differential display PCR (C. Mendis, et al).
nd = not determined
Competing interests
The authors declare that they have no competing interests.
Authors' contributions
RD and RH drafted the manuscript, performed the genomic analysis, data mining and the apoptosis studies. GVL; BK; XH; CP; MJ; LS; NK; DH and LL carried out the exposures to the various pathogens. SE and PL partici-pated in the statistical analysis of the microarray data. PR; AD; AM; CM; CC; AR; SP and RN participated in the microarray studies for the different pathogens. MJ con-ceived of the study, and participated in its design and coordination. GVL; DY and EH participated in the design and coordination on the study. All authors read and approved the final manuscript.
Disclaimer
Material has been reviewed by the Walter Reed Army Insti-tute of Research. There is no objection to its presentation and/or publication. The opinions or assertions contained herein are the private views of the author, and are not to be construed as official, or as reflecting true views of the Department of the Army or the Department of Defense.
Additional material
Additional file 1
Comparison of time course of progression of illness for selected BTAs and pathogens: Graph courtesy of COL George Korch, USAMRIID, Ft. Det-rick, Maryland. Hatched marks indicate onset of flu-like symptoms (fever, headache, chills) for each agent, X indicates time frame in which death usually occurs (case fatality rate, CFR), and the number of Xs suggest the degree of lethality if untreated early in the course of illness. (i) The toxins (yellow bars) cause onset of acute illness within a few hours, but side effects can persist for many weeks. (ii) Bacterial BTAs (pink bars) follow different time course after infection ranging from days to weeks. Many bacterial infections begin with flu-like symptoms, but proceed to respira-tory distress and lethal shock within ~ a week. In contrast, a prolonged ill-ness is common in brucellosis, which is caused by Gram-negative bacteria
(B. melitensis. B. suis, and B. abortus) that are highly infectious via
aerosol route. (iii) Viruses (green bars) VEE and DEN infections each progress differently because VEE can proceed to the meninges of the brain, developing into encephalitis. In the case of dengue, the incubation period is 3 to 15 days, with the acute febrile illness lasting 3–5 days. The period of mortality is associated with cessation of the febrile illness or with sec-ondary complications in DHF.
Click here for file
[http://www.biomedcentral.com/content/supplementary/1471-2334-8-104-S1.eps]
Additional file 2
A list of genes on the custom array. This table shows a list of the genes that are present on the microarrays used in this study.
Click here for file
[http://www.biomedcentral.com/content/supplementary/1471-2334-8-104-S2.pdf]
Additional file 3
List of the first 50 genes that were selected using the Grow/Shrink method. This table lists the genes that passed the statistical analysis using the Grow/Shrink method.
Click here for file
[http://www.biomedcentral.com/content/supplementary/1471-2334-8-104-S3.pdf]
Additional file 4
List of the accession numbers and sequences of the primer sets used in this study.
Click here for file
[http://www.biomedcentral.com/content/supplementary/1471-2334-8-104-S4.pdf]
Additional file 5
Lists the genes of the Clontech 1.2 human array.
Click here for file
Acknowledgements
This work was supported by the Defense Advanced Research Projects Agency (DARPA) and by the Defense Threat Reduction Agency, Project Number: G0020_04_WR_B.
References
1. Gibb TR, Norwood DA Jr, Woollen N, Henchal EA: Viral
replica-tion and host gene expression in alveolar macrophages infected with Ebola virus (Zaire strain). Clin Diagn Lab Immunol
2002, 9:19-27.
2. Henchal EA, Teska JD, Ludwig GV, Shoemaker DR, Ezzell JW:
Cur-rent laboratory methods for biological threat agent identifi-cation. Clin Lab Med 2001, 21:661-678.
3. Hurtle W, Lindler L, Fan W, Shoemaker D, Henchal E, Norwood D:
Detection and identification of ciprofloxacin-resistant Yers-inia pestis by denaturing high-performance liquid chroma-tography. J Clin Microbiol 2003, 41:3273-3283.
4. [http://www.cdc.gov/ncidod/dbmd/diseaseinfo/].
5. Guarner J, Shieh WJ, Greer PW, Gabastou JM, Chu M, Hayes E, Nolte
KB, Zaki SR: Immunohistochemical detection of Yersinia
pes-tis in formalin-fixed, paraffin-embedded pes-tissue. Am J Clin Pathol
2002, 117:205-209.
6. Sun P, Celluzzi CM, Marovich M, Subramanian H, Eller M, Widjaja S,
Palmer D, Porter K, Sun W, Burgess T: CD40 ligand enhances
dengue viral infection of dendritic cells: a possible mecha-nism for T cell-mediated immunopathology. J Immunol 2006,
177:6497-6503.
7. Das R, Dhokalia A, Huang XZ, Hammamieh R, Chakraborty N,
Lin-dler LE, Jett M: Study of proinflammatory responses induced
by Yersinia pestis in human monocytes using cDNA arrays.
Genes Immun 2007, 8:308-319.
8. Glantz SA, Slinker BK: Primer of Applied Regression and Analysis of
Vari-ance New York: McGraw-Hill; 1990.
9. Yang YH, Dudoit S, Luu P, Lin DM, Peng V, Ngai J, Speed TP:
Nor-malization for cDNA microarray data: a robust composite method addressing single and multiple slide systematic vari-ation. Nucleic Acids Research 2002, 30:e15-e15.
10. Eisen MB, Spellman PT, Brown PO, Botstein D: Cluster analysis
and display of genome wide expression patterns. Proc Natl
Acad Sci USA 1998, 95:14863-14868.
11. Whitney AR, Diehn M, Popper SJ, Alizadeh AA, Boldrick JC, Relman
DA, Brown PO: Individuality and variation in gene expression
patterns in human blood. Proc Natl Acad Sci USA 2003,
100:1896-1901.
12. Hammamieh R, Bi S, Das R, Neill R, Jett M: Modeling of
SEB-induced host gene expression to correlate in vitro to in vivo responses. Biosens Bioelectron 2004, 20:719-727.
13. van Gessel YA, Mani S, Bi S, Hammamieh R, Shupp JW, Das R,
Cole-man GD, Jett M: Functional piglet model for the clinical
syn-drome and postmortem findings induced by staphylococcal enterotoxin B. Exp Biol Med (Maywood) 2004, 229:1061-1071.
14. Franz DR, Jahrling PB, Friedlander AM, McClain DJ, Hoover DL, Bryne
WR, Pavlin JA, Christopher GW, Eitzen EM Jr: Clinical recognition
and management of patients exposed to biological warfare agents. Jama 1997, 278:399-411.
15. Bayani J, Brenton JD, Macgregor PF, Beheshti B, Albert M,
Nallain-athan D, Karaskova J, Rosen B, Murphy J, Laframboise S, Zanke B,
Squire JA: Parallel analysis of sporadic primary ovarian
carci-nomas by spectral karyotyping, comparative genomic hybridization, and expression microarrays. Cancer Res 2002,
62:3466-3476.
16. Li S, Ross DT, Kadin ME, Brown PO, Wasik MA: Comparative
genome-scale analysis of gene expression profiles in T cell lymphoma cells during malignant progression using a com-plementary DNA microarray. Am J Pathol 2001, 158:1231-1237.
17. Sorlie T, Perou CM, Tibshirani R, Aas T, Geisler S, Johnsen H, Hastie
T, Eisen MB, Rijn M van de, Jeffrey SS, Thorsen T, Quist H, Matese JC,
Brown PO, Botstein D, Eystein Lønning P, Børresen-Dale AL: Gene
expression patterns of breast carcinomas distinguish tumor subclasses with clinical implications. Proc Natl Acad Sci USA
2001, 98:10869-10874.
18. Boldrick JC, Alizadeh AA, Diehn M, Dudoit S, Liu CL, Belcher CE,
Botstein D, Staudt LM, Brown PO, Relman DA: Stereotyped and
specific gene expression programs in human innate immune responses to bacteria. Proc Natl Acad Sci USA 2002, 99:972-977.
19. Huang Q, Liu D, Majewski P, Schulte LC, Korn JM, Young RA, Lander
ES, Hacohen N: The plasticity of dendritic cell responses to
pathogens and their components. Science 2001, 294:870-875.
20. Friedlander AM: Anthrax: clinical features, pathogenesis, and
potential biological warfare threat. Curr Clin Top Infect Dis 2000,
20:335-349.
21. MacDonald GH, Johnston RE: Role of dendritic cell targeting in
Venezuelan equine encephalitis virus pathogenesis. J Virol
2000, 74:914-922.
22. Campbell GL, Dennis DT: Plague and other Yersinia infections.
In Harrison's principles of internal medicine 14th edition. Edited by:
Kasper DL ea. New York: McGraw Hill; 1998:975-983.
23. Guarner J, Shieh WJ, Greer PW, Gabastou JM, Chu M, Hayes E, Nolte
KB, Zaki SR: Immunohistochemical detection of Yersinia
pes-tis in formalin-fixed, paraffin-embedded pes-tissue. Am J Clin Pathol
2002, 117(2):205-209.
24. Inglesby TV, Dennis DT, Henderson DA: Plague as a Biological
Weapon. Jama 2000, 283:2281-2290.
25. Hashimoto PH, Takaesu S, Chazono M, Amano T: Vascular leakage
through intraendothelial channels induced by cholera toxin in the skin of guinea pigs. Am J Pathol 1974, 75(1):171-180.
26. Jett M, Das R, Cummings C, Mendis C, Neill R, Hoover D, Lindler L,
Paranavitana C, Huang X, Ludwig G: Identification Of Changes In
Gene Expression Induced By Toxic Agents: Implications for Therapy And Rapid Diagnosis. NATO: Operational Issues in Chem-ical and BiologChem-ical Defense Human Factors in Medicine Panel; Estoril, Por-tugal 2001 in press.
27. Jernigan JA, Stephens DS, Ashford DA, Omenaca C, Topiel MS,
Gal-braith M, Tapper M, Fisk TL, Zaki S, Popovic T, Meyer RF, Quinn CP, Harper SA, Fridkin SK, Sejvar JJ, Shepard CW, McConnell M, Guarner J, Shieh WJ, Malecki JM, Gerberding JL, Hughes JM, Perkins BA,
Anthrax Bioterrorism Investigation Team: Bioterrorism-Related
Inhalational Anthrax: The First 10 Cases Reported in the United States. Emerg Infect Dis 2001, 7(6):933-44.
28. Friedlander AM: Tackling anthrax. Nature 2001, 414:160-161.
29. Baillie L, Read TD: Bacillus anthracis, a bug with attitude! Curr
Opin Microbiol 2001, 4:78-81.
30. Friedlander AM: Tackling anthrax. Nature 2001, 414:160-161.
31. Harrison LH, Ezzell JW, Abshire TG, Kidd S, Kaufmann AF:
Evalua-tion of serologic tests for diagnosis of anthrax after an out-break of cutaneous anthrax in Paraguay. J Infect Dis 1989,
160:706-710.
32. Jett M, Ionin B, Das R, Ramamoorthy P, Neill R: Enterotoxins. In
The Encyclopedia of Molecular Medicine Volume 5. Edited by: Creighton TE. New York: John Wiley & Sons, Inc; 2002:1170-1174.
33. Lei HY, Yeh TM, Liu HS, Lin YS, Chen SH, Liu CC:
Immunopatho-genesis of dengue virus infection. J Biomed Sci 2001, 8:377-388.
34. Cornelis GR: Molecular and cell biology aspects of plague. Proc
Natl Acad Sci USA 2000, 97:8778-8783.
35. Grinberg LM, Abramova FA, Yampolskaya OV, Walker DH, Smith JH:
Quantitative pathology of inhalational anthrax I: quantita-tive microscopic findings. Mod Pathol 2001, 14:482-495.
Additional file 6
Comparisons of gene profiles for 8 pathogenic agents. Cluster analysis of gene expression profiles of PBMC exposed to the 8 pathogens. Human PBMC were exposed to each of these pathogenic agents for appropriate time periods, and the results are sorted based on functional responses, rather than clustering of similar gene expression patterns. RNA was iso-lated, reverse transcribed and hybridized to cDNA arrays. Red bars indi-cate up regulation, green bars show down regulation of the genes, and selection of genes for significance is defined in methods. The numbered bullets (right margin of the figure) indicate families of genes showing sim-ilarities or unique properties. Gene accession numbers are shown to the left of the figure.
Click here for file
Publish with BioMed Central and every scientist can read your work free of charge
"BioMed Central will be the most significant development for disseminating the results of biomedical researc h in our lifetime."
Sir Paul Nurse, Cancer Research UK
Your research papers will be:
available free of charge to the entire biomedical community
peer reviewed and published immediately upon acceptance
cited in PubMed and archived on PubMed Central
yours — you keep the copyright
Submit your manuscript here: BioMedcentral
36. Gross AA, Terraza A, Ouahrani-Bettache S, Liautard JP, Dornand J: In
vitro Brucella suis infection prevents the programmed cell death of human monocytic cells. Infect Immun 2000, 68:342-351.
37. Charnetzky WT, Shuford WW: Survival and growth of Yersinia
pestis within macrophages and an effect of the loss of the 47-megadalton plasmid on growth in macrophages. Infect Immun
1985, 47:234-241.
38. Rohrbach S, Olthoff A, Laskawi R, Giefer B, Gotz W: Botulinum
toxin type A induces apoptosis in nasal glands of guinea pigs.
Ann Otol Rhinol Laryngol 2001, 110:1045-1050.
39. Alderton JM, Ahmed SA, Smith LA, Steinhardt RA: Evidence for a
vesicle-mediated maintenance of store-operated calcium channels in a human embryonic kidney cell line. Cell Calcium
2000, 28:161-169.
40. Getano V, Lorenzo B, Giorgio N, Michele M, Casare M:
Susceptibil-ity of mitogen-activated protein kinase kinase family mem-bers to proteolysis by anthrax lethal factor. Biochem J 2000,
352:739-745.
41. Pickering AK, Osorio M, Lee GM, Grippe VK, Bray M, Merkel TJ:
Cytokine response to infection with Bacillus anthracis spores. Infect Immun 2004, 72:6382-6389.
42. Spiegel AM: Defects in G protein-coupled signal transduction
in human disease. Annu Rev Physiol 1996, 58:143-170.
43. Ogino Y, Sakamoto Y, Kinouchi T, Shimizu N: Thrombin
stimu-lates pertussis toxin-sensitive and -insensitive GTPase activ-ities and ADP-ribosylation of G(i) in human neuroblastoma SH-EP. Pharmacology 2000, 61:11-13.
44. Hoover DL, Friedlander AM, Rogers LC, Yoon IK, Warren RL, Cross
AS: Anthrax edema toxin differentially regulates lipopolysac-charide-induced monocyte production of tumor necrosis factor alpha and interleukin-6 by increasing intracellular cyclic AMP. Infect Immun 1994, 62:4432-4439.
45. Guzman-Verri C, Chaves-Olarte E, von Eichel-Streiber C,
Lopez-Goni I, Thelestam M, Arvidson S, Gorvel JP, Moreno E: GTPases of
the Rho subfamily are required for Brucella abortus internal-ization in nonprofessional phagocytes: direct activation of Cdc42. J Biol Chem 2001, 276:44435-44443.
46. Vaughan M, Moss J: Activation of toxin ADP-ribosyltransferases
by the family of ADP-ribosylation factors. Adv Exp Med Biol
1997, 419:315-320.
47. Little SF, Leppla SH, Burnett JW, Friedlander AM:
Structure-func-tion analysis of Bacillus anthracis edema factor by using monoclonal antibodies. Biochem Biophys Res Commun 1994,
199:676-682.
Pre-publication history
The pre-publication history for this paper can be accessed here: