R E S E A R C H
Open Access
Assessing the social vulnerability to malaria
in Rwanda
Jean-Pierre Bizimana
1*, Emmanuel Twarabamenye
1and Stefan Kienberger
2Abstract
Background:Since 2004, malaria interventions in Rwanda have resulted in substantial decline of malaria incidence. However, this achievement is fragile as potentials for local malaria transmissions remain. The risk of getting malaria infection is partially explained by social conditions of vulnerable populations. Since vulnerability to malaria is both influenced by social and environmental factors, its complexity cannot be measured by a single value. The aim of this paper is, therefore, to apply a composite indicator approach for assessing social vulnerability to malaria in Rwanda. This assessment informs the decision-makers in targeting malaria interventions and allocating limited resources to reduce malaria burden in Rwanda.
Methods:A literature review was used to conceptualize the social vulnerability to malaria and to select the appropriate vulnerability indicators. Indicators used in the index creation were classified into susceptibility and lack of resilience vulnerability domains. The main steps followed include selection of indicators and datasets, imputation of missing values, descriptive statistics, normalization and weighting of indicators, local sensitivity analysis and indicators aggregation. Correlation analysis helped to empirically evidence the association between the indicators and malaria incidence.
Results:The high values of social vulnerability to malaria are found in Gicumbi, Rusizi, Nyaruguru and Gisagara, and low values in Muhanga, Nyarugenge, Kicukiro and Nyanza. The most influential susceptibility indicators to increase malaria are population change (r = 0.729), average number of persons per bedroom (r = 0.531), number of
households affected by droughts and famines (r = 0.591), and area used for irrigation (r = 0.611). The bed net ownership (r =−0.398) and poor housing wall materials (0.378) are the lack of resilience indicators that significantly correlate with malaria incidence.
Conclusions:The developed composite index social vulnerability to malaria indicates which indicators need to be addressed and in which districts. The results from this study are salient for public health policy- and decision makers in malaria control in Rwanda and timely support the national integrated malaria initiative. Future research development should focus on spatial explicit vulnerability assessment by combining environmental and social drivers to achieve an integrated and complete assessment of vulnerability to malaria.
Keywords:Malaria, Social vulnerability, Composite indicator, Sensitivity analysis, Rwanda
* Correspondence:jpbizimana@nur.ac.rw 1
College of Science and Technology, Geography Department, University of Rwanda, PO Box 212, Butare, Rwanda
Full list of author information is available at the end of the article
Background
In Rwanda, malaria is mesoendemic in the lowlands and hypo-endemic in highlands. Malaria is a public health concern in Rwanda because the entire population of is at risk for malaria [1], including an estimated 2.2 million children under five years of age and 443,000 pregnant women [2]. Nearly 63% of the country is epidemic-prone, while the remaining of the country is characterized by a stable and endemic malaria transmission. Malaria trans-mission occurs throughout the year with two peaks in rainy seasons. In addition to climate suitability, other fac-tors that influence malaria transmission, including human settlements near the marshlands, internal population movement and migrations, cross-border movement of people and irrigation schemes [3].
In 2005, the Government of Rwanda benefited from US Presidential Malaria Initiative (PMI) to reduce malaria-related deaths in Africa. In Rwanda, PMI is expanding coverage of insecticide-treated mosquito nets (ITNs), in-door residual spraying (IRS) with insecticides, and prompt use of artemisinin-based combination therapy (ACT) for malaria treatment [1]. These interventions resulted in sub-stantial decline in malaria transmission. For example, after falling down between 2006 and 2008 owning to an in-crease in ITNs coverage, malaria inin-creased again 2009 be-cause of limited coverage with ITNs. The number of malaria cases declined again in 2010 following an ITN dis-tribution campaign [4]. This achievement is, however, fra-gile as potentials for local malaria transmission remain. The entire population is at risk particularly children aged under five years and pregnant women [5]. Highland com-munities suffer from epidemic malaria attributed to low immunity [6]. Despite the decreasing malaria through intensified interventions in Rwanda, the environmental changes induced by high population pressure might ex-pose the highland populations to an increase risk of malaria and its epidemic particularly if the current in-terventions are not sustained [7].
A study in the southern Rwanda highlands revealed that asymptomatic malaria was associated with low so-cial conditions and ineffective use of bed nets in local communities [8]. Failure to sustain malaria control and reduction in bed nets use may result in malaria resur-gence in Rwanda [9]. For instance, an upsurge of malaria incidence in 2009 was linked to a short delay in bed net provision [10]. This demonstrates the fragility of pro-gress made and the need to maintain malaria control despite decreasing malaria in Rwanda [9].
The declining malaria provides new challenges for its elimination, including for example the resistance of mal-aria vectors to insecticides and livelihood activities that increase exposure to mosquito bites [11]. With intensive use of bed nets, immunity to malaria would develop more slowly under the reduced transmission, leading to
a longer period of susceptibility [12]. A declining malaria transmission in Rwanda may therefore impair the devel-opment of immunity, which would increase the popula-tions vulnerability to severe malaria if the control measures are not maintained [13]. Because of population movements and migrations, malaria is imported from endemic areas to low-transmission areas. Land use changes are clustering malaria where populations share the same social and environmental factors [14], such as high population densities and pressure associated with land use changes and economic activities which increase mosquito breeding sites [15]. Therefore, approaches to malaria reduction need to be aligned with these changes by adopting new strategies [16].
Recently, an integrated vector management strategy was adopted in Rwanda as a framework for interventions based on local ecology, malaria epidemiology and social factors [1]. IVM strategy targets multiple vectors and different ecological and socio-economic settings. To be effective, IVM strategy should encompass environmental modifications through infrastructural development and sanitation services to regulate not only the vectors, but also the mosquito biting exposure. Additionally, IVM should improve public health and quality of life while minimizing the social disparities [17]. The spatial assess-ment of social vulnerability to malaria is, therefore, a well-timed support to the IVM initiative related to pub-lic health improvement and social disparities among the populations at risk of malaria infection.
other factors that shape the health of individuals or community, such as rural housing, food security and employment [21]. The reduction of malaria burden re-quires, therefore, an integrated design of interventions that are placed within the broader social context of mal-aria transmission and incidence.
While the vulnerability to malaria is a multidimen-sional concept encompassing both environmental and social factors, its complexity cannot be measured by a single indicator value. The aim of this paper is to apply an integrated composite indicator approach for assessing the social vulnerability to malaria in Rwanda, independ-ent of the spatial distribution of malaria based on a purely statistical approach and a composite indicator ap-proach. Contextually, the social vulnerability to malaria encompasses a broader social context of malaria inci-dence in addition to environmental factors of malaria transmission. It reflects the predisposition of the popula-tions or individuals to malaria infection and theirs ability to mitigate the risk of malaria. The results from this study indicate the most vulnerable districts in Rwanda as a combination of susceptibility to not withstand mal-aria infection and lack of resilience to anticipate, to cope with or to recover from malaria episodes in Rwanda.
The social vulnerability to malaria in Rwanda is timely supporting the national integrated malaria initiatives, which seek to improve the efficacy, effectiveness and sustainability of malaria control interventions through the inter-sectors collaboration, resources allocation and health infrastructure development [1]. This assessment is also intending to pro-vide information on vulnerability indicators that should be given priority in targeting intervention strategies and allo-cating limited resources in order to reduce the existing susceptibilities, strengthen community resilience, and thus reduce malaria burden in Rwanda.
Methods
Conceptual setting
Vulnerability is a well-documented concept in the fields of disaster risk reduction and climate change adaptation [22,23]. Vulnerability to natural hazards refers to the conditions determined by physical, social, economic, and environmental factors that increase the susceptibility of a community to hazards [24]. Füssel [25] stressed the need of an integrated approach for climate change vul-nerability assessment which would also consider non-climatic factors. In line with an integrative approach towards vulnerability assessments, the European-funded research project MOVE (Methods for the Improvement of Vulnerability Assessment in Europe) identified key factors and dimensions that need to be addressed [23]. The MOVE vulnerability framework considers society and environment as a coupled system between environ-ment, hazard and society. The core elements in MOVE
framework are exposure, susceptibility and lack of re-silience. Vulnerability is further characterized by dif-ferent scales (local, regional, national) and dimensions (environmental, ecological, social, economic, institu-tional, cultural) [26].
While the MOVE framework is oriented towards nat-ural hazards and climate change adaptation, some com-mon features can emerge when assessing the social vulnerability to vector-borne diseases like malaria. Re-cently, there has been growing recognition that social and cultural factors significantly influence the distribution of health and illness, and that issues of inequity affect how disease incidences are distributed and treated [27]. From an international perspective, public health community in-volved in malaria reduction is also increasingly receptive to broader and more encompassing definitions of the mal-aria problem. The biomedical community is expanding its vision on malaria because existing tools of known efficacy to anticipate mosquito bites and cope with malaria infec-tion may be of limited value because of social barriers to their effective implementation [28]. Moreover, ignoring the social determinants of malaria is likely to allow public decision- and policy-makers to concentrate on malaria mosquitoes and not to be concerned with thorny prob-lems of poverty and inequalities in health care facilities, access to health treatment, distribution of land and capital resources that play also a key role in malaria incidence [21,29]. Packard presented the similar argument when highlighting that it is an unlikely possibility to eradicate malaria by only distributing mosquito nets, while sanita-tion is not ensured. The burden of malaria cannot be re-duced by simply attacking anopheline mosquitoes and malaria parasites. Rather, removing the barriers that pre-vent people from achieving and maintaining health is also an imperative task that can help to combat malaria from multiple fronts [20]. Consequently, there is a need to move away from a narrow biomedical approach which viewed malaria as a problem of mosquitoes, parasites and vector control activities toward a more integrated perspec-tive which is tied to social conditions that increase the rates of malaria morbidity and mortality [29].
reducing total health burden than approaches aimed at underlying causes of differential vulnerability given the high poverty rates in most malaria endemic regions [31]. This was also supported by Jones and Williams, when advocating for a comprehensive approach for diseases control. In their discussion on social burden of malaria, they urge for taking a broader social perspective to mal-aria burden and advocate for a shift to integrated de-signs of interventions that are placed within the broader social, cultural, political and economic context [18].
In the assessment of vulnerability to diseases, there is a growing literature which defines the vulnerability to malaria based on biological and disease-related factors, such as age, pregnancy and immunity [32-34]. Other studies go beyond individual behaviour or characteris-tics, to larger-scale social and economic conditions, be-cause some societies have been more successful in addressing malaria disease than others [35]. In line with this integrative assessment of social vulnerability to mal-aria, this study is drawn on a holistic risk and vulnerabil-ity framework which was developed by Kienberger and Hagenlocher in the context of vulnerability to vector-borne diseases [36]. Figure 1 shows the adopted and ap-plied framework of the domains of social vulnerability to malaria and examples of relevant indicators.
Based on recent publications by Kienberger and Hagenlocher [36] and Hagenlocheret al.[37], the vul-nerability to malaria is defined as the predisposition of the population to malaria burden. It is characterized by
different interrelated domains, generic and biological susceptibility, and lack of resilience. The distinction between generic and biological factors pre-disposing a community to malaria burden versus those that deter-mine its ability to anticipate responding to, to cope with or to recover from malaria burden should be rele-vant for decision makers [36,38].
[image:4.595.54.538.467.707.2]Vulnerability assessments often employ indicators to better reflect complexity and real-world information into a format that is relevant for decision-making. Despite their alleged weaknesses, composite indicators provide an essential tool at the science–policy interface [39]. The use of composite indicators is an important way to municate and monitor the vulnerability, and allows com-parisons to be made across different geographical areas [40]. By combining social and environmental indicators, geographic variations of vulnerability to malaria can be illustrated. The vulnerability map can, therefore, indicate the relative levels of vulnerability, where there is uneven capacity for preparedness and response, and where re-sources might be used effectively to reduce prevailing vulnerability. This provides information to decision-makers for targeting vulnerable populations while improving their resilience [41]. While recognizing that vulnerabil-ity is a multidimensional and dynamic condition at dif-ferent spatial and temporal scales, there is a need to assess how social drivers influence the vulnerability to malaria among the districts of Rwanda using a compos-ite indicator approach.
Selection and justification of indicators
One of the key parts of this study is the selection of rele-vant indicators for assessing the social vulnerability to malaria. Guided by the vulnerability framework, 19 indi-cators have been identified. Table 1 shows vulnerability domains, indicators used and their corresponding weight from principal component analysis (PCA) and informa-tion on sources of datasets as well.
Generally, high density and population pressure in highlands results in limited land resources and increases human susceptibility to diseases [42]. This is relevant for Rwanda highlands, where demographic pressure has sig-nificantly modified the local environment during the past decades [15]. Swamps were reclaimed by agriculture to feed an ever-increasing population. Water require-ments for irrigation have led to modifications of surface waters [43]. Since malaria incidences are rooted in liveli-hood activities which interplay with the ineffective use and non-use of bed nets [44], irrigation-based agricul-tural practices may increase the susceptibility to malaria infection [45]. These environmental changes are likely to influence malaria incidence if adequate protection
measures are not implemented in nearby communities [46]. In additionally, high population density and pres-sure have significantly influenced the environmental degradation and declining landholdings [47,48], which have pushed people to settle near unsuitable sites with more exposure to mosquito bites [15].
Populations with little immunity may move into malaria-prone areas where they are more vulnerable [49]. The Rwandan population increased in past decades from ap-proximately 2.6 million in 1960 to 8.2 million in 2002 and 10.6 millions in 2012 [50]. This was accompanied by en-vironmental degradation and decreasing landholding size, pushing people to settle near unsuitable sites with more exposure to mosquito bites [15]. The resettlement of non-immune people in endemic zones was accompanied by sporadic malaria epidemics [51].
[image:5.595.59.539.383.706.2]The household size is often associated with malaria in-cidence [52]. The more people are sleeping together in the same room, the higher the probability of spreading infection to a new person. Below a certain threshold number of persons sleeping together, infection rates drop below the replacement rate and disappear even
Table 1 Malaria vulnerability indicators
Domain Sub-domains Indicators Proxies Sign Source Weights
Susceptibility Generic susceptibility Population pressure Population density in sq km + NISR 2012 0.087
Population change 2002-2012 + NISR, 2012 0.056
Population movements Number of arriving populations + EICV3 2011 0.126
Households size Average number of persons per
bedroom
+ EICV3 2011 0.050
Livelihoods Land area used for irrigation + EICV3 2011 0.081
Poverty index Number of poor populations + DHS 2010 0.134
Biological susceptibility Pregnancy Women of child-bearing age + NISR 2012 0.110
Age Number of children under five years + NISR, 2012 0.113
Number of population above 65 years - NISR, 2012 0.060
HIV HIV prevalence in adults aged 15-49 + DHS2010 0.120
Malnutrition % of households affected by drought
and famines
+ EICV3 2011 0.064
Lack of resilience Capacity to anticipate mosquito biting exposure
Education level Low literacy rate + DHS, 2010 0.133
Housing condition Number of households in poor housing wall materials
+ DHS2010 0.162
Number of households in poor housing roof materials
+ DHS2010 0.200
Access to media Households without radio + DHS2010 0.113
Households without mobile phone + DHS2010 0.127
Protection measures Number of households without bed nets
+ DHS, 2010 0.113
Capacity to cope/recover Access to health services Number of health facilities - MoH 0.086
Nurse ratio to population + MoH 0.085
without other control measures. The threshold is likely crossed when the average household size drops below four persons [53]. Moreover, the increasing number of persons per room results in improper use of bed nets and increased probability of being infected by malaria parasites.
From biological perspective, the susceptibility to mal-aria reflects the efficiency with which an infective mos-quito infects humans. It is a function of immunity which depends on age, pregnancy or co-infection with other diseases [32]. Pregnant women and children under five years of age are more susceptible to severe malaria since women’s immunity is temporarily reduced during preg-nancy, while the immune system of small children is not fully developed [54]. When HIV and malaria co-infect, a severe malaria should be expected [55]. In non-pregnant women, HIV was found to roughly double the risk of malaria by impairing the immune response and decreas-ing the ability to withstand malaria infection [56], and reducing the efficacy of drugs [57]. A recent study in Rwanda confirmed higher malaria prevalence among HIV-positive, pregnant women [58]. With regard to age, adults would be able to withstand malaria infection be-cause of acquired immunity from previous exposure to mosquito bites [59]. Famines and food shortage induced by drought also result in population movements and mi-gration, increasing exposure to malaria in endemic low-lands, thus rising the malaria incidence in returning population to the highlands [60]. Recurrent drought in Rwanda caused crop failures and food shortages, then threatening the most vulnerable populations with mal-nutrition and famine, especially in the Eastern Province of Rwanda [61].
The lack of resilience relates to the capacity to antici-pate mosquito-biting exposure and to limited access to health infrastructure and means to recover from malaria episodes. This capacity may be influenced by the level of education, awareness about malaria transmission and prevention, and access to protection measures. The cop-ing capacity relates to access to health care services and to adequate and effective treatment [35]. In this study, this encompasses protection measures, housing condi-tions, education level and improved knowledge about malaria which lead to better use of malaria interventions [62]. The use of bed nets is the most accepted protection method against malaria. For bed nets to be effective, coverage must be high, bed nets should be retreated promptly and individuals should properly deploy their bed nets each night. The more households own and use bed nets, the greater the benefit to neighbouring households without bed nets [63]. Indoor residual spray-ing (IRS) application on houses’ walls and roofs and on domestic animal shelters kills the adult mosquitoes that rest on these surfaces. It reduces the longevity
and density of mosquitoes so that they can no longer transmit malaria parasites [64]. Information on IRS was not however factored in this study because the related data was not available for the entire study area. Once this information is available for the entire country, this could additionally reduce uncertainties in vulner-ability assessment.
Poor housing quality provides less protection against mosquitoes [65]. Houses with more malaria-infected children are more likely to have mud walls, open eaves and absent ceilings than those with uninfected children [66]. Despite the significant reductions in malaria trans-mission by high coverage of bed net use in Rwanda, high numbers of host-seeking malaria vectors in rural areas may be found indoors due to poor housing qua-lity. Education levels may influence malaria incidence since it affects the knowledge about malaria preven-tion and control. Over recent years there has been emphasis on that level of education and improved knowledge about malaria leads to better use of mal-aria interventions [62]. Nevertheless, association be-tween malaria and education may be due to its role as a proxy for poverty. Media communication plays a strong role in malaria control to ensure that bed nets are used appropriately [67]. Mobile phone tech-nology is also an efficient method for rapidly detect-ing malaria patients and reduce malaria deaths in remote rural areas [68].
In terms of coping and recovering capacity, the vul-nerability to malaria may be influenced by access to treatment and prompt access to effective malaria treat-ment is central to the success of malaria control world-wide. The Roll Back Malaria partnership has set for 2010 a target of ensuring that 80 percent of those suf-fering from malaria have prompt access to, and are able to correctly use, affordable and appropriate treatment within 24 hours of symptoms onset [69]. A strategy to provide such access should take into account poor pop-ulations in malaria-endemic zones who are particularly inadequately served by the health system [70]. In such areas, convergence of malaria prevalence and poor health care infrastructure can result in high malaria cidence rates. Moreover, primary care facilities are in-creasingly becoming the focal point for distribution of intervention strategies, but physical access to these health facilities may limit the extent to which commu-nities can be reached [71].
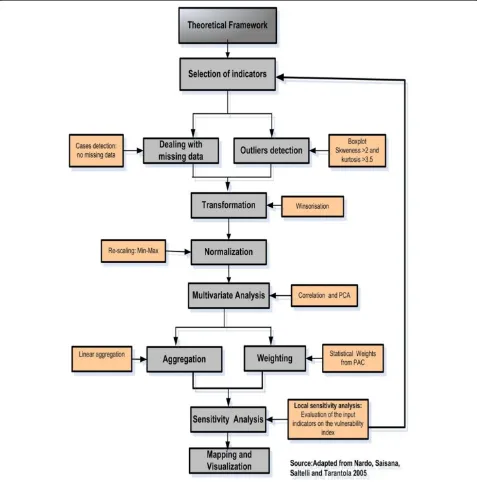
Construction of a composite index of social vulnerability to malaria
imputation of missing data, and descriptive statistics for data exploration (distribution and multicollinearity among indicators, outliers’ detection), data transfor-mation and normalization. The PCA was performed to weight indicators for further aggregation. Prior to ag-gregation and final vulnerability index creation, the local sensitivity analysis was applied to evaluate the influence of indicators on final index. Then Spearman correlation the regression analysis was applied to pro-vide epro-vidence of association between the used indica-tor and malaria at district level by highlighting the
most sensitive indicators. A final composite index of vulnerability was then computed and visualized for each district. Figure 2 illustrates the main steps followed in con-structing a composite index of social vulnerability to malaria.
[image:7.595.59.536.234.716.2]Descriptive statistics were used for each indicator to evaluate the degree of missing data and potential outliers. Skewness with absolute values above 0.2 were taken as highest threshold for multicollinearity to avoid double counting among indicators [73]. Indicators with kurtosis values greater than 3.5 were treated for asymmetric
distribution [74]. Outliers were removed by changing out-liers’ values to next highest/lowest non-outlier number [75]. Afterwards, outlier analysis was re-run to check if all outliers were eliminated [76].
Since indicators were at different measurement scales, standardization was required before their aggregation [77]. Sometimes high‘raw’indicator data values mean low vulnerability, so therefore theses indicators have been transformed to have high values for high vulnerability. The minimum-maximum transformation method was used by accounting for the direction of indicators [78] and using the flowing formula:
V i¼Xi−minXi
max‐Xi direction0:5ð1−directionÞ ð1Þ
Where Vi is equal to the standardized indicator i; Xi represents the indicator value before its transformation; Xi, min is the minimum score of indicator i before its transformation; and Xi, maxas maximum score of indi-cator i before its transformation. All indiindi-cator values were transformed into a relative score ranging from 0 to 1, where higher values imply high vulnerability [74]. A positive sign implies that high indicator values increase the vulnerability (+), while low values decrease the vul-nerability andvice versa.
Prior to PCA, the correlation coefficient matrix of two vulnerability domain indicators was scanned to check for the values greater than 0.92 as an indication of col-linearity as an indication of colcol-linearity [79]. After scan-ning the correlation coefficient matrix, no value greater than this threshold was found. Since many correlation coefficient values were above 0.300, the PCA would yield the acceptable results [80]. The Kaiser-Meyer-Olkin (KMO) criteria and Bartlett’s test were also performed to examine the data suitability for PCA. The general rule is that the overall KMO should be 0.60 or higher to proceed with PCA. The high values for overall KMO for both susceptibility and lack of resilience indicators were
0.655 and 0.615, respectively, meaning that they are ac-ceptable for PCA.
PCA for weighting indicators
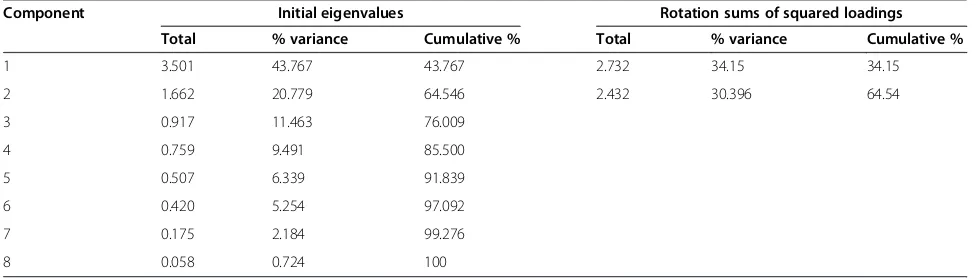
A PCA was used to assign the weights to individual indi-cators based on common variance explained. Using a varimax orthogonal rotation, components with eigen-values larger than one; which contribute individually to overall variance by more than 10%; and cumulatively to more than 60% were chosen [81]. Table 2 illustrates the two extracted components explain 64.54% of total vari-ance for lack of resilience indicators.
As earlier mentioned, components with eigenvalues lar-ger than one, individually contributing to overall variance by more than 10%, and cumulatively by more than 60%, were chosen to weight the individual of indicators. Table 3 shows the highest indicator scores in each component and their weights for each single indicator are highlighted in bold.
The lack of resilience indicators that have the highest squared loading factors in the first principal component are poor housing roof materials, poor housing wall ma-terials, low literacy rate and nurse ratio to populations. The second principal component is heavily loaded by the households without mobile phone, the households without radio, households without bed nets and number of health facilities.
With regard to the susceptibility indicators, three ex-tracted components were able to explain 73.04% of the total variance as shown in Table 4.
The susceptibility indicators with the highest indicator scores in each principal component are highlighted in bold as illustrated in Table 5.
[image:8.595.55.543.594.733.2]The susceptibility indicators that have the highest squared loadings in the first principal component are the number of poor populations, number of arriving pop-ulations, HIV prevalence, and population density. Apart from HIV prevalence, most of the highest scored indica-tors in first principal component are related to generic susceptibility sub-domain. With the exception of the
Table 2 Variance explained for principal component analysis of lack of resilience indicators
Component Initial eigenvalues Rotation sums of squared loadings
Total % variance Cumulative % Total % variance Cumulative %
1 3.501 43.767 43.767 2.732 34.15 34.15
2 1.662 20.779 64.546 2.432 30.396 64.54
3 0.917 11.463 76.009
4 0.759 9.491 85.500
5 0.507 6.339 91.839
6 0.420 5.254 97.092
7 0.175 2.184 99.276
average number of persons per bedroom, the majority of the biological susceptibility sub-domain (children under five years of age, women of child-bearing age, households affected by droughts and famines and elder population above 65 years) dominate the second principal compo-nent. The land area used for irrigation and the population change between 2002 and 2012 have an excessive influ-ence in the last principal component.
Aggregating indicators
Approaches for indicator weighting and aggregation have been subject to debate, but so far no approach is without limitations [82]. Some approaches employ equal weights which ensure transparency and are straightfor-ward, but have been criticized for assignment of implicit equal weights [72]. A study by Hagenlocher et al. [37]
for modeling the vulnerability to disease based on ad-ministrative boundaries concluded expert-based and purely statistical-based modeling approaches reveal simi-lar outputs, indicating that in the absence of local ex-pertise, statistical approaches could be used. The PCA was therefore used since it has the advantage of deter-mining weights which explains the largest variation in original indicators [83]. The weighted sum algorithm was chosen as the most widespread aggregation method. The normalized indicators were first aggregated according to their respective domains. The normalized weighted in-dicators for each domain were summed using the follow-ing formula:
SUS or LoR¼Xm
I¼1WimIij ð2Þ
SUS and LoR represent the value of vulnerability for susceptibility and lack of resilience domains respectively; W refers to the weight of a single indicator in each domain; and I is the normalized value of the indicator. The final composite index was calculated by aggregating the two domains and taking into account the number of indicators in each domain so that the domains grouping the larger number of indicators will have higher weight as follow:
VI¼nd
N ð3Þ
[image:9.595.56.290.111.292.2]Wherenrepresents the number of indicators for a given domain;drefers to the value of each vulnerability domain whileN is equal to the total number of indicators. From nineteen indicators that have been identified from litera-ture, eleven indicators were assigned to susceptibility do-main, and eight indicators to the lack of resilience domain. For easy visualization of the results, the final index values were normalized within a new range from zero to one, where zero reflects a very low and one a very high social
Table 3 Squared loadings after rotation for lack of resilience indicators
Lack of resilience indicators Components Weights Scaled weights
1 2
Poor housing roof materials 0.808 0.000 0.428 0.1999
Poor housing walls materials 0.656 0.043 0.347 0.1623
Low literacy rate 0.536 0.104 0.283 0.1325
Nurse ratio to populations 0.343 0.193 0.182 0.0849
Households without mobile phone 0.209 0.634 0.272 0.1274
Households without radio 0.167 0.563 0.242 0.1131
Households without bed nets 0.011 0.466 0.201 0.0938
Number of health facilities 0.003 0.428 0.184 0.0860
Sums of squared loadings (VE) 2.733 2.430 2.139 1.000
Total variance 5.164
VE/Total variance 0.529 0.471
The highest squared loadings for lack of resilience indicators in each principal component are high highlighted in bold.
Table 4 Variance explained for principal component analysis of susceptibility indicators
Components Initial eigenvalues Rotation sums of squared loadings
Total % variance Cumulative % Total % variance Cumulative %
1 3.583 32.569 32.569 3.313 30.114 30.114
2 3.202 29.113 61.682 2.877 26.156 56.270
3 1.250 11.363 73.045 1.845 16.775 73.045
4 0.853 7.754 80.799
5 0.712 6.469 87.268
6 0.457 4.155 91.423
7 0.321 2.917 94.340
8 0.238 2.168 96.508
9 0.179 1.628 98.136
10 0.110 0.996 99.132
[image:9.595.59.539.552.733.2]vulnerability to malaria. The higher the values of the vul-nerability index, the more the district is vulnerable.
Sensitivity analysis
Sensitivity analysis evaluates the contribution of indi-vidual sources of the uncertainty to the output. For this study, spearman correlation analysis was first used to validate the appropriateness of using indicators using International Business Machines Corporation SPSS sta-tistics 22.0 for windows software. The general aim was to provide empirical evidence of association between indicators and malaria incidence by highlighting the most appropriate to influence malaria incidence at dis-trict level. In addition to correlation analysis, local sen-sitivity analysis helped to assess the influence of the input vulnerability indicators on the vulnerability index. This was achieved by targeting one construction stage at a time, while all other stages are held constant [84]. Consequently, the use of box plots helped to assess the influence of the input vulnerability indicators by dis-carding one input at the time while keeping all other setting (normalization, weighting and aggregation) equal [85]. This resulted in a series of alternative vulnerability indices. For each district, the alternative index was compared with the reference vulnerability index that takes into account the susceptibility and lack of resili-ence indicators. The results are displayed in the box plots showing the interquartile range, the minimum and maximum values [36]. The larger the interquartile range, the higher is the influence of the respective in-put indicator [85].
Visualization of the results
Because public health decision-makers need the infor-mation on the most vulnerable districts and the social drivers of the vulnerability to malaria, a cartographic visualization method was adopted to translate the vul-nerability index into a geographic map. ESRI ArcGIS10.2 software was used to display and map the final index of social vulnerability to malaria for each district. To ease interpretation of the assessment results, the final vulner-ability index values were normalized within the zero to one range, where zero reflects a very low and one a very high social vulnerability to malaria. The values of the vulnerability index reflect the relative levels of social vul-nerability among the district of Rwanda, which means that an index value of 0.00 does not imply the absence of vulnerability. The developed composite index shows the most vulnerable districts to integrated social indica-tors in terms of susceptibility to not withstand malaria and lack of resilience to anticipate, to cope with or to re-cover from malaria infection in Rwanda.
Results
Vulnerability to malaria and underlying factors
As shown in Figure 3, high values of vulnerability index to malaria are found in Gicumbi (1.00), Rusizi (0.81), Nyaruguru (0.79), Gisagara (0.71), and Burera (0.67), and districts, and low values in Muhanga (0.00), Nyarugenge (0.10), Kicukiro (0.13), and Nyanza (0.17).
[image:10.595.57.540.101.322.2]It is very important know that the vulnerability index values reflect the relative levels of vulnerability, which means that the value of 0.00 does not mean the absence of vulnerability to malaria within the district.
Table 5 Squared loadings after rotation of components for susceptibility indicators
Susceptibility indicators Component Weights Scaled
weights
1 2 3
Number of poor populations 0.776 0.000 0.031 0.320 0.134
Number of arriving populations 0.732 0.001 0.014 0.301 0.126
HIV prevalence in population of 15–49 years 0.695 0.000 0.012 0.286 0.120
Population density 0.505 0.024 0.158 0.208 0.087
Children under five years of age 0.072 0.756 0.003 0.271 0.113
Women of child-bearing age 0.000 0.735 0.005 0.263 0.110
Households affected by droughts and famine 0.151 0.427 0.012 0.153 0.064
Population above 65 years 0.229 0.400 0.149 0.143 0.060
Average number of persons per bedroom 0.063 0.337 0.034 0.121 0.050
Land area used for irrigation 0.024 0.003 0.842 0.194 0.081
Population change 2002-2012 0.067 0.194 0.585 0.134 0.056
Sums of squared loadings (VE) 3.313 2.877 1.845 2.394 1.000
Total variance 8.035
VE/Total variance 0.412 0.358 0.230
The bar charts for the most vulnerable districts in Figure 4 indicate which districts are less resilient, the relative share and contribution of the underlying factors of vulnerability. For lack of resilience domain, the poor housing wall and roof materials and low literacy rate are the main factors that are hampering the capacity of Gicumbi, Ruzizi, Nyaruguru, Gisagara and Nyamagabe districts to anticipate malaria mosquito-biting exposure (Figure 3). The vulnerability of Gicumbi, Nyaruguru and Nyamagabe districts is also exacerbated by the low rate of bed nets ownership low immune highland popula-tions. Because the most vulnerable districts are mostly located in remote rural areas near the borders, access to communication through mobile technology is an imped-ing factor. With regard to capacity to cope with or to re-cover from malaria infection, the limited number of health facilities and insufficient medical personnel call for more improved interventions in Gicumbi, Rusizi and Gisagara districts. In these highland districts prone to epidemics malaria induced by climate change and vari-ability, malaria incidence may combine with limited health infrastructure and poverty to result in high mor-bidity and mortality.
With regard to susceptibility domain, the district of Gicumbi is the most vulnerable because of poverty, high number children under five years of age, high number of child-bearing age women, and high number of elder populations (Figure 5).
district more susceptible are mainly the poverty and demographic pressure.
Influence of input indicators on vulnerability index The composition of susceptibility and lack of resilience was evaluated in terms of their influence on final com-posite indicator of social vulnerability to malaria. The in-fluence of each of the single indicator was calculated by discarding one input at the time while keeping all other all settings remain constant. For susceptibility domain, the results show that the average number of persons per bedroom, elder populations above 65 years, population changes and population density have less impact on final vulnerability index. Conversely, the number of poor pop-ulations, number of arriving poppop-ulations, number of children under five years and women in child-bearing age have an excessive influence on the final composite vulnerability index. In Figure 6, the box plots were used to show the influence of the single indicator on the com-posite vulnerability index.
For lack of resilience domain, the number of holds without mobile phones and the number of house-holds without radio are the less influential indicators.
On the other hand, poor housing wall materials, poor housing roof material, number of households without bed nets have a marked impact of vulnerability index.
Association between the used indicators and malaria incidence
The regression analysis was used to validate the rele-vance of indicators by highlighting the most sensitive to influence malaria occurrence. Table 6 shows the spear-man correlation coefficients between the used indicators and malaria positivity rate for the year 2010.
The susceptibility indicators that are scientifically cor-related with malaria incidence are highlighted in bold. The population change 2002–2012, land area used for ir-rigation, households affected by drought and famine and average number of persons per bedroom have the high correlation coefficient values (r) raining from 0.729 to 0.531. The susceptibility indicators that have low values of correlation coefficient are the number of poor popula-tions, number of arriving populations and, HIV preva-lence and (r value range from 0.018 to 0.130).
[image:12.595.56.541.89.430.2]mosquito feeding on humans in high transmission areas [87]. Owing to population increase in Rwanda, people moved to the lowlands and –malaria endemic districts such as Nyagatare, Gatsibo and Kayonza [88] with an in-creasing vulnerability of non-immune migrants. A moder-ate positive association between the number of persons per bedroom and malaria positivity rate was also found. When household size increases, bed nets are not properly used. Evidence has shown that people sharing a bed net with more than five people are more likely to have malaria than those sharing a bed net with up to two people [89]. The districts with the highest average number of persons per bedroom are Nyagatare, Ngoma and Bugesera. This exacerbates the vulnerability of these most endemic-malaria districts of Rwanda.
A strong relationship between the number of house-holds affected by drought and malaria is not surprising. While prolonged droughts reduce malaria transmission or turn rivers into strings of pools, preferred mosquito breeding sites after short rain, they may also reduce the food security, increase malnutrition and people susceptibil-ity to malaria [90]. The drought-prone districts in Rwanda are Bugesera, Kirehe, Ngoma, Rwamagana, Kayonza,
Gatsibo and Nyagatare, Nyanza, Gisagara, Huye and Rusizi [91]. This relationship between malaria and droughts is justified as the drought–prone districts are also malaria-prone areas.
[image:13.595.56.540.89.414.2]The land area used for irrigation is also strongly corre-lated with malaria due to the creation of vector breeding sites by irrigation projects [51]. Currently, most of the wet-lands in Rwanda are being reclaimed for irrigated crops [92]. A moderate correlation was also found between the number of children under five years and elder populations. The lack of resilience indicators that have the high correlation coefficient values (r) are poor housing wall materials and the bed nets ownership with the correl-ation coefficient values of 0.378 and−0.398 respectively. Once again, the positive association between housing conditions and malaria incidence at district level in Rwanda highlights the need for effective malaria inter-vention that also target the housing improvement in rural areas in addition to bed net provision. Malaria de-creases as the number of households with bed nets in-creases because intense malaria interventions with mass distribution of bed nets led to substantial malaria decline in Rwanda since 2006.
Discussion
The present work was conducted to assess the social vulnerability to malaria in Rwanda independent of the spatial distribution of the disease based on purely statis-tical approach and a composite indicator framework. The results from this study are salient for public health policy- and decision makers in malaria control in Rwanda. This spatial assessment is a well-timed support to the national integrated malaria initiative which to seeks to improve the efficacy, effectiveness and sustain-ability of malaria control interventions through advo-cacy, social mobilization and inter-sectors collaboration to optimize the allocation of limited resources and health infrastructure at national scale level.
By displaying the lack of resilience versus susceptibility to malaria, the adopted approach provides useful infor-mation for decision-makers and a way of communicating the complex interactions between relevant factors of vul-nerability to malaria. Squeezing the complex system of social conditions into a single vulnerability index, the developed approach yields a powerful comparative as-sessment tool capable of capturing societal conditions in a given district that drive people’s vulnerability to mal-aria infection. This has important policy implications as a successful reduction of malaria burden requires
combining the best set of strategies that address the most important vulnerability factors in the most vulner-able districts.
[image:15.595.55.544.99.393.2]By the fact that most of the vulnerable districts are lo-cated in the highlands where unstable malaria transmis-sion would be limited by low temperatures, with the exception of Nyagatare and Bugesera this has an impli-cation for malaria control program in Rwanda. In these low malaria transmission settings, malaria burden is dif-ficult to assess, its impact is significant, and the cost-effectiveness of interventions to predict and respond is doubtful [93]. As an example, malaria epidemics have been reported in Rwanda highlands since 1940s. [94]. Later in the 1980s a steady malaria increase was attri-butable to low immune population movements from Nyarutovu highlands within Nemba Hospital catchment’s area to the lowlands in the East [95]. Likewise, malaria increased during 1983 to 1987 at Gikonko health centre (Gisagara District), as a result of climate warming near altitude limits of malaria transmission [96]. Unexpec-ted rainfall also resulUnexpec-ted in change of malaria patterns in northern Rwanda [95]. In Byumba district hospital catchment’s area in Gicumbi district, a sharp increase of malaria among pregnant women and children was linked to rainfall anomalies in 1998 [97]. It was therefore
Table 6 Correlation between social indicators and malaria incidence
Vulnerability domains Indicators R R2 p value
Susceptibility Population density
Number of arriving populations 0.057 0.003 0.052
Women of child-bearing age −0.401* 0.161 0.766
Children under five years of age −0.437* 0.191 0.028
Population above 65 years −0.382* 0.146 0.016
Population change 2002-2012 0.729** 0.531 0.037
Average number of persons per bedroom 0.531** 0.282 0.000
Households affected by drought and famine 0.591** 0.349 0.003
Number of poor populations −0.018 0.000 0.494
Land area used for irrigation 0.611** 0.373 0.927
HIV prevalence in population of 15–49 years −0.130 0.017 0.000
Number of poor populations 0.018 0.000 0.494
Lack of resilience Number of health facilities −0.049 0.002 0.796
Nurse ratio to populations 0.208 0.043 0.796
Households with bed nets −0.398* 0.158 0.269
Low literacy rate 0.136 0.018 0.030
Households without radio 0.190 0.036 0.473
Households without mobile phone −0.174 0.030 0.314
Poor housing wall materials 0.378* 0.143 0.040
Poor housing roof materials 0.254 0.065 0.040
hypothesized that higher monthly rainfall increased malaria incidence in Byumba highlands, averaging at 2,300 m.
According to Rwanda Ministry of Health, ten border districts have the highest malaria prevalence [98]. The remoteness of rural communities near the borders makes it difficult to provide adequate health services. When border control is inadequate, population’s vulner-ability to malaria increases [99]. Near the border areas, malaria infection may not be linked to location at which population came into contact with infective bite(s) of Anophelesvectors [100]. Although long-term migrations are limited in Rwanda, temporary migrations with a sig-nificant heterogeneity were pointed out by Blumenstock [101], where cross-border movements are responsible for malaria transmission [5]. Consequently, providing adequate health care facilities and appropriate and ef-fective treatment to mobile communities near the bor-ders would be an efficient malaria intervention. Malaria elimination needs to identify those migrant streams in the most vulnerable districts with potential to transport malaria and to target interventions accordingly to pre-vent potential epidemics malaria [102].
Likewise, conflicts are likely to precipitate the move-ment of refugees across borders and disruption of local infrastructure [99]. They amplify the vulnerability to malaria owing to breakdown of health systems, mass population displacements, and resettlement of refugees in camps in malaria prone areas. Figure 7 shows the lo-cation of refugee camps in relation to the levels of social vulnerability to malaria among the district of Rwanda.
In emergency situations, malaria flourishes as a result of breakdown health facilities, displacement of non-immune populations to malaria-prone areas, malnutrition, inappro-priate access to treatments, and lack of approinappro-priate shelter [103]. Since 1996, conflicts have resulted in displacement of refugees seeking sanctuary in Rwanda.
[image:16.595.59.538.379.721.2]Based on recent statistics of the Ministry of Disaster Management and Refugee Affairs in Rwanda, the refugee camps population was estimated to 73,786 until the end of April 2014. The largest camps are Kigeme (18,430), Kiziba (16,461), Gihembe (14,707), Nyabiheke (14,213) and Mugombwa (6,688). As livelihood opportunities are very limited for refugees who generally live in poor hous-ing [104], refugees are more vulnerable to malaria infec-tion. Particular attention should be paid to Mugombwa
refugee camp, which is located in the most malaria-endemic area within the most vulnerable district of Gisagara.
Additionally, it is apparent that high population num-bers for the most vulnerable age groups (children under five years, women in child-bearing age and elder popula-tion) largely explains the susceptibility to malaria in highlands districts. Higher population density and pres-sure in the highland districts result in stressed product-ive land as a result of land fragmentation and declining landholding size, pushing people to settle in unsuitable locations or to migrate to malaria-endemic areas with an increasing human exposure to malaria. In past five years, malaria-endemic districts attracted internal migrants are Kayonza, Gatsibo, Rwamagana, Kirehe, and Bugesera in Eastern Province, but also Gasabo and Kicukiro districts within Kigali [105]. The population increase and high average household size may act as impeding factor for effective use of bed nets in Nyagatare and in Nyaruguru districts [88]. This research finding implies that in re-gions with large households or large populations sharing sleeping room such as refugee camps or worker migra-tion camps near the rice farming areas, the eliminamigra-tion of malaria will require segmenting sleeping quarters into smaller units, such as with mosquito nets.
The low rate of bed nets ownership exacerbates the exiting vulnerability of Gicumbi and Nyaruguru districts. These districts are characterized by low malaria endem-icity justifying the low level of malaria interventions with IRS and LLITNs. However, preventive measures targeted to potential hotspots of malaria transmission in highland districts could effectively help in for preventing epi-demics and highland malaria. In Nyaruguru, Gisagara and Rusizi District, poverty and poor housing conditions suggest that housing characteristics should be consid-ered in malaria interventions to prevent mosquitoes en-tering houses and reduce mosquito-biting exposures. This result is in strong agreement with the fourth popu-lation and housing census report in Rwanda [106] which revealed that the high percentage of households with poor housing walls in Southern Province is a result of poverty in rural populations. The population increase coupled with land use changes through the extensive marshlands reclamation for irrigation in Gisagara and Nyagatare districts should also attract the attention of public health planners [107].
As the area allocated to irrigation is strongly associ-ated with malaria incidence, this has an implication for malaria control program, to take into account the liveli-hood activities which interplay with the ineffective use and non-use of bed nets to increase the vulnerability to malaria. This is more important in the country like Rwanda where marshlands irrigation as adaptation to climate variability and food shortage has favoured the
development of mosquitoes and malaria expansion in highlands [108]. In responding to food shortage, fish ponds in valley bottoms shaped the creation of vector breeding sites [109]. Since 2008, marshland irrigation is being promoted for sustainable food security [110]. Cur-rently, most wetlands in Rwanda are reclaimed for grow-ing rice [93] and rice production increased from 11,949 tons in 2000 to 72,000 tons in 2009 [111]. Rice cropping is a promising solution to food insecurity but also in-creases malaria in local communities [46] as reported by farmers in Cyabayaga and Rugeramigozi wetlands [92]. Association between malaria and marshlands cleaning is also confirmed by the coincidence of spatial distribution of malaria parasite prevalence rate and area affected by irrigation per district as illustrated in Figure 8.
Ijumba and Lindsay [46] argued that irrigation in-creases an unstable malaria transmission, where people have little immunity. The vulnerability of irrigation com-munities may however, be low in some areas owing to better social conditions and farmers’ awareness of bed net use [46]. Planners should consider this opportunity to improve health care facilities when planning marshland irrigation in unstable malaria transmission zones. Inte-grated malaria control and health impact assessments are recommended near irrigation schemes.
uncertainties in vulnerability. Additionally, some indica-tors such as social networks and behavior change are diffi-cult to quantitatively measure in malaria vulnerability assessment and therefore not considered in the in this paper. Finally, future research development should focus on an integrated and spatial explicit vulnerability assess-ment by combining environassess-mental and social drivers is important to achieve an integrated and complete assess-ment of vulnerability to malaria in order to target malaria interventions that are responsive to the needs of the most vulnerable people in Rwanda.
Conclusions
This paper applied a composite indicator approach for assessing social vulnerability to malaria among the dis-tricts of Rwanda. It is drawn on published works and simplifies the complex information from multisource in-dicators of vulnerability to malaria into a format that is relevant for decision-making. It shows the most vulnerable districts to integrated social indicators in terms of sus-ceptibility to not withstand malaria and lack of resili-ence to anticipate, to cope with or to recover from malaria infection. By decomposing vulnerability into its
underlying factors, it indicates which factors need to be addressed in each district. The developed composite in-dicator framework supports the prioritization of appro-priate interventions in Gicumbi, Burera, Nyaruguru, Nyagatare, Gisagara, Bugesera, Rusizi, and Burera dis-tricts. Being located in the highlands, the prevailing vul-nerability in these districts may be exacerbated by cross-border migrations where malaria can be imported from outside.
[image:18.595.57.544.88.433.2]and enhancement of vector control is needed. As the in-dicators were aggregated at district level, a study using disaggregated data at household level may be needed. Fi-nally, the approach used provides a comparative assess-ment and generalizes the relative levels of vulnerability at among the district of Rwanda, but does not provide useful information about what areas within the districts are most vulnerable to malaria infection. A lack of spatial details on prevailing vulnerability within the same district can result in the implementation of uniform in-terventions that do not necessarily translate to uniform vulnerability reduction inside the district.
Competing interests
The authors declare they have no competing interests.
Authors’contributions
JPB and SK have made substantial contributions to conception and design. JPB was responsible for data collection, processing, analysis, interpretation of the results and drafting the manuscript. ET and SK provided substantial input to the manuscript by revising it critically for important intellectual content. All authors read and approved the final manuscript.
Acknowledgements
The research leading to these results has received funding from the European Union’s Seventh Framework Programme (FP7/2007-2013) under grant agreement no. 266327 (HEALTHY FUTURES, http://www.healthyfutures.eu/). The DHS Program of the US Agency for International Development (USAID) for proving the DHS data for Rwanda. The authors thank all staff from Malaria and Other Parasitic Diseases Division of Rwanda Biomedical Centre for their helpful cooperation especially Dr Corine Karema, Emmanuel Hakizimana, Dr Noella Umulisa, Dr Monique Mulindahabi, Alphonse Mutabazi, Alphonse Rukundo, and Alain Kabayiza.
Author details
1College of Science and Technology, Geography Department, University of
Rwanda, PO Box 212, Butare, Rwanda.2Interfaculty Department of Geoinformatics - Z_GIS, University of Salzburg, Schillerstrasse 305020 Salzburg, Austria.
Received: 19 May 2014 Accepted: 15 December 2014 Published: 7 January 2015
References
1. President’s Malaria Initiative. Malaria Operational Plan (MOP). Kigali, Rwanda: Rwanda FY 2014; 2014.
2. National Institute of Statistics of Rwanda. Fourth Population and Housing Census. Thematic Report: Characteristics of households and housing. Ministry of Finance and Economic Planning; 2012.
3. President’s Malaria Initiative. Malaria Operational Plan (MOP). Kigali, Rwanda: Rwanda FY 2013; 2013.
4. Karema C, Aregawi MW, Rukundo A, Kabayiza A, Mulindahabi M, Fall IS, et al. Trends in malaria cases, hospital admissions and deaths following scale-up of anti-malarial interventions, 2000–2010, Rwanda. Malar J. 2012;11:236.
5. Government of Rwanda, President’s Malaria Initiative. Malaria Operational Plan (MOP). Kigali, Rwanda: Rwanda FY 2013; 2012.
6. Government of Rwanda. Rwanda Service Provision Assessment Survey 2007. Kigali, Rwanda: National Institute of Statistics Ministry of Finance and Economic Planning; 2008.
7. Himeidan YE, Kweka EJ. Malaria in East African highlands during the past 30 years: impact of environmental changes. Front Physiol. 2012;3:315. 8. Gahutu JB, Steininger C, Shyirambere C, Zeile I, Cwinya-Ay N, Danquah I,
et al. Prevalence and risk factors of malaria among children in southern highland Rwanda. Malar J. 2011;10:134.
9. WHO. World Malaria Report. Geneva, Switzerland: World Health Organization; 2010.
10. WHO. World Malaria Report. Geneva, Switzerland: Global Malaria Programme; World Health Organization; 2011.
11. Mboera LEG, Mazigo HD, Rumisha SF, Kramer RA. Towards malaria elimination and its implication for vector control, disease management and livelihoods in Tanzania. Malaria World Journal. 2013;4:19.
12. Lengeler C. Insecticide-treated nets for malaria control: real gains. Bull World Health Organ. 2004;82:2.
13. Githeko AK, Ototo EN, Guiyun Y. Progress towards understanding the ecology and epidemiology of malaria in the western Kenya highlands: opportunities and challenges for control under climate change risk. Acta Trop. 2012;121:19–25.
14. Rulisa S, Kateera F, Bizimana JP, Agaba S, Dukuzumuremyi J, Baas L, et al. Malaria prevalence, spatial clustering and risk factors in a low endemic area of eastern Rwanda: a cross sectional study. PLoS One. 2013;8:e69443.
15. Thaxton M. Integrating Population, Health, and Environment in Rwanda. Rwanda February: Policy Brief of the Population Reference Bureau; 2009. 16. Cotter C, Sturrock HJW, Hsiang MS, Liu J, Phillips AA, Hwang J, et al. The changing epidemiology of malaria elimination: new strategies for new challenges. Lancet. 2013;382:900–11.
17. Lizzi KM, Qualls WA, Brown SC, Beier JC. Expanding integrated vector management to promote healthy environments. Trends Parasitol. 2014;30:394–400.
18. Jones CO, Williams HA. The social burden of malaria: what are we measuring? Am J Trop Med Hyg. 2004;71:156–61.
19. Parker RG. Empowerment, community mobilization and social change in the face of HIV/AIDS. AIDS. 1996;10:S27–31.
20. Packard RM. The Making of a Tropical Disease: A Short History of Malaria. Baltimore: John Hopkins University Press; 2007.
21. Morgan L. Community participation in health: perpetual allures, persistent challenge. Health Policy Plan. 2001;16:221–30.
22. Birkmann J. Measuring Vulnerability to Promote Disaster-Resilient Societies: Conceptual Frameworks and Definitions. In: Birkmann J, editor. Measuring Vulnerability to Natural Hazards. Tokyo-New York-Paris: United Nations University Press; 2006.
23. Birkmann J, Cardona OA, Carreno L, Barbat A, Pelling M, Schneiderbauer S, et al. Framing vulnerability, risk and societal responses: the MOVE framework. Nat Hazards. 2013;67:193–211.
24. UNISDR. Terminology on Disaster Risk Reduction. Geneva, Switzerland: United Nations International Strategy for Disaster Reduction; 2009. 25. Füssel HM. Adaptation planning for climate change: concepts, assessment
approaches, and key lessons. Sustain Sci. 2007;2:265–75.
26. Field CB, Barros V, Stocker TF, Qin D, Dokken DJ, Ebi KL, et al. Managing the risks of extreme events and disasters to advance climate change adaptation. Cambridge Melbourne, Madrid, Cape Town, Singapore, São Paulo, Delhi, Tokyo, Mexico City, New York: Special Report of the Intergovernmental Panel on Climate Change; Cambridge University Press; 2012.
27. Heggenhougen HK. More than just“interesting!”Anthropology, health and human rights. Soc Sci Med. 2000;50:1171–5.
28. Packard RM, Brown PJ. Rethinking health, development, and malaria: historicizing a cultural model in international health. Med Anthropol. 2010;17:181–94.
29. Brown PJ. Culture and the Global Resurgence of Malaria. In: Inhorn MC, Brown PJ, editors. The Anthropology of Infectious Disease: International Health Perspectives. Amsterdam: Gordon and Breach Science Publishers; 1997. p. 119–41.
30. Ribera JM, Hausmann-Muela S. The straw that breaks the camel’s back: redirecting health-seeking behavior studies on malaria and vulnerability. Med Anthropol Q. 2011;25:103–21.
31. Stratton L, O’Neill MS, Kruk ME, Bell ML. The persistent problem of malaria: addressing the fundamental causes of a global killer. Soc Sci Med. 2008;67:854–62.
32. Protopopoff N, Bortel WV, Speybroeck N, Van Geertruyden J-P, Baza D, D’Alessandro U, et al. Ranking malaria risk factors to guide malaria control efforts in African Highlands. PLoS One. 2009;4:e8022.
33. Bates I, Fenton C, Gruber J, Lalloo D, Medina LA, Squire SB, et al. Vulnerability to malaria, tuberculosis, and HIV/AIDS infection and disease. Part I: determinants operating at individual and household level. Lancet Infect Dis. 2004;4:267–77.
35. Bates I, Fenton C, Gruber J, Lalloo D, Medina LA, Squire SB, et al. Vulnerability to malaria, tuberculosis, and HIV/AIDS infection and disease. Part II: determinants operating at environmental and institutional level. Lancet Infect Dis. 2004;4:368–75.
36. Kienberger S, Hagenlocher M. Spatial-explicit modeling of social vulnerability to malaria in East Africa. Int J Health Geogr. 2014;13:29.
37. Hagenlocher M, Delmelle E, Casas I, Kienberger S. Assessing socioeconomic vulnerability to dengue fever in Cali, Colombia: statistical vs expert-based modeling. Int J Health Geogr. 2013;12:36.
38. Hagenlocher M, Kienberger S, Lang S, Blaschke T. Implications of spatial scales and reporting units for the spatial modelling of vulnerability to vector-borne diseases. In: Jekel T, Car A, Strobl J, Griesebner G, editors. GI_Forum 2014: Geospatial Innovation for Society. Salzburg, Austria: Heidelberg: Wichmann; 2014. p. 197–206.
39. Ravallion M. Troubling Tradeoffs in the Human Development Index; Policy Research Working Paper 5484. Washington DC: World Bank; 2010. 40. Brooks N, Adger WN, Kelly PM. The determinants of vulnerability and
adaptive capacity at the national level and the implications for adaptation. Glob Environ Chang. 2005;15:151–63.
41. Borderon M. Why Here and not There? Developing a Spatial Risk Model for Malaria in Dakar, Senegal. In: Cutter S, Corendea C, editors. From Social Vulnerability to Resilience: Measuring Progress Toward Disaster Risk Reduction; Publication Series of UNU-EHS No 17/2012, vol. 108–120. Bonn, Germany: United Nations University Institute for Environment and Human Security (UNU-EHS); 2013.
42. Lindsay SW, Martens WJM. Malaria in the African highlands: past, present and future. Bull World Health Organ. 1998;76:33–45.
43. Malesu MM, Oduor AR, Chrogony K, Nyolei D, Gachene CKK, Biamah EK, et al. Rwanda Irrigation Master Plan. Nairobi, Kenya: The Government of Rwanda, Ministry of agriculture and animal resources, Ebony Company Limited and World Agro-forestry Centre (ICRAF); 2010.
44. Dunn CE, Le Mare A, Makungu C. Malaria risk behaviours, socio-cultural practices and rural livelihoods in southern Tanzania: implications for bed net usage. Soc Sci Med. 2011;72:408–17.
45. Mboera LEG, Mukabana WR, Njunwa KJ, Kabbale FG. Integrated research partnerships for malaria control through an ecohealth approach in East Africa: Kenya. Tanzania and Uganda Projects. Final Report: Rwanda; 2014. 46. Ijumba JN, Lindsay SW. Impact of irrigation on malaria in Africa: paddies
paradox. Med Vet Entomol. 2001;15:1–11.
47. Clay DC. Fighting an Uphill Battle: Demographic Pressure, the Structure of Landholding, and Land Degradation in Rwanda; ASPAP/DAI Rapport No 192U. S. Kigali, Rwanda: Agency for International Development and the Rwanda Ministry of Agriculture and Livestock; ASPAP/DAI Rapport No 192; 1992. 48. Clay DC, Johnson NE. Size of farm or size of family: which comes first?
Popul Stud. 1992;46:491–505.
49. Deressa W, Ali A, Berhane Y. Review of the interplay between population dynamics and malaria transmission in Ethiopia. Eth J Health and Dev. 2006;20:1–8.
50. Government of Rwanda. The 4th General Census of Population and Housing in Rwanda: Provisional Results. Kigali, Rwanda: Ministry of Finance and Economic Planning; 2012.
51. WHO. Prevention and Control of Malaria Epidemics: Tutor’s Guide. Geneva: World Health Organization; 2003.
52. Huldén L. Household size explains successful malaria eradication. Malar J. 2010;9:2.
53. Huldén L, McKitrick R, Huldén L. Average household size and the eradication of malaria. J R Stat Soc. 2013;177:725–42.
54. WHO. Integrating Poverty and Gender into Health Programmes: A Sourcebook for Health Professionals (Module on Malaria). Geneva, Switzerland: World Health Organization; 2006.
55. Saracino A, Nacarapa EA, da Costa Massinga ÉA, Martinelli D, Scacchetti M, de Oliveira C, et al. Prevalence and clinical features of HIV and malaria co-infection in hospitalized adults in Beira. Mozambique Malar J. 2012;11:241.
56. Cohen C, Karstaedt A, Frean J, Thomas J, Govender N, Prentice E, et al. Increased prevalence of severe malaria in HIV-infected adults in South Africa. Clin Infect Dis. 2005;41:1631–7.
57. González R, Ataíde R, Naniche D, Menéndez C, Mayor A. HIV and malaria interactions. Where do we stand? Expert Rev Anti-Infect Ther. 2012;10:153–65. 58. Ivan E, Crowther NJ, Rucogoza AT, Osuwat LO, Munyazesa E, Mutimura E,
et al. Malaria and helminthic co-infection among HIV-positive pregnant
women: prevalence and effects of antiretroviral therapy. Acta Trop. 2012;124:179–84.
59. Langhorne J, Ndungu FM, Sponaas AM, Marsh K. Immunity to malaria: more questions than answers. Nat Immunol. 2008;9:725–32.
60. Bangs MJ, Subianto DB. El Niño and associated outbreaks of severe malaria in highland populations in Irian Jaya, Indonesia: a review and
epidemiological perspective. Southeast Asian J Trop Med Public Health. 1999;30:608–19.
61. MIDIMAR. National Disaster Risk Management Plan; Ministry of Disaster Management and Refugee Affairs. September: Kigali; 2013.
62. Appiah-Darkwah I, Badu-Nyarko SK. Knowledge of malaria prevention and control in a sub-urban community in Accra, Ghana. Int J Trop Med. 2011;6:61–9.
63. Janssen W. Insecticide-treated nets: efficacy, impact and operational constraints. Humanitarian Exchange. 2005;31:11–3.
64. WHO. Indoor Residual Spraying: Use of Indoor Residual Spraying for Scaling up Global Malaria Control and Elimination. Geneva: Switzerland: World Health Organization; Global Malaria Programme; 2006.
65. Mwangangi JM, Midega J, Kahindi S, Njoroge L, Nzovu J, Githure J, et al. Mosquito species abundance and diversity in Malindi, Kenya and their potential implication in pathogen transmission. Parasitol Res. 2012;110:61–71. 66. Yé Y, Hoshen M, Louis V, Séraphin S, Traoré I, Sauerborn R. Housing conditions
andPlasmodium falciparuminfection: protective effect of iron-sheet roofed houses. Malar J. 2006;5:8.
67. Bowen HL. Impact of a mass media campaign on bed net use in Cameroon. Malar J. 2013;12:36.
68. Prue CS, Shannon KL, Khyang J, Edwards LJ, Ahmed S, Ram M, et al. Mobile phones improve case detection and management of malaria in rural Bangladesh. Malar J. 2013;12:48.
69. Roll Back Malaria. Global Strategic Plan 2005–2015. Geneva: Switzerland: Roll Back Malaria Partnership, World Health Organization; 2005.
70. WHO. The African Summit on Roll Back Malaria, Abuja. Geneva: World Health Organization; 2000. WHO/CDS/RBM/2000.17.
71. O’Meara WP, Noor A, Gatakaa H, Tsofa B, McKenzie FE, Marsh K. The impact of primary health care on malaria morbidity - defining access by disease burden. Trop Med Int Health. 2009;14:29–35.
72. Nardo M, Saisana M, Saltelli A, Tarantola S. Tools for Composite Indicators Building. Ispra, Italy: European Commission; Joint Research Centre; Institute for the Protection and Security of the Citizen Econometrics and Statistical Support to Antifraud and the Yale Center for Environmental Law and Policy; 2005.
73. Hildebrand DK. Statistical Thinking for Behavioral Scientists. Boston: Duxbury; 1986.
74. Saisana M. A do-it-Yourself Guide in Excel for Composite Indicator Development. Joint Research Centre, Italy: European Commission; 2012.
75. Osborne JW, Overbay A. The power of outliers (and why researchers should always check for them). Practical Assessment, Research and Evaluation. 2004;9:6. 76. Landau S, Everitt BS. A Handbook of Statistical Analyses Using SPSS. Boca,
Raton, London, New York, Washington, D.C: Chapman & Hall/CRC Press LLC; 2004.
77. Malczewski J. GIS and Multicriteria Decision Analysis. New York, NY: John Wiley and Sons; 1999.
78. Munda G, Saisana M. Methodological considerations on regional sustainability assessment based on multicriteria and sensitivity analysis. Reg Stud. 2011;42:261–76.
79. Field AP. Discovering Statistics Using SPSS for Windows. London: SAGE Publication; 2005.
80. Tabachnick BG, Fidell LS. Using Multivariate Statistics. MA: Allyn & Bacon: Needham Heights; 2001.
81. OECD. Handbook on Constructing Composite Indicators: Methodology and User Guide. Paris: Organization for Economic Co-operation and Development; 2008.
82. Giné R, Pérez-Foguet A. Improved method to calculate the water poverty index at local scale. J Environ Eng. 2010;136:1287–98.
83. Slottje DJ. Measuring the quality of life across countries. Review of Economics and Statistics. 1991;73:684–93.
84. Tate E. Social vulnerability indices: a comparative assessment using uncertainty and sensitivity analysis. Nat Hazards. 2012;63:325–47. 85. Lung T, Lavalle C, Hiederer R, Dosio A, Bouwer LM. A multi-hazard regional