The Automatic Generation and
Execution of Lean Cuisine+
Specifications
A thesis presented
in
partial fulfilment of the requirements
for the degree of
Master of Information Science
In
Computer Science
at Massey University, Palmerston North, New Zealand
Lei LI
(~,A)
ABSTRACT
Lean Cuisine+ (Phillips, 1995), a semi-formal graphical dialogue notation for describing the behaviour of event based direct manipulation GUls, was developed at Massey University in the early 1990s. More recently, a software environment, SELCU (Scogings, 2003) has been built for Lean Cuisine+ which permits dialogue models to be manually constructed and edited using a drag and drop approach. The aim of the research presented in this thesis is to develop extensions to SELCU, which include the automatic generation of Lean Cuisine+ diagrams, and their execution.
A shortcoming of current prototyping tools and user interface builders is that although they permit the designer to construct a mock up of the look and feel of the interface, they provide no model of the interaction. The Auto-Generation Software is a tool which can automatically generate a Lean Cuisine+ diagram for a graphical user interface developed using Delphi. The generated description is represented as a text file, and in a format compatible with the SELCU system.
The Lean Cuisine+ Execution Environment is embedded in the SELCU application. It supports the execution of Lean Cuisine+ specifications, including meneme selection and task action sequence, and also takes account of triggers.
ACKNOWLEDGEMENTS
First of all, I wish to gratefully acknowledge my supervisor Dr. Chris Phillips, for introducing me to this exciting research field, and for his extremely helpful insights and guidance. As an international student, this research year in New Zealand has meant so much more to me because of him, and his professional, unconditional and dedicated encouragement and support.
Gratitude must also express to the following people:
• Mr. Chris Scogings, for his co-supervision, and for his helpful suggestions in regard to the SELCU environment.
• Dr. Ray Kemp, for explanation of StateChart software, . and for representing the big picture of execution environments to me.
• Dr Judy Brown, for providing an introduction to Panorama, and for her friendship and assistance.
CONTENTS
ABSTRACT...
IACKN"OWLEDGMENTS.... ... . .. . .... .... ... ... ... ... ... .. . .
IIICONTENTS...
VFIGURES...
IXTABLES...
XIIIINTRODUCTION...
11.1 Human Computer Interaction Concepts... 2
1.2 Dialogue Concepts... 4
1.3 Project Goal... 5
1.4 Structure of the Thesis... 7
LITERATURE REVIEW...
92.1 Dialogue Notations... 9
2.1.1 Textual Dialogue Notations... 10
2.1.2 Graphical Dialogue Notations... 11
2.2 Support Environments for Dialogue Notations... 23
2.2.1 State Charts... 23
2.2.2 Petri Nets... 28
2.3 Early Prototyping Tools and ID Es... 31
THE LEAN CUISINE+ NOTATION AND ITS SUPPORT
ENVIRONMENT ... .
413.1 The Lean Cuisine+ Notation... 41
3.1.1 Basic Definitions... 42
3 .1.2 Column Attributes Selector Case Study... 44
3.1.3 Preconditions... 47
3.1.4 Selection Triggers... 48
3.1.5 Task Action Sequence... 49
3.2 Support Environment for Lean Cuisine+... 51
3.2.1 SELCU Interface Introduction... 52
3.2.2 SELCU Source File Format... 55
3.2.3 Main Functions of SELCU.... .... .. .... .. ... ... .. ... ... ... 63
3.3 Proposed Extensions of SELCU... .... .. . .. . .. . .. . .. . .. . .. . .. . .. . . .. .. . ... 67
3.4 Summary... 69
CONCEPTUAL DESIGN OF SELCU EXTENSIONS...
714.1 Design Decisions... 71
4.2 Auto-Generation Software Interface Components... 75
4.3 Lo-Fi Prototyping of Execution Environment... 80
4.3.l The Extended SELCU Interface within Execution Function... 81
4.3.2 The Main Interface of SELCU Execution Environment... 81
4.3.3 Preview Mode of Execution Environment... 83
4.3.4 Selecting a Meneme... ... . .. .. . . .. . .. ... . .. . .. . ... 84
4.3.5 Viewing Tasks in the Execution Mode... 86
4.3.6 Error Feedback... 89
4.3.7 Trigger View in Execution Mode... 90
4.4 Summary... 91
IMPLEMENTATION OF THE SELCU EXTENSIONS...
935.1 Overview of the SELCU Extensions... 93
5.2 Language Choice... 94
5.2.1 Decision... 95
5.3 Implementation Issues of The Auto Generation Software... 97
5.3.1 Basic Tree Structure Function... 97
5.3.2 The Lean Cuisine+ Attributes Function... 100
5 .4 Implementation Issues of the Execution Environment... 103
5.4. l Meneme Selection... 103
5.4.2 Meneme Preview Mode... 104
5.4.3 Task View Mode... 106
5.4.4 Triggers View Mode... 107
5.5 Summary... 108
CA
SE
ST
UDIES...
1096.1 Case Study One: Timetabling System... 109
6.1.1 Main Functions of Timetabling System... 110
6.1.2 Main Interface Components in Timetabling System GUI... 111
6.1.3 Using the Auto-Generation Software... 112
6.1.4 Using the Execution Environment... 117
6.2 Case Study Two: Library Catalogue System... 122
6.2. l Library Catalogue System GUI Description... 122
6.2.2 Using the Auto-Generation Software... 125
6.2.3 Using the Execution Environment... 129
6.3 Summary... 142
CO
NCL
USIO
NS...
1437.1 Review of the Auto-Generation Software... 143
7 .2 Review of the Execution Environment... 145
7.3 Conclusion... 148
REFERENCES...
149APPENDIX A -
USER MANUAL...
159Al The Auto Generation Software... 159
FIGURES
Figure 1-1 The General Interaction Frame Work... 2
Figure 1-2 Translations Between Components... 3
Figure 1-3 Project Processing Sequence... 6
Figure 2-1 Possible Interface for Style Menu Example... 12
Figure 2-2 STN Diagram to Describe Style Menu Example... 13
Figure 2-3 Using Petri Nets to Describe Style Example... 16
Figure 2-4 Using State Charts to Present Style Example... 18
Figure 2-5 (a) Mutually Compatible Sub-Dialogue... 19
(b) Mutually Exclusive Sub-Dialogue... 19
Figure 2-6 Using Lean Cuisine to Present Style Example... 22
Figure 2-7 A Screen Shot of the StateCharts Program in Action... 24
Figure 2-8 Graphic Editor of Stateflow... 26
Figure 2-9 Example of VisualState... .. . . .. . . .. . . 27
Figure 2-10 Main Interface of PetriSim... ... ... 29
Figure 2-11 Example ofHPSim.. ... ... ... ... 30
Figure 2-12 Early Interface Design in PowerPoint... 33
Figure 2-13 User Interface Design Using the Delphi IDE... 35
Figure 2-14 Visual C++ 6.0 Constructor... 37
Figure 3-1 (a) Mutually Compatible Fork... 43
(b) Mutually Exclusive Fork... 43
Figure 3-2 (a) Original Lean Cuisine+ Diagram... 44
(b) The Lean Cuisine+ Diagram after Hide "Children". . . 44
( c) The Lean Cuisine+ Diagram after Hide "Parents"... 44
Figure 3-3 Column Attributes Selector... 45
Figure 3-4 Lean Cuisine+ Tree Diagram for Column Attributes Example... 4 7 Figure 3-5 Lean Cuisine+ Diagram with Conditions... 48
Figure 3-7 Task Overlay for Column Example... 50
Figure 3-8 SELCU Interface... 52
Figure 3-9 System Pull Down Menus... 53
Figure 3-10 SELCU Tool Bar... 54
Figure 3-11 Lean Cuisine+ Diagram with Conditions, Triggers and Tasks... 55
Figure 3-12 Add First Meneme on Diagram... 63
Figure 3-13 Add Mutually Compatible Child Menemes.... ... . ... .... ... .. .... .... 64
Figure 3-14 Add Mutually Exclusive Meneme Group... 65
Figure 3-15 Add a New Trigger... 65
Figure 3-16 Add a Task... 66
Figure 3-17 Add Task Name... 67
Figure 4-1 Extended SELCU User Interface... 81
Figure 4-2 Main Interface in Execution Mode... 82
Figure 4-3 Preview of "Submit" Selection... 84
Figure 4-4 Left Click on "Submit" Meneme... .. 85
Figure 4-5 How to Access Task List in Execution Mode... 86
Figure 4-6 Task List Display Sub-Window... 87
Figure 4-7 Single Step Control Task View... 88
Figure 4-8 System Presents All Task Steps in Sequence... 89
Figure 4-9 Error Message Interface... 89
Figure 4-10 Select a Trigger View... 90
Figure 4-11 Triggers View in Execution Mode... 91
Figure 5-1 Delphi Interface... 97
Figure 5-2 Main Part of Example Code in "dfin" File... 98
Figure 5-3 Basic Tree Structure for Delphi Interface... 100
Figure 5-4 A Piece of Example Core Code in "pas" File... 101
Figure 5-5 Main Auto-Generation Software Structure... 102
Figure 5-6 Selecting a Meneme... .. 103
Figure 5-7 Selecting a Monostable Meneme... 103
Figure 5-8 Mutually Compatible Group... 104
Figure 5-10 Error Feedback... 104
Figure 5-11 Preview and Original States... 105
Figure 5-12 Original States Before Preview... 106
Figure 5-13 Preview Showing Trigger... 106
Figure 5-14 Main Structure of the Execution Environment... 108
Figure 6-1 GUI of Timetabling System... 110
Figure 6-2 Generation of the Lean Cuisine+ Source File .. . . .. .. . . .. ... 113
Figure 6-3 The Generated Lean Cuisine+ Diagram for Case Study One . . . 115
Figure 6-4 Lean Cuisine+ Diagram with Trigger Displayed . . . 116
Figure 6-5 A Lean Cuisine+ Diagram in the SELCU System . . . .. 117
Figure 6-6 Execution Environment for Case Study One . . . 118
Figure 6-7 Preview for Selection of "Semester 2" Meneme . . . 119
Figure 6-8 The Lean Cuisine+ Diagram after Release of the Right Button . . . .. 120
Figure 6-9 Diagram after Left Clicking (Selecting) "List Clashes" Meneme . . . .. . . . 121
Figure 6-10 GUI of Library Catalogue System (Before Submit Request)... 123
Figure 6-11 Library Catalogue System GUI (After Submit Request)... 124
Figure 6-12 Lean Cuisine+ Diagram of Library Catalogue System... 126
Figure 6-13 Lean Cuisine+ Diagram with Triggers for Library System... 127
Figure 6-14 Lean Cuisine+ Diagram with Submit Book Request Task... 128
Figure 6-15 Lean Cuisine+ Diagram in Execution Mode... 129
Figure 6-16 Selecting a Monostable Meneme (First Three Seconds)... 130
Figure 6-17 Meneme Preview Showing Trigger... 131
Figure 6-18 Selection Propagation . . . 132
Figure 6-19 System Interface (After Clicking the "Close" Meneme).. .. ... . .. . .. . .... 133
Figure 6-20 Selecting Triggers Function from Menu... 134
Figure 6-21 Triggers View in Execution Mode... 135
Figure 6-22 First Step of "Submit Book Request" Task... 136
Figure 6-23 Second Step of"Submit Book Request" Task... 137
Figure 6-24 Third Step of "Submit Book Request" Task... 137
Figure 6-25 Fourth Step of"Submit Book Request" Task... 138
Figure 6-26 Fifth Step of "Submit Book Request" Task... 138
Figure 6-28 Last Step of "Submit Book Request" Task... 140
Figure 6-29 Error Feedback when the User Clicks an Unavailable Meneme... .. . . 141
Figure 6-30 Error Feedback when the User Clicks a Virtual Meneme... ... 141
Figure 7-1 Tandem Manipulation of the Lean Cuisine+ Diagram and the Interface. 146 Figure 7-2 Executing a Task both in Lean Cuisine+ and Delphi Interface... 147
Figure A-1 Auto-Generation Software Interface... 160
Figure A-2 Error Feedback... 161
Figure A-3 Automatically Generate a Lean Cuisine+ Diagram Source File... 161
Figure A-4 Interface of Execution Environment... 162
Figure A-5 View Pull Down Menu... 163
Figure A-6 Meneme Preview Interface... 164
Figure A-7 Meneme Selection Interface... 165
Figure A-8 Task Display Interface... 165
Figure A-9 Task Execution Interface... 166
TABLES
Table 2-1 Relationship between Options... 12
Table 2-2 Meneme Modifiers... 21
Table 3-1 Trigger Actions... 48
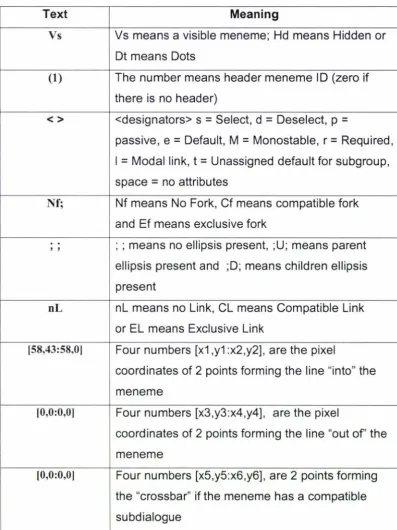
Table 3-2 The Meaning of Basic Meneme Description... 59
Table 3-3 The Meaning of the Meneme Condition Description... 60
Table 3-4 The Trigger Description... 61
Table 3-5 The Meaning of the Basic Task Description... 62
Chapter 1
INTRODUCTION
Dialogue models can provide a useful input to user interface design. They provide a behavioral description of the dialogue at a level removed from the visible user interface. This description can be subjected to analysis, for example to check that all tasks uncovered at the requirements stage are supported by the system and that they can be carried out in an efficient manner. Lean Cuisine+ is a dialogue notation developed at Massey University (Phillips, 1995; Scogings, 2000). It is a semi-formal graphical notation for describing the behavior of event-based GU ls.
A shortcoming of current prototyping tools and user interface builders, is that although they permit the designer to construct the "look and feel" of the user interface, they provide no model of the interaction (Phillips and Scogings, 1997). Prototyping tools could be extended to produce a dialogue model as a by-product of the construction of the interface (Scogings and Phillips, 1998). In addition to supporting analysis of the interaction, the dialogue model would provide useful documentation.
1.1 Human-Computer Interaction Concepts
For most users, the interface is the computer, the system, or the application. What the user sees, hears, feels, are the artifacts of the user interface. Interaction models help the user to understand what is going on in the interaction between user and system. They address the translations between
what the user wants and what the system does.
The purpose of an interactive system is to aid a user in accomplishing goals from some application domain. A domain defines an area of expertise and knowledge in some real-world activity. A domain consists of concepts that highlight its important aspects.
Tasks are operations to manipulate the concepts of a domain. A goal is the desired output from a performed task, and an intention is a specific action required to meet the goal. The task analysis involves the identification of the
problem space for the user of an interactive system in terms of the domain, goals, intentions and tasks.
Figure 1-1 presents an interaction framework (Abowd and Beale, 1991 ). It provides a complete description of the interaction by including the system
explicitly, and breaks it into four main components.
0
s
---outout
u
coce
~
taskI
in outUser Interface Interaction Concepts
The nodes represent the four major components in an interactive system --- the system (S), the user (U), the input (I) and the output (0). Each component has its own language. In addition to the uers's task language and the system's core language, there are languages for both the input and output components to represent these separate, though possibly overlapping, components. Input and output together form the interface.
Figure 1-2 presents the translations between the components from figure 1-1.
As the interface sits between the user and the system, there are four steps in the interactive cycle, each corresponding to a translation from one component to another.
0
~
s
outout
u
core task
I
inputFigure 1-2: Translations Between Components
Four main translations are involved in the interaction: articulation, performance, presentation and observation. The user (U) begins the interactive cycle with the formulation of a goal and a task to achieve that goal. The only way the user can manipulate the machine is through the input (I), and so the task must be articulated within the input language. The input language is translated into the core language as operations to be performed by the system (S). The system (S) then transforms itself as described by the operation translated from the input (I);
Chapter 1 Introduction
The system (S) is in a new state, which must now be communicated to the user (U). The current values of system attributes are rendered as concepts or features of the output (0). It is then up to the user (U) to observe the output (0) and assess the result of the interaction relative to the original goal, ending the evaluation phase and, hence, the interactive cycle.
1.2 Dialogue Concepts
Dialog is the syntactic level of human computer interaction; it is rather like the script of a play, except the user, and sometimes the computer, has more choices. The dialog between user and system is influenced by the style of the interface. It is a conversation between two or more parties. It has also come to imply a level of cooperation or at least intent to resolve conflict. The dialog is
linked to the semantics of the system to present "what it does'', and also is linked to the presentation of the system to describe "how it looks".
The user can look at computer language at three levels:
• The Lexical Level
This is the lowest level, and is concerned with the physical tokens
exchanged. For example, the shape of icons on the screen; the actual keys pressed and so on.
• The Syntactic Level
Pro· ect Goal
• The Semantic Level
This is the highest level. The meaning of the conversation in terms of
its effect on the computer's internal data structures and/or the external
world. In human language, it ascribed by the different participants to the conversation.
In user interfaces, the term dialog is often taken to be almost synonymous with
the syntactic level. However, the lexical/syntactic barrier is somewhat fuzzy
and actual use of dialog description often includes some lexical features. The
Lean Cuisine+ notation, which forms the basis of this project, focuses on the syntactic level.
1.3 Project Goal
A software environment (SELCU) has been developed for Lean Cuisine+
(Scogings, 2003) which permits dialogue models to be manually constructed
and edited using a drag and drop approach.
This project is concerned with extending SELCU. It will involve:
• Design and implementation of the automatic generation of Lean
Cuisine+ descriptions for user interface prototypes constructed using a
conventional user interface builder (Delphi). The descriptions produced
will be in a format compatible with the SELCU application.
• Extension of SELCU to support the execution of Lean Cuisine+
Chapter 1 Introduction
The overall sequence of activities to achieve this is shown in figure 1-3.
•mnm•1
BoldItok
M¢!#j@ Superscript Subscript
Auto Generate
LeoJn Ovis:ine OoJtoJ ... 2
Lean Cuisine+ File
Delphi Interface
• MICll 111
/'
....
t:
Call SELCU
"-...
i1~ ·~·
....
'i'..
Hi~.!:;-
·-I
Bold StyiLP1,;nTcx1"L (Fmylox1J
I
SELCU Edit Mode
I
{Indexed}t
..
.
.
.,
Subscripl
t
Execute Lean Cuisine+· ·.,."::>llCU lxecu1m11 Modi'
/ ' Style §
I
Bold
LPlain Text"'
[{Fancy Text}
I
Italic
SELCU Execution Environment
I
{Indexed} [image:21.563.71.490.104.599.2]I
Superscript [SubscriptFigure 1-3: Project Processing Sequence
In figure 1-3, the user designs the interface in a Delphi IDE, and then uses the
Auto-Generation software to generate a SELCU compatible Lean Cuisine+ file.
Structure of the Thesis
Cuisine+ diagram. In SELCU, the user changes to the execution environment
to execute the notation.
Detailed functional requirements are presented in section 3.3
1.4 Structure of the Thesis
This thesis is structured into seven chapters including this one. The remaining
chapters are organized as follows:
• Chapter two reviews dialogue notations with a focus on graphical
notations. Support environments, a range of early prototyping tools and
I DEs are also described in this chapter.
• Chapter three introduces the main principles of the Lean Cuisine+
notation. The support environment (SELCU) for Lean Cuisine+ is described
in detail. The proposed extensions of SELCU (automatic generation and
execution environment) are presented.
• Chapter four describes the conceptual design of the SELCU extensions,
including design decisions to satisfy the functional requirements. Lo-Fi
prototyping and all transferable Delphi interface components are discussed.
• Chapter five discusses the implementation of the Auto-Generation
software and Execution Environment. These are developed in Delphi and
C++. Several important implementation issues are discussed in this
Chapter l Introduction
• Chapter six presents two detailed case studies to show the software in action.
Chapter 2
LITERATURE REVIEW
In this chapter, we will review some essential human computer interaction
knowledge. The chapter will cover dialogue notations, their support
environments, prototyping tools and integrated development environments.
In section 2.1, we will review dialogue notations, with a focus on graphical
notations, and explain their advantages and shortcomings.
In section 2.2, our attention will move to the support environments for dialogue
notations. The principles of the support environments will be discussed, and
some examples described.
In section 2.3, a range of today's early prototyping tools and IDEs are reviewed.
Examples of software development tools will be described, and a general
observation on them will be taken.
2.1 Dialogue Notations
Dialog is the syntactic level of human computer interaction. It is the structure of
the conversation between the user and the computer system. Dialogue notations
describe the dialogue structure in terms of events, sequence, hierarchy, states
Chapter 2 Literature Review
Usually, the dialog will be linked to the semantics of the system (what it does) and the presentation of the system (how it looks) (Calder and Thomas, 1998).
The ease of analysis and separation of the interface elements of the program from the semantic is the main justification for a dialog description (Baecker, Grudin and Buxton, 1995). The dialog description will allow the user to analyze the proposed structure, or perhaps use a prototyping tool to execute the dialog before a program is written.
Notations used for dialog description can be separated into two main groups, which are textual notations and graphical notations (also referred to as diagrammatic notations). The textual notations are typically based on formal grammars (such as BNF) to describe the system, which provide for formal analysis (Harel, 1988). The graphical notations use visual pictures or diagrams
to present the dialog, making it more accessible to users.
2.1.1 Textual Dialogue Notations
The textual dialogue notation is one kind of special purpose and context free language which is used to describe the interface. Formal grammars and
production rules are two popular textual notations.
Dialogue Notations
really show sequence well at a surface level. It can be deduced but is not readily
apparent.
2.1.2 Graphical Dialogue Notations
Graphical notations are also called diagrammatic notations. They provide a
visual representation of dialogue structure, and are used in the dialog design
area (Brown and Marshall, 1998). They allow the user to see the structure of the
dialogue. Graphical notations are the main focus of this thesis.
To be effective, graphical notations should describe the external behaviour
precisely, and match the user's model (Phillips, 1994 ). Ideally, graphical
notations should be directly executable, should separate function from
implementation and should not constrain the implementation (Jacob, 1985).
Graphical notations should be easier to understand and produce than
conventional symbolic code (Phillips, 1990).
In recent years, a variety of graphical notations have been developed to
represent dialogs. We can separate them into three groups: sequence based
(e.g. State transition networks, Petri nets), state based (e.g. State chart
diagrams) and object based (e.g. Lean Cuisine and Lean Cuisine+). In this
section we will select some representative notations from these three groups to
review the graphical notations world.
State Transition Networks
State transition networks (STNs) have long been used for dialog description, and
they are based on a set of nodes and links between them. The nodes represent
I
IChapter 2 Literature Review
each link inside the STN will represent a transition between states and is associated with an input event which triggers it The transition may be
conditional. Each diagram defines the legal sequences of input events for some dialogue. When we describe dialogues, enhancements have been made to provide for hierarchies of diagrams, to allow the system actions to be attached to arcs, and to encode some states within internal registers. STNs provide an
easily displayed and manipulated network representation based on a small number of constructs.
For example, suppose we have a menu called "Style", offering five options:
Plain Text, Bold, Italic, Superscript and
Subscript.
The relationship betweenthese options is presented in table 2-1, a possible interface in figure 2-1, and STN diagram in figure 2-2.
'
Bold Italic [ Superscript Subscript
r---j Plain Text
I
!! Plain Text E E
i
EE
'
~Bold
Ec
c
c
E
c
I
c
c
i
Italicl~~perscript
E
I
c
c
i
E
E
!c
c
Ei Subscript
i
E = "Mutual Exclusive" C
=
"Mutual Compatible"Table 2-1 Relationship between Options
J
Plain Text
Bold
Italic
Superscript
Subscript
Dialogue Notations
Figure 2-2 STN diagram to describe style menu example (Apperley and Spence, 1989)
There are several shortcomings in STNs. They predate direct manipulation
interfaces, and suffer from a number of shortcomings in this respect, notably that
they are based on a "single event I single state" model, which can lead to an
exponential growth in states and transitions in asynchronous dialogues, resulting
in large and very complex diagrams. In their basic form, they are flat (lack depth)
and do not capture the structure of complex dialogues well. STNs are inherently
sequential in nature, it means that it do not support parallelism. They are best
suited to sequential dialogues with limited choice, where they can be very
Chapter 2 Literature Review
Petri Nets
Petri nets were originally developed in response to the limited modeling power of finite state machines. The Petri Net is a graphical formalism designed for reasoning about concurrent activities (Kjeld and Heiko, 2002). Petri nets define possible sequences of events in a modeled system, and they also show the system states (combinations of conditions) which result from the occurrence of these events (Zurawski and Zhou, 1994). They are abstract virtual machines with a well defined behaviour, which have been used to specify process synchrony during the design phase of time-critical applications.
In recent years, Petri nets have been used by several researchers to specify aspects of single user and multi-user systems (Murata, 1989). Petri nets are represented as network graphs comprising two types of node: circles (places) and bars (transitions) connected by directed arcs. They model the static properties of a system, but also have dynamic properties that result from their execution. In a STN the system is always at exactly one state (Peterson, 1981) (In the Petri net, indeed, we can simulate the behaviour of the system by moving
a counter around the STN following arcs). A Petri net is more powerful in that the system can have several "states" at once.
Dialogue Notations
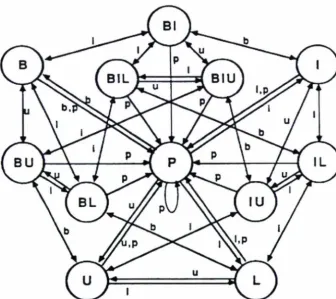
Here we use Petri Nets to describe the same example as for the STN, as shown in figure 2-3. There are two main problems in this figure which need to be considered.
• Problem One: It consists of 3 separate fragments
This problem addressed by looking at the correct mathematical definition of a Petri net. A Petri net is composed of 4 parts: a set of places P, a set of transitions T, an input function I and an output function 0. A Petri net graph is the graphical representation of the Petri net and follows the rules of graph theory. It is possible to produce a graph that graphically consists of separate fragments. In fact, such graphs even have a name - they are called disconnected (or unconnected) graphs. Thus a Petri net graph as a formal mathematical theory can have separate fragments. It is possible that a convention exists which states "when modelling with Petri nets, all graphs should be connected".
• Problem Two: The condition "Plain is selected" is not represented.
Chapter 2 Literature Review
b
p
p
Figure 2-3: Using Petri Nets to describe Style example
Although a Petri net is a quite good tool to describe the dialog, it still has several shortcomings we cannot cope with. Firstly, the objects are represented only indirectly by the sum of their states, which means that object and their behaviours are not well defined. Inter-object relationships are not presented at all (Wolfgang, 1985). The latter problem is compounded to an extent by the requirement to represent separately, selected and deselected object states, which leads to additional transitions. The need to show all transitions explicitly clutters and detracts from the diagrams (Jensen, 1992). This is especially problematic where a number of transitions relate to a particular object. Lastly,
[image:31.562.70.483.61.367.2]Dialogue Notations
State Charts
State charts were developed for the specification of complex reactive systems,
which are event driven and continuously react to stimuli (internal and external).
Such systems are described in terms of the state changes resulting from events,
with events grouped in connection with change of state (Harel, 1987).
State charts are a higraph-based extension of the STNs formalism and are
state-based. Areas represent states and labeled directed arcs represent
transitions. They were developed for describing the behavior of complex reactive
systems. State Charts provide the following extensions to traditional STNs:
• Hierarchy, the ability to group states into super-states to any level of nesting
(which provides a basis for iterative refinement);
• Orthogonality, the ability to describe the transition of several independent
states concurrently;
• Communication, the ability to trigger several transitions by broadcasting an
event to several states.
The concepts that state charts add to basic STNs: hierarchy, orthogonality and
broadcast events, provide expressive power and reduce the size of the resulting
specification. The hierarchy in state charts is used within a single diagram to add
structure, and to show which parts represent alternative states and which
represent concurrent activity (Harel and Politi, 1998).
Statecharts have been criticized as being too difficult for the designer. The need
to show transitions explicitly remains, and is compounded to an extent by the
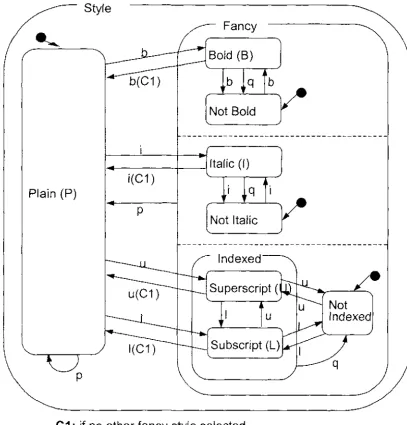
requirement for "null" states to be shown. Figure 2-4 shows a State Charts
Chapter 2 Literature Review
Style
Fancy
Bold (B)
Not Bold
1 - - - + - - - 1 Italic (I) i(C1)
Plain (P)
p
Not Italic
Indexed
p
C1: if no other fancy style selected p I q : broadcast event
[image:33.566.62.469.62.487.2]•
Figure 2-4: Using State Charts to Present Style Example
From the above discussion we know that the state charts were not developed for
dialogue description, but are suited to describing asynchronous event-driven user interfaces. They capture the event sequences, but are not inherently sequence-based in the way that STNs are, and they also capture the structure of
Dialogue Notations
the other hand, they are state-based rather than object-based, which can lead to
complexity in representing direct multiple interfaces.
Lean Cuisine
Lean Cuisine (Apperley and Spence, 1989) is a graphical notation based on the
use of tree diagrams to describe systems of menus. A menu is viewed as a set
of selectable representations (called menemes) of objects, actions, states,
parameters and so on, which may be logically related or constrained. Lean
Cuisine was developed explicitly for dialogue description.
• Menu
A menu is a set of selectable representations of actions, parameters,
objects (which may be other menus), states and other attributes, in which
selections maybe logically related and/or constrained.
• Sub-Menu
Within a dialogue, menemes are clustered into syntactic sub-groups that
are either mutually exclusive (1 from N) or mutually compatible (M from N).
In the Lean Cuisine notation these structures are represented
diagrammatically as figure 2-5.
Meneme l
I
I
I
Meneme .II Meneme 2 Meneme 3
(a)
Meneme 1
Meneme 2
Meneme 3
Meneme
.4
(b)Figure 2-5 (a): Mutually Compatible Sub-Dialogue
Chapter 2 Literature Review
• Menemes
The meneme is an individual selectable representation within a menu, it is
the minimum or basic unit of information in the two way dialogue between the user and the application (Apperley, 1988). A meneme is defined as having four possible states "available and selected", "available but not selected", "not available but selected" and "not available and not selected". Its state may be change either by direct excitation, or by indirect modification (that means as a result of the excitation of another meneme) (Phillips and Apperley, 1990).
• Real or Virtual Menemes
Mnemes may be "real" or "virtual". Associated with each real meneme is an implicit event with may trigger its selection or de-selection. Real menemes may be terminal (leaf) nodes, in which case they represent specific selectable objects, actions or parameters (Anderson and Apperley, 1990). If the real menemes are non-terminal nodes, they are selectable headers to other menus. Virtual non-terminal menemes are used to partition a single menu, and are not directly accessible to the user.
They can be indirectly selected as a result of a valid selection having been made in the menu subsection they represent.
• Meneme Designators
A meneme can have modifiers, which capture other aspect of a dialogue. These include the following:
(1) A menu or sub-group header may be tagged as a required-choice
group; this places the additional constraint on the relationships
Icon
§
1t
•
f
~
J_
®
Dialogue Notations
(2) An initial default choice indicates a meneme that is to be initially
in the selected state. It may subsequently be deselected, directly or
indirectly, according to the constraints and interrelationships that
apply.
(3) A dynamic default is a default which takes on the value of the last
user selection from that group. It may have an initial assignment, or it
may be initially unassigned, in which case the first user choice from
that group becomes its first values.
(4) Menemes may be bistable, select-only, deselect-only, monostable or
passive. The type is normally determined by the sub-group
constraints. However, the default type may be explicitly overridden
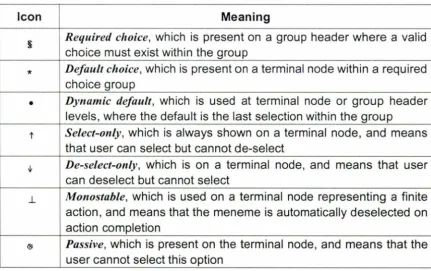
by specifying one of the other types (see the table 2-2).
Meaning
Required choice, which is present on a group header where a valid choice must exist within the group
Default choice, which is present on a terminal node within a required choice group
Dynamic default, which is used at terminal node or group header levels, where the default is the last selection within the group
Select-only, which is always shown on a terminal node, and means that user can select but cannot de-select
De-select-only, which is on a terminal node, and means that user can deselect but cannot select
Monostable, which is used on a terminal node representing a finite action, and means that the meneme is automatically deselected on action completion
Passive, which is present on the terminal node, and means that the user cannot select this option
[image:36.559.77.509.409.680.2]Chapter 2 Literature Review
By using the above modifiers, the Lean Cuisine notation can show meneme states in a simple and clear way. Figure 2-6 is the Lean Cuisine diagram used to describe the Style menu interface. Compared with STN, Petri Net or State Chart representations, the conciseness of Lean Cuisine notation is shown very clearly in this example.
Style §
I
Bold Italic
I
{Indexed}I
~Superscript
[image:37.559.149.398.179.382.2]LSubscrtpt
Figure 2-6 Using Lean Cuisine to Present Style example (after Apperley and Spence, 1989)
Lean Cuisine offers a clear, concise, and compact graphical notation for describing asynchronous aspects of menu-based dialogues, but is not able to describe those aspects which include sequence (Cockton, 1990). The state of a dialogue at any stage is represented by the sum of the individual meneme states
Support Environments for Dialogue Notations
Lean Cuisine+
Lean Cuisine+ is a development and extension of the Lean Cuisine notation. It
is an executable semi-formal graphical notation for specifying the underlying
behaviour of event-based direct manipulation interfaces (Phillips, 1994 ). It
supports the early design phase of the interface development cycle. In a Lean
Cuisine+ specification, an interface is described in terms of a basic dialogue
tree plus additional constraints and dependencies (Phillips, 1995).
This project is based on the Lean Cuisine+ notation; which will be described in
detail in chapter 3.
2.2 Support Environments for Dialogue Notations
The Lean Cuisine+, Statechart and Petri Net notations have been reviewed in
section 2.1. Several environments have been developed to support these
executable notations. SELCU (Scogings and Phillips, 1999), a Lean Cuisine+
support environment is described in chapter 3. Support environments for State
Charts and Petri Nets are reviewed below.
2.2.1 State charts
StateCharts
Statecharts is a statechart design program. It supports the construction of
statecharts (Harel, 1987), and provides some method of generalizing the use of
statecharts for purposes such as device tuition. Figure 2-7 shows a screen shot
Chapter 2 Literature Review
- Sl.C>efs:tate
t;) Ur'Ut!d State 1
-0 UrUSed Slate 2
• t:J Unt<led Stote J
E_..1
E"""2
Ev..-cJ E....S
§
UnttledStatet Utdled State 5 URitledStete6
a.-,...
E ;
[image:39.559.26.521.58.376.2]tote
Figure 2-7: A screen Shot of the Statecharts program in action
There are three work areas in Figure 2-7.
Area A includes the menu bar, tool bar and main view window of this software.
All the system functions are presented in the menu bar, and this software also
uses the tool bar to give a fast way to access select and new state functions.
The entire diagram is shown in the main view window. The user draws or
modifies state chart diagrams in this area.
Area B is a state hierarchy window. It displays the hierarchy of states in a tree
form, with the default state at each level at the top of its branch and with a
Support Environments for Dialogue Notations
Area C is an event manager. It controls the execution of the diagram. From the
list of events in the event manager, the modeller can select any number of
events to assert, and then click the "Execute Event" button to run the state chart.
Stateflow
Stateflow is an interactive design tool for modeling and simulating event-driven
systems. It provides for designing embedded systems that contain supervisory
logic. Its combination of graphical modeling and animated simulation brings
system specification and design closer together.
Stateflow is based on a combination of traditional statechart diagrams and
control flow diagrams. Stateflow charts enable graphical representation of
hierarchical and parallel states and the event-driven transitions between them.
However, Stateflow also augments traditional statecharts with the innovative
capabilities of control flow, graphical functions, temporal operators,
directed-event broadcasting, and modeling support for legacy C code.
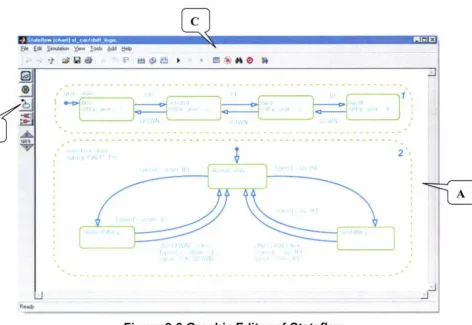
Figure 2-8 presents the Graphic Editor of Stateflow, and it features a number of built-in functions which include the following:
• Area A is a graphical Stateflow Explorer. It lets the user draw, browse,
define, and modify objects in this window.
• Area B is a tool bar. It includes the most popular functions in this
software.
• Area C includes shortcut bars, navigation and command menus, zoom
Chapter 2 Literature Review
x
E• t• !~ y,... loolo fJdd
t:t.-f> ~~t!I •
.
e/..._ _ _ ___,J-CICl>----C>_,[ ______
l
Q~
[---r ·:
...
--
·-
---
---
---
... [image:41.560.44.517.52.377.2]2
Figure 2-8 Graphic Editor of Stateflow
Using Stateflow, the user can develop visual models of event-driven systems
that incorporate state transition diagrams without knowing finite state machine
theory. Users can also generate, embeddable C code from their models with
Stateflow Coder. These features make the Stateflow environment suitable for
developing embedded systems in automotive, aerospace, and
telecommunications design applications.
VisualState
Visua/State is a graphical programming tool based on Statecharts and
Flowcharts. With graphical specification, automatic code generation, graphical
debugging, and round- trip engineering. Figure 2-9 is a screenshot of the
Support Environments for Dialogue Notations
9t ~di !{... °'*"" Qlogr• lock l i { - Ii"'
el ~ g a !:l I~"" ::J ~ ~ !ID !iii I !if'
ICcmrnrd'.•l=
o
x •"MobOt l ... s} ~Glob.IElomeril
-~ _ _ .,.. 1 fel•l
-
·
-~ r---·
, __ Loc.IElem•rU on- ~C.ilr.Q
...
- e111.ngI stand_b)t
~ 0 ® e
•
0 e a - cal_,.,.c- ~ Lne_C....,ol C::. ~ lne_ai< q.
teSl_W.
....
_...
_ _ olf 0
~
~
-
D
CONNECTO ~_.,tJti. /
OIS,lAY ... C.ON()
ICfV _NO.HOl.00/ O,ENOISP'LAYO ,a
UGHT_OP()
_
_
..
:
.
, iJ UNIE ... L0S1'()/C .. EM_OIS'<)
CAl.UHG_REOUESTOY : LIGMT .. IUNK(.I
R NCi_OP()
CA1.l1NG_HOUCST01
CLEM ... OISl'O UGHT ... ~UHI(,() ~INti_ONQ
-
-
---
'
-
LJ
' .;
: :-
-
-
.THTOSO OIS,L.AY _NO ... SIOO
(6. 59)
Figure 2-9 Example of Visua/State
There are two main areas in above figure:
x
In area A, users can create their model using states, transitions, events, actions,
initial states, variables, assignments, concurrent regions, unit states, history
states, deep history states, guards, signals, parameters, entry, exit and do
reactions - according to the UML notation.
Area B is a tree browser. It allows the user to overview and navigate through a
project. All elements of the system are visible and accessible through the
browser, and a double-click on the desired element brings up the appropriate
drawing on the screen.
Visua/State provides a direct and formal link between user requirements and
Chapter 2 Literature Review
specification. Operating on an engineering workstation or PC, Visua/State creates a visual, graphical specification that represents the intended functions and behavior of the system being specified. This specification may be executed, or graphically simulated, so the system engineer can explore "what if' scenarios to determine if the behavior and the interactions between system elements are correct.
2.2.2 Petri Nets
Petri Sim
PetriSim is a generator of discrete simulation models that can also be used as
an editor and simulator of Petri networks. Simulation models are created by adding Pascal code snippets into the network created by PetriSim. It enables creation of discrete simulation models in a commonly known language with the simplicity typical for simulation languages.
PetriSim was created as a tool to support the teaching of:
•
•
•
Petri Networks Discrete Simulation
Object Oriented Programming
L
c
s
p D
Support Environments for Dialogue Notations
QNetYOt"k
ew_re.J e:ct
- He"' Jo
~
p
c2
Queuc2 TE>l le1
~C
lt
\j
tr .:tCC
- c1 l o t =--=:] Cash!
O
.
_
left
Cash2Figure 2-10 Main Interface of PetriSim
Because PetriSim is based on the Dos system, its interface looks quite simple.
In the above figure, the main screen is this software's basic working area. The
user can use the mouse and keyboard to design a Petri Net diagram on this
area. A set of menu bars are at the top of the window. At any time, the user can
use the mouse to click the menu bar to display a pop down sub-menu (for
example the user can find a create new file function by single clicking File menu
option). On the other hand, the user also can use a shortcut key to launch the
function.
HPSim
HPSim is a high-level Petri net editor and simulator that achieves the integration
Chapter 2 Literature Review
methods and can be treated as first-class Java objects. On the other hand, Java
code can be accessed from nets easily. Figure 2-11 presents a screenshot of
the operation of HPSim.
~~HPS1m -prozes4i_zyklu~_connect_001.hp~ , ... , :>
Fie fvrarq, View Window Tools Zoom SirrUation Extra ?
>---~ ...J
UV 03 zu
>-ffll
m
mE:==:
:=
-.
n
;
.,.
<)
Petri Net Simulation V0.91
load: 56 Position(s)
load: 52 Transition[s) Sample Time: 1 ms
Limits: 1000000 ms or 1000000 step[s] arning: 43 potentialy Conflicts found
Set the Si'nulator max. Speed oniin-e - rsc.ii
1111:.,~i
a:
q ~ lfiii ..:d
:tiT. Oms 5. O/Oms IP. 563, 621 z. IOO'l'o ,C.663/0
Figure 2-11 Example of HPSim
A
B
In figure 2-11, several documents have been sketched and simulated in a
common main window (areas A, B and C). The graphic objects in the diagram
can be positioned, moved, and deleted. The text and geometrical objects are
available for annotations (area 0). The project explorer presents all the diagram
components' property and value (area E). Users can click on the contents and
modify them. Area F is a simulator. A multi-level zoom function control window
is also presented in this figure (area G).
Several support environments for State Chart and Petri Nets have been
Early Prototyping Tools and ID Es
construct state chart diagrams. The common features include the design,
editing and modification of the basic structure of state chart diagrams. In
addition,
S
t
a
t
eC
ha
r
t
s
provides an execution function for the diagram;S
ta
t
eflow
offers the generation of embeddable C code from the models with the diagram;
visua
!
Sta
t
e
supplies the creation of a visual, specification to graphicallysimulate the state chart diagram.
P
etriSim
andHP
Sim
are designed to support Petri Nets. Both of them supportthe editing and simulation of Petri Net diagrams.
P
etr
i
S
im
is a DOS basedsystem and the simulation function only recognizes Pascal code. The
HPSim
simulator can analyze Java code and create executable workflows.
2.3 Early Prototyping Tools and
IDEs
Prototyping tools help the designer to build and implement the system interface.
Interface prototyping tools and system Integrated Development Environments
(IDE) have become more and more important in the software development
process (Myers Brad A., 1995). For the early stage of interface sketching,
M
i
c
r
osoft
P
a
int
orP
owerPo
in
t
can replace paper and pencil to present thedesigner's ideas in a clearer and more lively fashion. Sometimes we also
describe early prototyping software as "Fac;ade tools".
Most of the popular programming languages have their own comprehensive
integrated development environments (Calvert Charlie, 1999). For example,
D
e
lphi
IDE
,
J
Build
e
r
,
Visua
l B
as
i
c
IDE,
M
i
c
r
osoft Vis
u
a
l
C
++
ID
E
(FordChapter 2 Literature Review
amount of code that they need to produce when creating a user interface, and by using these tools, the user interfaces can be created more quickly.
Another important advantage to using the IDE, is it help achieve a consistent look and feel, when different developers use the same IDE to design their
different products (Myers, 1995). For most designers, the consistency of interfaces makes it possible for them to understand and transfer interface products between different applications and platforms easily. When they know one graphical user interface, it will be possible for them to simply move to others (Myers, Scott. and Randy, 1999). On the other hand, when the end user is presented with software developed by the IDEs, it also will be easier for them to master the applications, because most of the components in the different IDEs are very similar.
In this section, we will briefly review four interface development tools and
analyze their characteristics and differences.
PowerPoint
is an earlyprototyping (Facade) tool. It is easy for the user to learn, includes some basic graphical functions, and is suited to presenting the designer's initial ideas. But most of the interface components have to be drawn by the user, and it can't generate any source code for the program.
The complicated IDEs like
Delphi environment, Visual
C++6.0 IDE
make itEarly Prototyping Tools and IDEs
PowerPoint
PowerPoint is a basic prototyping tool to support the early design of the user
interface. The picture in figure 2-12 shows a mockup of part of the SELCU
interface in PowerPoint.
~ Microwft f>rrwPrPm11t [PrPr.enttttion6j [';J@j~I
1!!J :l!:l*l:V .a<u llllE<l'.l llliA<ll !!;tQ1l IAlll OIJl:"~~~l 1lOl!l M~Q!l
o ~ a I!!
o
l:l m • liJ : :;;:>$ • '" • a I 11 ., ~1 ~ . 2 @ 3 @
!;l
::
L::-\,~
8 ~
• li3 10 l'Ol
II lil 12 lil 13 lil 14 Iii! 15 Iii! 16 Iii! IT li3 18 li3 19 li3
2() Ii!
21 li3 22 1iEI
~
~
:~
·
~i!IEIJP· ~ !l~IEfliQ!l· OIJ!:" 15 I 20
-
·~
1 u m1ttroo eques1
Library System 1 "-..
(Library Catalogue System • )
•
Insert
{Buttons}
~
Select
Group} Edit Box{Form Attributes} /
Move-'- ~ .._
Close-'- ~ Delete
•
Print~ Modify
-'-Cancel
-'-Submi r
Figure 2-12 Early Interface Design in PowerPoint
• x
Although we have lots of complicated IDEs to support graphical interface design,
sometime we still feel the lack of primary prototyping tools to support very early
sketching. Microsoft PowerPoint is a capable of generating on-screen interface
mocks ups.
In figure 2-12, area A is the main design window of PowerPoint. Users edit their
slides in this area. The components that the user wants to draw can be selected
Chapter 2 Literature Review
design work. It presents all the slides as a list and gives users an easier way to navigate the design options. These options include design templates, color schemes, and animation schemes-all of them can be previewed at the time a selection is made.
By using PowerPoint, the developer can mock up their design ideas on the screen. All the colors, styles, interface components, animation effects are easy for the user to input to the computer and also easy to modify. This helps the user to create a high quality interface mockup in a short time (Myers A. Personal Web, 2002). But compared with IDEs, PowerPoint only provides a mock up of the look and feel, and cannot auto generate any code for future software development (Swan Tom, 1998). The developers have to design most of the interface components by themselves.
The Delphi IDE
The Delphi IDE includes an Object Pascal compiler, interface design toolkit and extensive facilities for debugging software (Jacobs, 1999). The interface design toolkit typically provides both a library of interactive components, and an architectural framework to manage the operation of interfaces made up of those components (Lischner, 2000). Compared with PowerPoint, this kind of IDE employs an established framework and a library of reusable components to support user interface construction (Pacheco and Teixeira, 1998). Most of the interface components are provided in the IDE library, but in the simple prototyping tools like PowerPoint or Paint, the users have to draw components
by themselves.
Early Prototyping Tools and IDEs
~~
~
Ei£e '-dit ~~ch :tiew eroJect B.un !:,omponent Q.atabase Iools '!.'£ndow tte~ <None> • ~
~ fd (d f} St«idard AdciboMI \lfn32 S\IStem OataAcceu Data Con!Job: cl:fmen OataSnao BOE ADO lrtcrBasc WebSeMees Internet ~
:::J Fw;;1 :;) Button1 :;;J B\Alon2 ~ 8t.Aton3
:;;i 81iton4 d 8utton5
:;;i 81ilon6
:;;)Eclt1 :::Jlabe11
:::J LabenO
:::J Laben1
I Label12
Faml
Properties Events
Acbon
AcWeeomc>
Algn ~ ...
A<>M!llend False
A<>M!llenct.'el. 255
(ald.elt.•l<Top(
r.., False
bcLel!ToAoght (biS ...
btS~
0
K~gue System
556
see Oclltrhce
0 0• ~ ~it~ A f..-r ~ ..!!!.! 111 r. l!li!J"'-"- ~ i}
r
;;:;;
:-
...
--:::.:..·."';::",w~·."::"'.~-::;:: .. ~;-.-;:--;..~,:::--..:.·~-::..~-:_--:::-.~":';".-,,;,;r::;·-~,--·-=--,-~~~ ... ~1~. fi.._L!.b!.!ryCdtdlogueSys,h•m . ...,..~ .... :..~~ ... ~n,...
•. , ... l-...,-.<A-.~..--.... - .. -..-.~-i ... ~§1}(1 . · • Library Catalogue System
Search Result
1tle Author
Publisher
ISBN
Human-Computer Interaction DD<. Alan
Prentice Hall
0132398648
No Call Number Location
1 004.21019 Hum Campus A
2 004.21019 Hum Campus B
3 004.21019 Hum Campus C
Status
On Loan
On Loan
On Loan
• . _ I _ _ E_n_te_r_la_s_t d_a_te_o_n_wh_ic_h_b_o_o_k_is_w_an_te_d_,,(m_m/""'"d_d""'/w"'-'-) _ _
Ptn Sw.it
Seleci
Sele<t
Seleci
(TS...CO.-.•..,
v
i-
---..;.;-...,...;...,... __ __.
Code Dia am
1: 1 lnse1t
Fig 2-13: User Interface Design Using the Delphi IDE
The above Delphi IDE interface can be separated into five areas:
• Area A : Form Designer
Graph1cs, Cc
Used to design the basic window where the users specify the layout of
the components of the interface.
• Area B : Code Editer
Allows the user to access the Pascal code that provides the functionality
of the interface components in form designer.
• Area C: Menu/Toolbar
Includes the Delphi applications (such as Open, Save and so on), and
Chapter 2 Literature Review
• Area D: Object Inspector
Has two tabbed sections, one showing the properties of a form and the other showing its events. All the components in the form will present their properties and events here.
• Area E: Object Tree View Window
Presents all the components in a tree structure. It helps the user to have a big picture of the whole design work and understand the relationship between these objects.
These IDEs use a technology called RAD (Rapid Application Development), to assist programmers to develop code (Rachele, 2001 ). Generally, when a user finishes the design of the visual interface, the RAD system will automatically produces the skeleton of a corresponding program in the particular programming language (Roy, Smith and Lyons, 2000). In this skeleton, the program will include a list of names, following the correct syntax and some of the activity programs (Santos, 1999). The users just need to fill in the blanks with other code to specify how to perform each of the activities.
The IDE systems (like the Delphi IDE) are very popular in today's interface design because they map well to the direct manipulation style of graphical user interface. These systems generate the basic skeleton code for each user activity (Shannon, 1999). Most of the interface design components can be found from the library, and the user can simply use them and needn't design again. It saves the user's time and makes it easy to build a consistent look for all the
Early Prototyping Tools and IDEs
Visual C++ Constructor
Visual C++ 6.0 IDE is another important interactive graphical tool to support
prototyping. This kind of builder is similar to the Delphi IDE. (Dorfman, 1995)
The constructors allow interactive components to be placed using a mouse to
create windows and dialog boxes (Kruglinski, Wingo and Shepherd, 1998). In
C++ constructor, the system also supports the code generation. Figure 2-14
shows the main screen of the Visual C++ 6.0 Constructor environment.
:::;sncu ·Microsoft Vi•ual C• • • [SCLCU.rc • IOD_EDITACTIOH [fnglish (Hew Zeolnnd)J (Dialog)] ~l@(Xl
...
CEditAc1ion0ialog • (All class members] • • CEditAdionDinlog • 3. • ~ fftJ ! !I
- _j SELCU resources
.. _J Accelerator
- __;Dialog :;3 IOD _ABOUTB• :;3 IDD_COLOUR :;3 IDD_EDITACTI
:;3 IDD_EDITLIN~
:;3 IDD_EDITMB
cif
'.;3 IDO EDITTRIC'.;3 IOO_TASKOIS '.;3 IDD_TASKNAll
_J Icon
_j Menu ;i IOR_MAJNFRJ! • _J String Tobie
• _J Tool bar
• _J Version
1.l ••• 1 •• • • 1 •••• 1 •••• 1 •• ,.1 •••• 1 •••• 1 •••• • • ••• 1 •••• 1
Edit
Edit
s~ at the end o1 the anow User achon
S~t Deselect
System action
Create Delete
1
I
Da.hlen¢1 Ed• Ring Sile EdtOK I c.ne.i
l>l\ Build J. Deb..Q ~ Fro n Fies 1 ~ Fn:I n Fies 2 ~ R""1ts ~ SQL oe&Wli <
~ lil ... obi
oo
151 (i l!i!1~ IE l!l • Ill]
'°"" !i'1 .:J !'!·
~8 u~ l!li!I r=
"~
·o o. o
Figure 2-14: Visual C++ 6.0 Constructor
There are five main areas in figure 2-14,
• Area A is a dialogue box design area. It is like the form designer in
Delphi IDE. Users can directly move interface components from the