R E S E A R C H A R T I C L E
Open Access
Evaluation of reference genes in mouse
preimplantation embryos for gene expression
studies using real-time quantitative RT-PCR
(RT-qPCR)
Jae-Kyo Jeong, Min-Hee Kang, Sangiliyandi Gurunathan, Ssang-Goo Cho, Chankyu Park, Han Geuk Seo
and Jin-Hoi Kim
*Abstract
Background:Real-time quantitative reverse-transcriptase polymerase chain reaction (RT-qPCR) is the most sensitive, and valuable technique for rare mRNA detection. However, the expression profiles of reference genes under different experimental conditions, such as different mouse strains, developmental stage, and culture conditions have been poorly studied.
Results:mRNA stability of theactb,gapdh,sdha,ablim,ywhaz,sptbn,h2afz,tgfb1,18 sandwrnipgenes was analyzed. Using the NormFinder program, the most stable genes are as follows:h2afzfor the B6D2F-1 and C57BL/6 strains; sptbnfor ICR;h2afzfor KOSOM and CZB cultures of B6D2F-1 and C57BL/6 strain-derived embryos;wrnipfor M16 culture of B6D2F-1 and C57BL/6 strain-derived embryos;ywhaz,tgfb1,18 s,18 s,ywhaz, andh2afzfor zygote, 2-cell, 4-cell, 8-cell, molular, and blastocyst embryonic stages cultured in KSOM medium, respectively;h2afz,wrnip,wrnip, h2afz,ywhaz, andablimfor zygote, 2-cell, 4-cell, 8-cell, molular, and blastocyst stage embryos cultured in CZB medium, respectively;18 s,h2afz,h2afz,actb,h2afz, andwrnipfor zygote, 2-cell, 4-cell, 8-cell, molular, and blastocyst stage embryos cultured in M16 medium, respectively.
Conclusions:These results demonstrated that candidate reference genes for normalization of target gene expression using RT-qPCR should be selected according to mouse strains, developmental stage, and culture conditions.
Keywords:RT-PCR, Reference gene, Mouse, Preimplantation embryos, Gene expression
Background
The culture media used for in vitro propagation of
mouse preimplantation embryos plays an important role in maintaining their efficacy and survival rates. Exten-sive efforts to establish appropriate culture conditions has led to the development of media such as the
mo-dified version of Whittingham’s original medium 16
{M16; [1]}, Chatot-Ziomek-Bavister [CZB; [2]], and Po-tassium Simplex Optimized Medium {KSOM; [3]} for
in vitro culture of mouse preimplantation embryos. These culture media contain seven inorganic ions: Na+,
K+, Cl−, Ca2+, Mg2+, SO42−, and PO42−[4]: M16 was for-mulated in the 1970s, whereas, in the late 1980s, CZB and KSOM media were first developed in order to overcome 2-cell blocks, which are sensitive to osmolarity [5,6]. Therefore, these media had much lower osmolalities than M16 medium, mainly due to lower inorganic ion concen-trations. In contrast, the concentration of KCl, sodium lactate, sodium pyruvate, and glucose were higher in M16 than KSOM. However, M16 has a lower concentration
of KH2PO4, NaCl, and antibiotics. Also, M16 has no
ethylenediaminetetraacetic acid (EDTA) or L-Glutamine. EDTA was shown to affect embryonic development by inhibiting glycolysis at the two-cell stage, thereby prevent-ing the premature stimulation of glycolysis [7,8]. In mice, * Correspondence:[email protected]
Department of Animal Biotechnology, KonKuk University, Seoul 143-701, Republic of Korea
the potential for embryonic development during in vitro
culture may differ among strains. For example, the ability of one-cell mouse embryos to develop into blastocysts
in vitrohas been shown to be a function of mouse strains, media components, and culture conditions [9-12]. In this regard, there is a need to assess the relative roles of the mouse strain background and culture environment in the modification of gene regulation duringin vitroculture.
The scarcity of the mRNA amounts obtained from preimplantation embryos has hampered the molecular analysis of preimplantation embryos [13-15]. Recent progress in RNA amplification methods and microarray platforms, including genes unique to preimplantation em-bryos, allow us to apply global gene expression profiling to the study of preimplantation embryos [16-19]. Initially, the majority of studies focused on gene expression analysis of preimplantation embryos, which were based on con-ventional reverse-transcriptase polymerase chain reaction (RT-PCR) [20,21]. Compared to conventional RT-PCR, several studies reported that real-time quantitative reverse-transcriptase polymerase chain reaction (RT-qPCR), in which data are accurately normalized, is significantly less variable than conventional RT-PCR procedures [22,23]. Therefore, it is very important to estab-lish an accurate normalization procedure to control for variability in RT-qPCR data. Generally, glyceraldehyde-3-phosphate dehydrogenase (gapdh), beta-actin, and riboso-mal RNA are commonly used as internal control RNA. However, it has not been examined systematically whether the amount of mRNA in preimplantation embryos is vari-able for most genes, including reference genes, due to cul-ture environment, media components, and mouse strains. The differences in reference gene expression among mouse strains duringin vitroculture may introduce a considerable bias if the values of the target genes were normalized to the values of inconsistent housekeeping genes. Therefore, in order to quantify the limited quantities of mRNA con-tained in each embryo, a reference gene with stable expres-sion across preimplantation embryos is required.
The expression stability and validation of reference genes suitable for the normalization of RT-qPCR data have been investigated in detail in various organisms in-cluding mouse [24-26], rabbit [27], cat [28], pig [29], bo-vine [22,30-32], horse [33], and human [34,35]. In gene expression studies on animal preimplantation embryos, normalization is generally accomplished using a single housekeeping gene. In the most recent mouse preimplan-tation study reported, 12 housekeeping genes were tested across in vitro- vs. in vivo-derived preimplantation em-bryos, and three (ppia, h2afz, and hprt genes) of them were used for normalization of target gene expression [25]. Although several studies have proven that the expression level of reference genes in different conditions varies, the aim of this study is to investigate the
expression profiles of reference genes under different experimental conditions, such as different strain back-grounds (C57BL/6 for inbreed, B6D2F-1 for hybrids, and ICR for outbreed), culture conditions, and different development stages during the preimplantation of mouse embryos. In addition, we focused on the identification and selection of the best stable genes for normalization of gene expression analysis in different developmental stages, culture condition, and strains.
Methods Animals
The mice were housed in wire cages at 22 ± 1°C under a
12 L:12D cycle with 70% humidity and fed ad libitum.
All experiments were performed in the Institutional Animal Care and Use Committee at Konkuk University (IACUC approval number: KU12079), Seoul, Korea.
Preparation and procurement of media
All chemicals used for media preparation were purchased from Sigma Chemical Co. (St. Louis, MO, USA). Embryo culture media, such as M16 [1], was purchased from Sigma and contained no EDTA. CZB [2] and KSOM [3] were purchased from Millipore (St. Charles, MO, USA). Amino acids purchased from Sigma were added to KSOM. Each media composition is described in Additional file 1: Table S1. All embryo manipulations outside the incubator were performed in CZB-HEPES medium (Sigma, USA).
Embryo recovery and culture
Female ICR, B6D2F-1 and C57B/6 mice (age 6–8 wk)
were superovulated by injection of 5 IU of equine chori-onic gonadotropin (eCG), followed by the injection of 5 IU of hCG 48 h later, and then mated with male ICR, B6D2F-1, and C57BL/6 mice. Day 0 of gestation was de-fined as the day a vaginal plug was found. Plug-positive females were separated for experimentation. Zygotes were obtained by opening the ampulla at 20 h post-hCG administration using CZB-HEPES medium.
Approxi-mately 20 embryos were transferred into a 30-μL drop
of fresh medium (M16, KSOM, CZB) covered with min-eral oil. Embryo culture in each media was performed
according to manufacturer’s protocols and using 5%
CO2 in atmospheric oxygen at 37°C. Embryo
develop-ment rates in vitro under three different culture media are shown in Additional file 2: Table S2. For recovery of in vivo-derived embryo, ICR or B6D2F-1 and C57B/6 fe-male mice (4 to 6 wk old) were superovulated using PMSG/hCG and mated with a proven fertile male of the same strain. One cell, 2 cells, 4 cells, 8 cells, morulae
and blastocyst stage embryos were recovered at 18–22,
RNA isolation and reverse transcription
Twenty embryos were washed in Ca+2- and Mg+2-free
PBS, snap-frozen in liquid nitrogen, and stored at−70°C. mRNA was extracted from groups of embryos using the Dynabeads mRNA Direct Kit (Dynal Ase) according to the manufacturer’s instructions (r = 6). For reverse tran-scription, total RNAs in a final volume of 20μL (contain-ing 0.5 mg oligo-dT, RT buffer [1×], 10 mM dithiothreitol, and 10 mM dNTP) was subjected to reverse transcription at 37°C for 50 min, followed by 70°C for 15 min, and products were stored at 4°C until use.
Selection of reference genes and primer design
Reference genes were chosen from those used routinely in studies of pre-implantation embryonic stages [11,36,37]. Other potentially suitable reference genes were selected among those used in published literature on the repro-ductive system (Table 1) [38-41]. Whenever possible, primers fulfilled the following recommended criteria:
amplicon length of 80 bp–130 bp, location of primers
on two different exons, primer sequence length of
18–25 bp, melting temperature of 58°C ± 2°C and GC
content of 40% – 60%. Primer specificity was checked
in silico (Primer-BLAST Tool from http://www.ncbi. nlm.nih.gov/tools/primer-blast/). All oligonucleotides were supplied unmodified and desalted (Cosmogen-etech, Korea).
Real-time quantitative reverse transcriptase PCR (RT-qPCR)
The PCR reactions were performed according to the in-structions of the real-time PCR machine manufacturer (ABI 7800, Applied Biosystems, Foster City, CA). The threshold cycle (Ct) value represents the cycle number at which sample fluorescence rises to a statistically signifi-cant level above the background. Each well contained 1μL of a 10-fold dilution of cDNA, 10μL of 2× Maxima® SYBR Green/ROX qPCR Master Mix (Thermo Scientific
Fermentas, Göteborg, Sweden), 2μL of each primer 1 –
3μM and 7μL water. We optimized qPCR conditions on
the ViiATM7 real-time PCR machine according to
manu-facturer’s instructions and by testing different concentra-tions of primers and templates. The PCR program was as follows: denaturation (95°C for 10 min), amplification and quantification repeated 40 times (95°C for 10 sec,
55– 60°C for 30 sec, and 72°C for 30 sec with a single
fluorescent measurement), melting curve analysis (65 –
95°C, with a heating rate 0.2°C/sec and continuous fluor-escence measurement), and final cooling to 12°C.
We confirmed the amplification of specific RT-qPCR products by performing a melting-curve step at the end of each run. Serial dilution curves for each primer allowed us to calculate RT-qPCR efficiencies. The 10-fold diluted cDNA that was used for all the amplifications was within the linear dynamic range of the calibration curve–between 1- and 1000-fold dilution. Across all the assays, none of the quantification cycle (Cq) values were higher than 44. No-template and no-reverse transcription controls were run to determine any contamination or the generation of primer dimers. All amplifications were run in triplicate, and any doubtful curves were excluded. To minimize technical variation between samples through different runs, we preferred the sample maximization method, i.e., a run contained all the samples for one gene of interest respective to one reference gene.
Statistical analysis
[image:3.595.57.547.570.734.2]GenEX qPCR data analysis software (Lotsgatan, Göteborg, Sweden) was used for implementation of quality controls and the calculation of optimal endogenous controls. This program uses the comparative Ct method for relative quantitative analysis, and the results are expressed as a fold change of expression levels. The mean value of triplicates was applied for all calculations. Medians were used to replace missing values that occurred due to inconsistencies between replicates rather than from
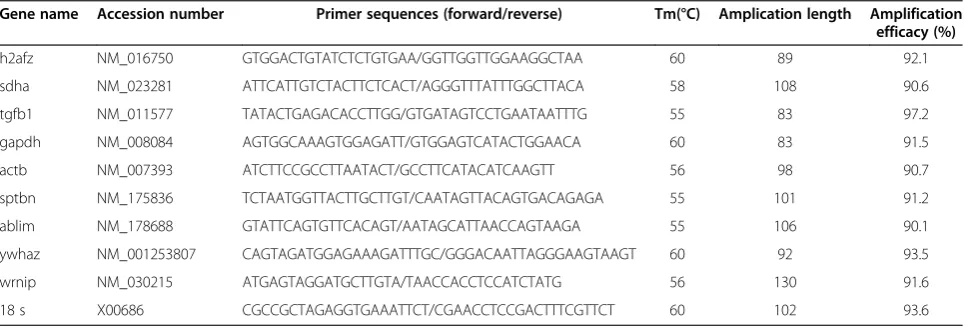
Table 1 Primer sets used in this study
Gene name Accession number Primer sequences (forward/reverse) Tm(°C) Amplication length Amplification efficacy (%)
h2afz NM_016750 GTGGACTGTATCTCTGTGAA/GGTTGGTTGGAAGGCTAA 60 89 92.1
sdha NM_023281 ATTCATTGTCTACTTCTCACT/AGGGTTTATTTGGCTTACA 58 108 90.6
tgfb1 NM_011577 TATACTGAGACACCTTGG/GTGATAGTCCTGAATAATTTG 55 83 97.2
gapdh NM_008084 AGTGGCAAAGTGGAGATT/GTGGAGTCATACTGGAACA 60 83 91.5
actb NM_007393 ATCTTCCGCCTTAATACT/GCCTTCATACATCAAGTT 56 98 90.7
sptbn NM_175836 TCTAATGGTTACTTGCTTGT/CAATAGTTACAGTGACAGAGA 55 101 91.2
ablim NM_178688 GTATTCAGTGTTCACAGT/AATAGCATTAACCAGTAAGA 55 106 90.1
ywhaz NM_001253807 CAGTAGATGGAGAAAGATTTGC/GGGACAATTAGGGAAGTAAGT 60 92 93.5
wrnip NM_030215 ATGAGTAGGATGCTTGTA/TAACCACCTCCATCTATG 56 130 91.6
low expression. To measure the expression stability of the candidate endogenous control genes, the commonly used program NormFinder was employed. All data are expressed as means ± SD.
Results
Selection of ten reference genes
For RT-qPCR analysis, total RNA was extracted from 20 zygotes or embryos. To identify the best reference genes for gene expression studies in mouse preimplan-tation embryos, an RT-qPCR assay based on large amounts of transcriptome data from the mammalian preimplantation embryos was designed for the tran-scription profiling of the ten genes (actb, gapdh, sdha,
ablim, ywhaz, sptbn, h2afz, tgfb1, 18 s and wrnip; Table 1). The specificity of the amplifications was con-firmed by the presence of a single band of the expected size for each primer pair in agarose gels following elec-trophoresis, and by visualizing the single-peak melting curves of the PCR products (Additional file 3: Figure S1). The melting temperatures of all PCR products are shown in Table 1.
The cycle threshold values of candidate genes in different experimental subsets/conditions showed in Additional file 4: Table S3. All the genes tested in this study, using the NormFinder analysis, presented gene stability values (SD-value) acceptable enough for them to qualify as potential reference genes in both mouse strains and culture media. Among them, in all different experimental conditions including culture conditions,
development stages and strains, the 18 s gene had a
lower average Ct value, whereas the tgfb1 gene had a
higher average Ct value. The RT-qPCR test suggested that tgfb1 should be selected as an internal reference gene when analyzing a high-abundance target gene,
while18 scan serve as an internal reference gene when
analyzing a low-abundance target gene.
Validation of reference genes
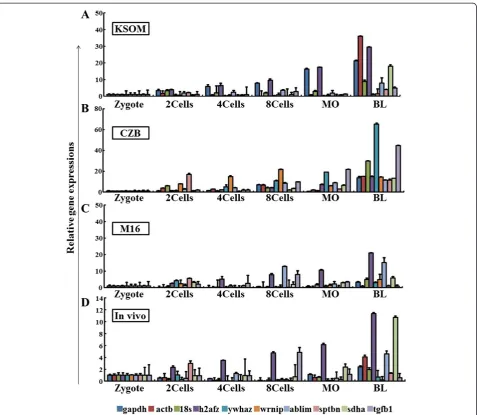
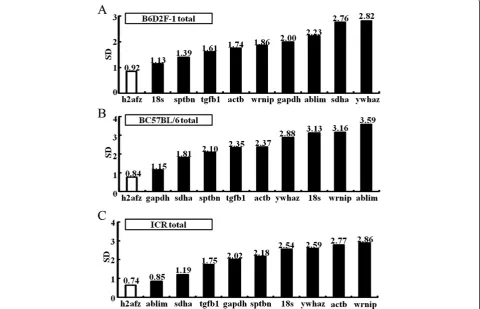
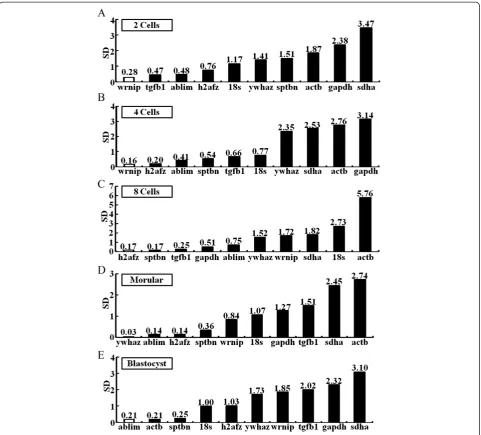
Gene expression during the 2-cell, 4-cell, 8-cell, mor-ulae, and blastocyst embryonic stages were analyzed in three differently derived mouse preimplantation em-bryos grown under three different culture media, and in thein vivo-derived embryos (Figure 1; Additional file 5: Figure S2 and Additional file 6: Figure S3). The pair-wise comparison of all the potential reference genes (actb, gapdh, sdha, ablim, ywhaz, sptbn, h2afz, tgfb1,
18 s and wrnip) calculated using NormFinder resulted
in SD-values above 1.0 for all except the h2fz gene,
which showed 0.92 and 0.84 for the B6D2F-1 and C57BL/6 strains, respectively (Figure 2). In the ICR
strains, however, both h2afz and ablim genes were
below the SD-value cut-off of 1.0.
NormFinder analysis of in Vivo vs. in vitro derived embryos
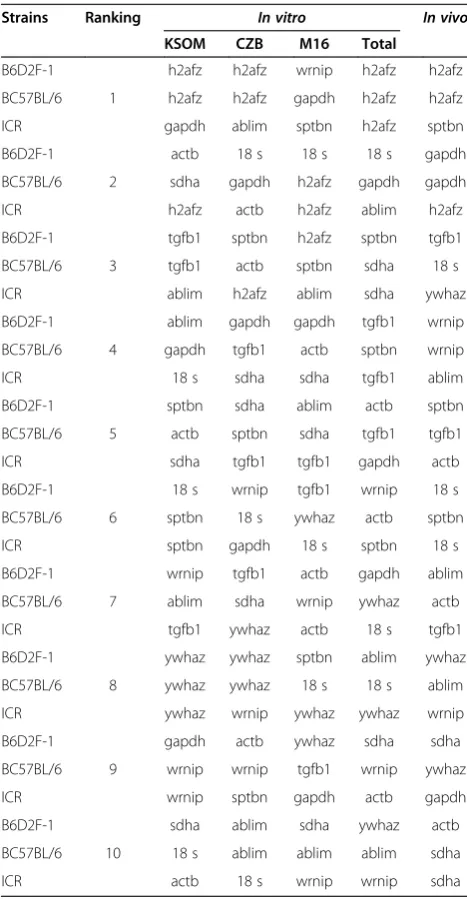
We used NormFinder analysis as a model-based ap-proach to identify the optimal reference genes among a set of candidates. A lower average expression stability value indicates that the gene expression is more stable. NormFinder ranks all reference gene candidates based on intra- and inter-group variations and combines both re-sults into a stability value for each reference gene candi-date [42]. In B6D2F-1 embryos,h2afz,actb, andtgfb1are ranked as good reference genes in M16 and KSOM
media, whereash2afz and18 sare ranked as good
refer-ence genes in CZB (Table 2). Even thoughactbandtgfb1
are the most stably expressed genes across strains cul-tured in M16 and KSOM media, these reference genes did not fulfill the stability criteria in CZB medium. By NormFinder analysis, the recommended comprehensive ranking of the stability of gene expression in thein vivo
-derived embryos was determined as h2afz>gapdh>
tgfb1>wrnip>sptbn>18 s>ablim>ywhaz>sdha>actb.
In C57B/6 embryos, h2afz is the most suitable gene for
studies in the three different media tested and in the
in vivo-derived embryos. Of note, sdhain KSOM media is the most suitable reference gene, whereas this refer-ence gene was identified as the least stable gene for CZM
and M16 media, and in vivo-derived embryos (Table 2).
The average gene expression stability in order of most stable to least stable genes for in vivo-derived embryos was determined ash2afz>gapdh>18 s>wrnip>tgfb1>
sptbn>actb>ablim>ywhaz>sdha. In ICR embryos, the
gene with the most stable expression for in vitro- and
in vivo-derived embryos wash2afz(Table 2). Of note, the gene stabilityof in vivo-derivedembryos contrasted with
in vitro culture-derived embryos: most of the reference genes, exceptsdha, showed stable expression. In conclu-sion, the best reference gene for in vitro- or in vivo -de-rived embryos ish2afz, regardless of culture media used.
NormFinder analysis of inbred vs. hybrid or outbred embryos
h2afz was found to be most stable in B6D2F-1 and C57BL/6 embryos cultured in KSOM and CZB media
(Table 2), while gapdh was the best reference gene for
analyzing B57BL/6 (Table 2) and ICR strains (Table 2) cultured in M16 and KSOM media. The wrnip gene was the most stable for evaluating the B6D2F-1 strain cul-tured in M16 medium (Table 2) and for the ICR strain
propagated in CZB and M16 media (Table 2). Thealbim
and sptbn genes proved to be the most stable. On the
other hand, ablim exhibited poor stability in B6D2F-1
and B57BL/6 cultured in M16 medium, and CZB or M16 media, respectively (Figure 3B and Additional file 7: Figure S4B and C). The other genes that consistently
M16 media (Table 2),18 sfor C57BL/6 and ICR cultured
in KSOM and CZB, respectively (Table 2). Also, theactb
and wrnipgenes were least stable in ICR strain embryos cultured in KSOM and M16 media (Table 2). Even
thoughgapdhand actbfor the ICR and B6D2F-1 strains
in KSOM medium emerged as the most stably expressed, consolidated evaluation under different conditions esti-mated that these genes were least stable in the B6D2F-1 and ICR strains (Table 2). When evaluated across three
different strains, h2afz (B6D2F-1, C57BL/6, ICR), 18 s
(B6D2F-1), sptbn (B6D2F-1), gapdh (C57BL/6), ablim
(ICR), and actb(C57BL/6, ICR) in CZB medium are the
most stable, whereas 18 s (ICR), sptbn (ICR), actb
(B6D2F-1) and ablim(B6D2F-1) have been excluded as
good candidate reference genes. The results showed that
the best-ranked reference genes differed across culture conditions or mouse strains.
Ranking order of reference genes according to developmental stages of preimplantation embryos
At the 2-cell stage
the ranking order of reference genes in KSOM medium are
wrnip>tgfb1>ablim>h2afz>18 s>ywhaz>sptbn>actb>
gapdh>sdha (Figure 3A); h2afz>actb>wrnip>sdha>
18 s>sptbn>gapdh>ywhaz>ablim>tgfb1 for CZB medium (Table 3); h2afz>sptbn>ywhaz>sdha>wrnip>
18 s>tgfb1>gapdh>ablim>actb for M16 medium (Table 3); tgfb1>ywhaz>18 s>sptbn>ablim>h2afz>
[image:5.595.61.539.87.502.2]actb>sdha>gapdh>wrnip forin vivoembryos (Table 3). Unlike thein vitroculture system,wrnip,h2afz, and tgfb1
are the least stable among the reference genes in the
in vivo-derived embryos. Also, when evaluated across three different strains,sptbnis the most stable gene in the
B6D2F-1 and C57BL/6 strains; ablim is the least stable
gene, although it is the most stable gene in the ICR strains (Table 4 and Additional file 7: Figure S4, Additional file 8: Figure S5 and Additional file 9: Figure S6).
At the 4-cell stage
The present study identified reliable reference genes among ten candidate genes for normalization of RT-qPCR data in mouse preimplantation embryos during the 4-cell development stage: wrnip>h2afz>ablim>sptbn>tgfb1>
18 s>ywhaz>sdha>actb>gapdh for KSOM (Figure 3B);
h2afz>actb>ywhaz>18 s>sdha>sptbn>wrnip>gapdh>
ablim>tgfb1 for CZB (Table 3); h2afz>sptbn>sdha>
ywhaz>tgfb1>gapdh>wrnip>18 s>ablim>actbfor M16 (Table 3); 18 s>sptbn>ywhaz>gapdh>h2afz>actb>
tgfb1>sdha>ablim>wrnip for in vivo-derived embryos
(Table 3). Notably, wrnip and 18 s in KSOM and
in vivo-embryos are most stable, whereas these genes in the in vivo- and M16-derived embryos did not show a
highly stable expression pattern. Although sdha (KSOM
and CZB), ablim (CZB, M16) and gapdh (KSOM ,CZB
and M16) were the least stable genes under the
dif-ferent culture conditions tested, sdha (B6D2F-1), albim
(C57Bl/6) and gapdh (ICR) displayed a stable
expres-sion pattern in the corresponding strain backgrounds (Table 4 and Additional file 7: Figure S4, Additional file 8: Figure S5 and Additional file 9: Figure S6).
At the 8-cell stage
Next, we identified reference genes for 8-cell stages using KSOM-, CZB-, and M16-derived embryos orin vivo-derived embryos. The order of gene stability amongst the 8-cell stage embryos was h2afz>sptbn>tgfb1>gapdh>
ablim>ywhaz> wrnip>sdha>18 s>actb for KSOM (Table 3); actb> h2afz>ywhaz>sdha>18 s>wrnip>
sptbn>gapdh>ablim> tgfb1 for CZB (Figure 3C);
ywhaz>sptbn>sdha>h2afz > 18 s>gapdh>tgfb1>
wrnip>ablim>actb for M16 (Table 3) and18 s>h2afz>
gapdh>ywhaz>tgfb1>sptbn>ablim>sdha>wrnip>actb
[image:6.595.58.539.92.401.2]forin vivo-derived embryos (Table 3). Unlike the other developmental stages, there was significant discrepancy in
the ranking order of reference genes under each different culture conditions. When examined across three different strains,sptbn,sdah,tgfb1, andywhazwere the most stable
in B6D2F1 strains and ywaz and sptbn had highly
stable expression patterns in the C57BL/6 strain back-ground. However, in ICR strains,gapdhis only stable gene (Table 4 and Additional file 7: Figure S4, Additional file 8: Figure S5 and Additional file 9: Figure S6).
At morulae stages
ywhaz>ablim>h2afz>sptbn>wrnip>18 s>gapdh>
tgfb1>sdha>actb were found to be the most stably expressed reference genes when mouse preimplantation
embryos were cultured in KSOM (Figure 3D). The order of stability was h2afz>ywhaz>tgfb1>wrnip>actb>sdha>
sptbn>18 s>ablim>gapdh (Table 3) and h2afz>sptbn>
sdha>ywhaz>tgfb1>gapdh>wrnip> 18 s> actb>ablim
(Table 3) for CZB and M16 media, respectively. Forin vivo -derived embryos, the most to least stably expressed genes were as follows: ywhaz>h2afz>18 s>gapdh>ablim>
sdha>tgfb1>sptbn>actb>wrnip (Table 3). During these
stages, ywhaz is the most stably expressed of the
ref-erence genes, while 18 s, ablim and gapdh were the
least stable. But, the ywhaz gene was the least stable
gene in ICR strains, although it was stably expressed in the B6D2F-1 and C57Bl/6 strains (Table 4 and Additional file 7: Figure S4, Additional file 8: Figure S5 and Additional file 9: Figure S6).
At the blastocyst stage
The order of the most stably expressed reference genes to the least stable genes in KSOM, CZB, and M16 media are as follows: ablim>actb>sptbn>18 s>h2afz>
ywhaz>wrnip > tgfb1>gapdh>sdhafor KSOM medium (Additional file 9: Figure S6E); wrnip>h2afz>ywhaz>
actb>sptbn>sdha>18 s>tgfb1>ablim>gapdhfor CZB medium (Table 3); h2afz>tgfb1>sptbn>ywhaz>gapdh>
sdha>wrnip>18 s>ablim>actbfor M16 medium (Table 3):
h2afz>ywhaz>18 s>actb>sptbn>gapdh>sdha>tgfb1>
ablim>wrnipforin vivo blastocyst (Table 3). During this stage,h2afzandywhazare the most stably expressed ref-erence genes, whereaswrnipis the least stable gene. Con-sistent with these results, data for the B6D2F-1 and
C57Bl/6 strains showed that h2afz and ywhaz are the
most stably expressed, while thewrnipgene was the most stable in the ICR strain (Table 4 and Additional file 7: Figure S4, Additional file 8: Figure S5 and Additional file 9: Figure S6). Thus, these results showed that culture conditions and mouse strains are the main factors affect-ing the stable expression of reference genes in the RT-qPCR experiments.
Discussion
[image:7.595.56.290.284.734.2]RT-qPCR is an invaluable technique for investigating changes in gene expression during preimplantation em-bryonic stages [43-45]. Since it has be performed on lim-ited quantities of mRNA contained in each embryo, the reliability of this method mainly depends on the use of validated, stably expressed reference genes for the normalization of mRNA expression [46]. However, to the best of our knowledge, no such study on gene expression and stability in different strains cultured under different conditions has been published. The present work was thus undertaken to emphasize the need to validate the expression stability of reference genes in preimplantation embryos using different mouse strains and varied culture conditions.
Table 2 Expression stability and ranking of ten reference genes in each strains derived-embryos analyzed using NormFinder software
Strains Ranking In vitro In vivo
KSOM CZB M16 Total
B6D2F-1
1
h2afz h2afz wrnip h2afz h2afz
BC57BL/6 h2afz h2afz gapdh h2afz h2afz
ICR gapdh ablim sptbn h2afz sptbn
B6D2F-1
2
actb 18 s 18 s 18 s gapdh
BC57BL/6 sdha gapdh h2afz gapdh gapdh
ICR h2afz actb h2afz ablim h2afz
B6D2F-1
3
tgfb1 sptbn h2afz sptbn tgfb1
BC57BL/6 tgfb1 actb sptbn sdha 18 s
ICR ablim h2afz ablim sdha ywhaz
B6D2F-1
4
ablim gapdh gapdh tgfb1 wrnip
BC57BL/6 gapdh tgfb1 actb sptbn wrnip
ICR 18 s sdha sdha tgfb1 ablim
B6D2F-1
5
sptbn sdha ablim actb sptbn
BC57BL/6 actb sptbn sdha tgfb1 tgfb1
ICR sdha tgfb1 tgfb1 gapdh actb
B6D2F-1
6
18 s wrnip tgfb1 wrnip 18 s
BC57BL/6 sptbn 18 s ywhaz actb sptbn
ICR sptbn gapdh 18 s sptbn 18 s
B6D2F-1
7
wrnip tgfb1 actb gapdh ablim
BC57BL/6 ablim sdha wrnip ywhaz actb
ICR tgfb1 ywhaz actb 18 s tgfb1
B6D2F-1
8
ywhaz ywhaz sptbn ablim ywhaz
BC57BL/6 ywhaz ywhaz 18 s 18 s ablim
ICR ywhaz wrnip ywhaz ywhaz wrnip
B6D2F-1
9
gapdh actb ywhaz sdha sdha
BC57BL/6 wrnip wrnip tgfb1 wrnip ywhaz
ICR wrnip sptbn gapdh actb gapdh
B6D2F-1
10
sdha ablim sdha ywhaz actb
BC57BL/6 18 s ablim ablim ablim sdha
An ideal reference gene is one that is stably expressed within the samples to be compared, regardless of tissue differences, experimental conditions or treatments [47,48].
‘Housekeeping’genes are often supposed to have a steady expression pattern, and have been used extensively as ref-erence genes [49]. However, many reports have shown that the expression levels of internal standards, including some housekeeping genes such as gapdh, actb, or 18 s, can alter considerably in response to alterations in the experimental conditions [50-52]. In this study, we also reconfirmed that several of the commonly used reference
genes, includinggapdh, 18 s rRNA, and beta-actin, are un-suitable for normalization duringin vitroculture of some of mouse strain-derived embryos.
In this study, we selected ten genes (actb,gapdh,sdha,
ablim, ywhaz, sptbn, h2afz, tgfb1, 18 s and wrnip) be-cause they play different cellular roles: actb, ablim and
[image:8.595.58.540.88.523.2]sptbnencode cytoskeletal components expressed in vari-ous types of cells [53-55];gapdhencodes an enzyme that catalyzes glycolysis for energy and carbon molecules [56]; ywhaz is implicated in the protection of cells from apoptosis through binding to the pro-apoptotic protein
[57]; sdhaencodes the enzyme that catalyzes oxidation in the succinate pathway [58];h2afzencodes a component of the nucleosome structure of the chromosomal fiber [59];
[image:9.595.60.309.116.685.2]18 sencodes a part of the ribosomal RNA [60];tgfb1 is a multifunctional component that controls proliferation and differentiation in several cell types [61]; andwrnipinteracts with the N-terminus of the Wener protein containing the exonuclease domain [62]. KSOM and CZB media were chosen because they were optimized for inbred and outbred strains [3]. M16 medium, on the other hand was chosen, because it had higher osmolalities than KSOM and CZB media: CZB medium differs from the M16 medium, since it contains a high lactate:pyruvate ratio, 1 mM glutamine and lacks glucose. In addition, the B6D2F-1, C57BL/6, and
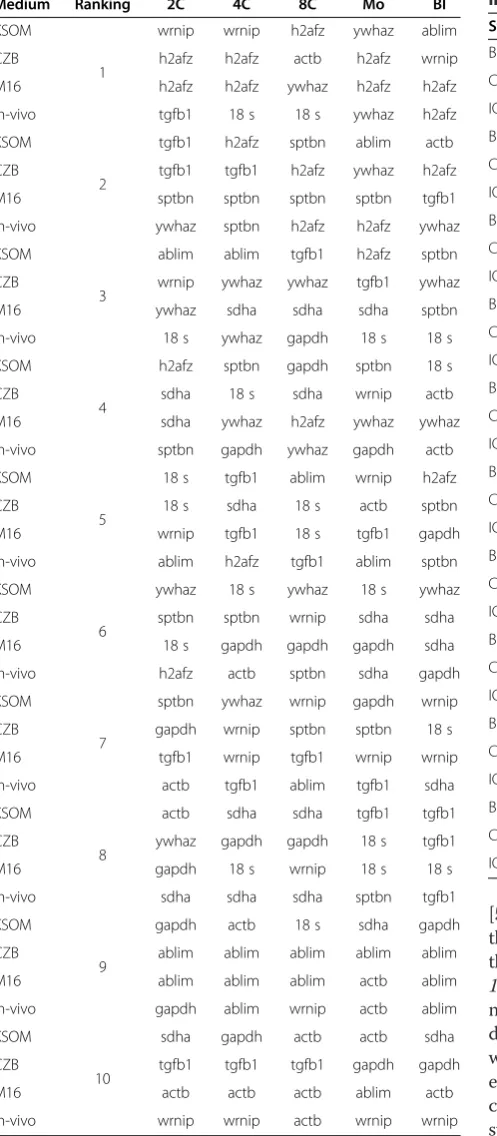
Table 3 Ranking of reference genes according to development stages of pre-implantation embryo stages
Medium Ranking 2C 4C 8C Mo Bl
KSOM
1
wrnip wrnip h2afz ywhaz ablim
CZB h2afz h2afz actb h2afz wrnip
M16 h2afz h2afz ywhaz h2afz h2afz
in-vivo tgfb1 18 s 18 s ywhaz h2afz
KSOM
2
tgfb1 h2afz sptbn ablim actb
CZB tgfb1 tgfb1 h2afz ywhaz h2afz
M16 sptbn sptbn sptbn sptbn tgfb1
in-vivo ywhaz sptbn h2afz h2afz ywhaz
KSOM
3
ablim ablim tgfb1 h2afz sptbn
CZB wrnip ywhaz ywhaz tgfb1 ywhaz
M16 ywhaz sdha sdha sdha sptbn
in-vivo 18 s ywhaz gapdh 18 s 18 s
KSOM
4
h2afz sptbn gapdh sptbn 18 s
CZB sdha 18 s sdha wrnip actb
M16 sdha ywhaz h2afz ywhaz ywhaz
in-vivo sptbn gapdh ywhaz gapdh actb
KSOM
5
18 s tgfb1 ablim wrnip h2afz
CZB 18 s sdha 18 s actb sptbn
M16 wrnip tgfb1 18 s tgfb1 gapdh
in-vivo ablim h2afz tgfb1 ablim sptbn
KSOM
6
ywhaz 18 s ywhaz 18 s ywhaz
CZB sptbn sptbn wrnip sdha sdha
M16 18 s gapdh gapdh gapdh sdha
in-vivo h2afz actb sptbn sdha gapdh
KSOM
7
sptbn ywhaz wrnip gapdh wrnip
CZB gapdh wrnip sptbn sptbn 18 s
M16 tgfb1 wrnip tgfb1 wrnip wrnip
in-vivo actb tgfb1 ablim tgfb1 sdha
KSOM
8
actb sdha sdha tgfb1 tgfb1
CZB ywhaz gapdh gapdh 18 s tgfb1
M16 gapdh 18 s wrnip 18 s 18 s
in-vivo sdha sdha sdha sptbn tgfb1
KSOM
9
gapdh actb 18 s sdha gapdh
CZB ablim ablim ablim ablim ablim
M16 ablim ablim ablim actb ablim
in-vivo gapdh ablim wrnip actb ablim
KSOM
10
sdha gapdh actb actb sdha
CZB tgfb1 tgfb1 tgfb1 gapdh gapdh
M16 actb actb actb ablim actb
in-vivo wrnip wrnip actb wrnip wrnip
Table 4 Stability rankings of ten endogenous reference genes according to development stages of pre-implantation embryo stages in each mouse strains
Strains Ranking 2C 4C 8C Mo Bl
B6D2F-1
1
sptbn sdha sptbn h2afz h2afz
C57BL/6 sptbn ablim ywhaz ablim ywhaz
ICR ablim gapdh gapdh tgfb1 ablim
B6D2F-1
2
ywhaz sptbn sdha gapdh sptbn
C57BL/6 wrnip sptbn sptbn sptbn sptbn
ICR sptbn sptbn actb wrnip wrnip
B6D2F-1
3
sdha ywhaz tgfb1 ywhaz sdha
C57BL/6 sdha h2afz ablim wrnip ablim
ICR ywhaz 18 s ablim h2afz sptbn
B6D2F-1
4
wrnip h2afz ywhaz ywhaz sdha
C57BL/6 actb wrnip sdha h2afz gapdh
ICR wrnip wrnip sdha gapdh gapdh
B6D2F-1
5
h2afz tgfb1 h2afz sptbn gapdh
C57BL/6 h2afz gapdh 18 s gapdh h2afz
ICR gapdh sdha h2afz ywhaz 18 s
B6D2F-1
6
gapdh gapdh 18 s sdha tgfb1
C57BL/6 gapdh ywhaz gapdh ywhaz 18 s
ICR h2afz h2afz sptbn 18 s actb
B6D2F-1
7
18 s wrnip gapdh 18 s ywhaz
C57BL/6 18 s sdha actb sdha sdha
ICR sdha actb ywhaz sptbn sdha
B6D2F-1
8
tgfb1 18 s wrnip wrnip 18 s
C57BL/6 ablim actb wrnip actb actb
ICR 18 s ywhaz wrnip actb h2afz
B6D2F-1
9
actb ablim ablim actb actb
C57BL/6 tgfb1 18 s h2afz tgfb1 wrnip
ICR actb tgfb1 18 s ablim ywhaz
B6D2F-1
10
ablim actb actb ablim ablim
C57BL/6 ywhaz tgfb1 tgfb1 18 s tgfb1
[image:9.595.247.527.121.603.2]ICR strains were chosen because these strains are well-defined and frequently used in embryological research.
In this study, we compared the candidate genes and established a stability ranking using the NormFinder soft-ware. The stability of gene expression and, therefore, the choice of reference gene for ICR strains varied consider-ably based on the culture media used. The most stable reference genes for KSOM, M16, and CZB media or
in vivo embryos are the gapdh, ablim, and sptbn genes, respectively (Additional file 8: Figure S5). The geneh2afz
was the most stable reference for B6D2F-1, except that
wrnipwas more stable thanh2afz,when cultured in M16 medium (Table 2). In the B6D2F-1 and C57BL/6 strains (Table 2), the best stable reference for CZB medium is
h2afz, whereasablimis the best suitable gene for the ICR strain (Table 2). In the mouse embryos cultured in KSOM medium, the results of NormFinder software indicate that the h2afz gene is the most stable reference gene in the zygote and 8-cell stages, whereaswrnipis the most stable reference gene in the 2-cell and 4-cell stages, ywhazfor
the morulae stage, and ablim for the blastocyst stage
(Figure 3). In the mouse embryos cultured in CZB
medium, 18 s is the most stable reference gene in the
zygote stage, whereash2afzis the most stable in the 2-cell, 4-cell and morulae stages, actb for the 8-cell stage, and
wrnip for the blastocyst stage (Table 3). In M16 medium,
ywhazis the most stable housekeeping gene in the zygote and 8-cell stages. Theh2afzgene is the most stable of the reference genes in the 2-cell, 4-cell, morulae, and blastocyst stages (Table 3). This difference may be caused by culture media or the difference in developmental stages. Also, the reference gene expression levels in each of the developmental stages were shown in the different mouse strains tested (Figure 1; Additional file 5: Figure S2 and Additional file 6: Figure S3). Taken together, our observed data suggested that candidate reference genes to normalize and analyze target gene expression should be selected according to mouse strain, culture conditions, and developmental stages of the embryos.
The majority of gene expression studies on preimplan-tation embryos have been performed using only one housekeeping gene [63-65]. Contrary to our results, Chang et al. [66] reported significantly lower stability values for four reference genes (sdha, sptbn, ablimand
wrnip); for example,sptbnhad a higher stability value in our experiments. The differences in expression stability may be the result of different media or developmental stages analyzed in the compared experiments. The sec-ond observed difference relates to the ranking of the
sta-bility of the reference genes; for example, wrnip was
found to be one of the two most stable genes in a recent study, but is one of the least stable genes in our study. The regulation of reference genes is not only variety/cul-tivar specific, but may also be developmental stage- or
strain-specific and influenced by the experimental condi-tions [67-69]. Some genes have a relatively constant expression level across tissues while others do not [23]. This calls for validation and selection of appropriate housekeeping genes for specific strains and various ex-perimental conditions.
Conclusions
In the present study, we examined 3 genetic backgrounds (ICR, C57BL/6, and B6D2F-1), 6 different developmental stages (1, 2, 4, 8-cells, morulae and blastocyst), and 4 envir-onment factors (3 culture media and in vivo control) for mRNA stability and abundance of mouse preimplantation embryos. These required so many combinations to validate each embryo. Since we used oligo-dT to reverse transcribe the mRNAs, random hexamers in addition to oliogo-dT and/or reference-free method such as mRNA sequence for evaluation of each embryo were not checked. Therefore, the RNA extraction method, reference-free methods such as mRNA-sequence, and length of the poly-A tail, which has stability as well as regulatory functions (some mRNAs have long or short poly-A tail as part of their post-transcriptional mode of regulation) remain open. In sum-mary, we have evaluated the expression stability of various reference genes using different culture conditions and strain backgrounds to identify suitable reference genes for normalization, and NormFinder was used to calculate the normalization factor for different rankings. The results of this study indicate thath2afzis a better choice than other reference genes when using a single reference gene to assess target gene expression. This study provides the first assessment of new reference genes for gene expression analysis in preimplantation mouse embryos based on cul-ture conditions, mouse strain backgrounds, and embryonic stages. These candidates may serve as better reference genes than the traditional housekeeping genes in achieving valid and reliable analysis of gene expression.
Additional files
Additional file 1: Table S1.Composition of each medium used in this experiment.
Additional file 2: Table S2.Effects of EDTA on the development of 1 cell ICR mouse embryos in vitro.
Additional file 3: Figure S1.Selected reference gene specificity and amplification length.A. specific PCR product was analyzed on agarose gel (1.5%) electrophoresis for candidate housekeeping genes. Lane M : 100 bp DNA ladder marker. Lane 2 :ywhaz, Lane 3 :sdha, Lane 4 :tgfb1, Lane 5 :gapdh, Lane 6 :h2afz, Lane 7 :wrnip, Lane 8 :actb, Lane 9 :
sptbn, Lane 10 :ablim, Lane 11 :18s.B. Melting curve analysis of ten reference genes showing a single peak.
Additional file 4: Table S3.Cycle threshold values for RT- qPCR of 10 reference genes.
M16-(C), andin vivo(D)-derived embryos. The expression at zygote stage was measured as a reference to calculate the relative amounts in the dif-ferent stages.
Additional file 6: Figure S3.Candidate housekeeping gene expression levels of different transcripts detected in the C57BL/6 mouse-derived pre-implantation stage embryos. The expression levels of reference gene transcripts is shown for KSOM-(A), CZB-(B), M16-(C), andin vivo
(D)-derived embryos. The expression at zygote stage was measured as a reference to calculate the relative amounts in the different stages.
Additional file 7: Figure S4.Rankings of selected housekeeping genes inin vivo-derived each stages embryos in B6D2F-1 mouse strains: A)2-cell,B)4-cellC)8-cellD)morulae, andE)blastocyst stages. Data were obtained from A–E. Standard deviation (SD) of traditional housekeeping genes using NormFinder. The most stable genes are on the left and the least stable genes on the right. The experiments were performed in triplicate; data shown represent the mean of three inde-pendent experiments.
Additional file 8: Figure S5.Average stability rankings of ten endogenous reference genes in each stages embryos in C57BL/6 mouse strains: 2-cell,B)4- cell,C)8-cell,D)morulae, andE)blastocyst stages. Data were obtained fromA–Eand analyzed for the SD of endogenous reference genes using the NormFinder program. The most stable genes are on the left and the least stable genes on the right. The experiments were performed in triplicate; data shown represent the mean of three independent experiments.
Additional file 9: Figure S6.Rankings of ten housekeeping genes in
in vivo-derived each stages embryos in ICR mouse strains: 2-cell,B)4- cell, C)8-cell,D)morulae, andE)blastocyst stages. Data were obtained from A–E, respectively. Ranking is based on the principle that gene pairs have stable expression patterns relative to each other and are considered appropriate housekeeping genes. The most stable genes are on the left and the least stable genes on the right. The experiments were performed in triplicate; data shown represent the mean of three independent experiments.
Competing interests
The authors declare that they have no competing interests.
Authors’contributions
J-KJ and M-HK performed experimental design, embryos culture, and RT-PCR. SG, S-GC, CP, and HGS performed analyzed RT-PCR data. J-HK supervised the project and wrote the manuscript. All authors discussed the results, commented and approved the final manuscript.
Acknowledgement
This paper was written as part of Konkuk University’s research support program for its faculty on sabbatical leave in 2013.
Funding
This paper was performed by next generation of Biogreen 21 (PJ009107) from the Rural Development Administration (RDA), Republic of Korea.
Received: 9 March 2014 Accepted: 5 September 2014 Published: 25 September 2014
References
1. Whittingham DG:Culture of mouse ova.J Reprod Fertil Suppl1971,14:7–21. 2. Chatot CL, Ziomek CA, Bavister BD, Lewis JL, Torres I:An improved culture
medium supports development of random-bred 1-cell mouse embryos in vitro.J Reprod Fertil1989,86:679–688.
3. Lawitts JA, Biggers JD:Culture of preimplantation embryos.Methods Enzymol1993,225:153–164.
4. Baltz JM:Media composition: salts and osmolality.Methods Mol Biol2012,
912:61–80.
5. Dawson KM, Collins JL, Baltz JM:Osmolarity-dependent glycine accumulation indicates a role for glycine as an organic osmolyte in early preimplantation mouse embryos.Biol Reprod1998,59:225–232. 6. Hadi T, Hammer MA, Algire C, Richards T, Baltz JM:Similar effects of
osmolarity, glucose, and phosphate on cleavage past the 2-cell stage in
mouse embryos from outbred and F1 hybrid females.Biol Reprod2005,
72:179–187.
7. Gardner DK, Lane M:Amino acids and ammonium regulate mouse embryo development in culture.Biol Reprod1993,48:377–385. 8. Lane M, Gardner DK:Inhibiting 3-phosphoglycerate kinase by EDTA
stimulates the development of the cleavage stage mouse embryo.Mol Reprod Dev2001,60:233–240.
9. Biggers JD, Whittingham DG, Donahue RP:The pattern of energy metabolism in the mouse oocyte and zygote.Proc Natl Acad Sci U S A
1967,58:560–567.
10. Kaufman MH, Sachs L:Complete preimplantation development in culture of parthenogenetic mouse embryos.J Embryol Exp Morphol1976,35:179–190. 11. Quinn P, Harlow GM:The effect of oxygen on the development of
preimplantation mouse embryos in vitro.J Exp Zool1978,206:73–80. 12. Whitten WK, Biggers JD:Complete development in vitro of the
pre-implantation stages of the mouse in a simple chemically defined medium.J Reprod Fertil1968,17:399–401.
13. Brambrink T, Wabnitz P, Halter R, Klocke R, Carnwath J, Kues W, Wrenzycki C, Paul D, Niemann H:Application of cDNA arrays to monitor mRNA profiles in single preimplantation mouse embryos.Biotechniques2002,
33:376–378. 380, 382–5.
14. Bustin S:Absolute quantification of mRNA using real-time reverse transcription polymerase chain reaction assays.J Mol Endocrinol2000,25:169–193. 15. Kurimoto K, Yabuta Y, Ohinata Y, Ono Y, Uno KD, Yamada RG, Ueda HR,
Saitou M:An improved single-cell cDNA amplification method for efficient high-density oligonucleotide microarray analysis.Nucleic Acids Res2006,34:e42.
16. Abe K, Ko MS, Macgregor GR:A systematic molecular genetic approach to study mammalian germline development.Int J Dev Biol1998,
42:1051–1065.
17. Collins J, Fleming T:Specific mRNA detection in single lineage-marked blastomeres from preimplantation embryos.Trends Genet1995,11:5–7. 18. Park MR, Hwang KC, Bui HT, Cho SG, Park C, Song H, Oh JW, Kim JH:
Altered gene expression profiles in mouse tetraploid blastocysts. J Reprod Dev2012,58:344–352.
19. Tanaka TS, Jaradat SA, Lim MK, Kargul GJ, Wang X, Grahovac MJ, Pantano S, Sano Y, Piao Y, Nagaraja R, Doi H, Wood WH, Wood WH III, Becker KG, Ko MS:Genome-wide expression profiling of mid-gestation placenta and embryo using a 15,000 mouse developmental cDNA microarray.Proc Natl Acad Sci U S A2000,97:9127–9132.
20. Campbell WJ, Miller KA, Anderson TM, Shull JD, Rizzino A:Expression of fibroblast growth factor receptors by embryonal carcinoma cells and early mouse embryos.In Vitro Cell Dev Biol1992,28A:61–66. 21. Zou JW, Sun MX, Yang HY:Single-embryo RT-PCR assay to study gene
expression dynamics during embryogenesis inArabidopsis thaliana.Plant Mol Biol Report2002,20:19–26.
22. Goossens K, Van Soom A, Van Poucke M, Vandaele L, Vandesompele J, Van Zeveren A, Peelman LJ:Identification and expression analysis of genes associated with bovine blastocyst formation.BMC Dev Biol2007,
7:64.
23. Vandesompele J, De Preter K, Pattyn F, Poppe B, Van Roy N, De Paepe A, Speleman F:Accurate normalization of real-time quantitative QPCR data by geometric averaging of multiple internal controls.Genome Biol2002,
3:34.
24. Jeong YJ, Choi HW, Shin HS, Cui XS, Kim NH, Gerton GL, Jun JH:
Optimization of real time RT-PCR methods for the analysis of gene expression in mouse eggs and preimplantation embryos.Mol Reprod Dev
2005,71:284–289.
25. Mamo S, Gal AB, Bodo S, Dinnyes A:Quantitative evaluation and selection of reference genes in mouse oocytes and embryos cultured in vivo and in vitro.BMC Dev Biol2007,7:14.
26. Veazey KJ, Golding MC:Selection of stable reference genes for quantitative rt-PCR comparisons of mouse embryonic and extra-embryonic stem cells.PLoS One2011,6:e27592.
27. Llobat L, Marco-Jimenez F, Penaranda DS, Saenz-De-Juano MD, Vicente JS:
effect of embryonic genotype on reference gene selection for RT-qPCR normalization.Reprod Domest Anim2012,47:629–634.
29. Kuijk EW, Du Puy L, Van Tol HT, Haagsman HP, Colenbrander B, Roelen BA:
Validation of reference genes for quantitative RT-PCR studies in porcine oocytes and preimplantation embryos.BMC Dev Biol2007,7:58. 30. Bower NI, Moser RJ, Hill JR, Lehnert SA:Universal reference method for
real-time PCR gene expression analysis of preimplantation embryos. Biotechniques2007,42:199–206.
31. Mamo S, Carter F, Lonergan P, Leal CL, Al Naib A, Mcgettigan P, Mehta JP, Evans AC, Fair T:Sequential analysis of global gene expression profiles in immature and in vitro matured bovine oocytes: potential molecular markers of oocyte maturation.BMC Genomics2011,12:151.
32. Vallee M, Dufort I, Desrosiers S, Labbe A, Gravel C, Gilbert I, Robert C, Sirard MA:Revealing the bovine embryo transcript profiles during early in vivo embryonic development.Reproduction2009,138:95–105.
33. Paris DB, Kuijk EW, Roelen BA, Stout TA:Establishing reference genes for use in real-time quantitative PCR analysis of early equine embryos. Reprod Fertil Dev2011,23:353–363.
34. Braude P, Bolton V, Moore S:Human gene expression first occurs between the four- and eight-cell stages of preimplantation development.Nature1988,332:459–461.
35. Huang X, Hao C, Shen X, Liu X, Shan Y, Zhang Y, Chen L:Differences in the transcriptional profiles of human cumulus cells isolated from MI and MII oocytes of patients with polycystic ovary syndrome.Reproduction2013,
145:597–608.
36. Hamatani T, Carter MG, Sharov AA, Ko MSH:Dynamics of global gene expression changes during mouse preimplantation development.Dev Cell2004,6:117–131.
37. Santos F, Hendrich B, Reik W, Dean W:Dynamic reprogramming of DNA methylation in the early mouse embryo.Dev Biol2002,241:172–182. 38. Bui H-T, Wakayama S, Mizutani E, Park K-K, Kim J-H, Van Thuan N, Wakayama
T:Essential role of paternal chromatin in the regulation of transcriptional activity during mouse preimplantation development.Reproduction2011,
141:67–77.
39. Gardner DK, Lane M, Calderon I, Leeton J:Environment of the
preimplantation human embryo in vivo: metabolite analysis of oviduct and uterine fluids and metabolism of cumulus cells.Fertil Steril1996,65:349–353. 40. Lazzari G, Colleoni S, Duchi R, Galli A, Houghton FD, Galli C:Embryonic
genotype and inbreeding affect preimplantation development in cattle. Reproduction2011,141:625–632.
41. Marikawa Y, Alarcón VB:Establishment of trophectoderm and inner cell mass lineages in the mouse embryo.Mol Reprod Dev2009,76:1019–1032. 42. Zhong HY, Chen JW, Li CQ, Chen L, Wu JY, Chen JY, Lu WJ, Li JG:Selection
of reliable reference genes for expression studies by reverse transcription quantitative real-time PCR in litchi under different experimental conditions.Plant Cell Rep2011,30:641–653.
43. Dheda K, Huggett J, Bustin S, Johnson M, Rook G, Zumla A:Validation of housekeeping genes for normalizing RNA expression in real-time PCR. Biotechniques2004,37:112–114.
44. Eisen J:Zebrafish make a big splash.Cell1996,87:969–977.
45. Tang R, Dodd A, Lai D, Mcnabb W, Love D:Validation of Zebrafish (Danio rerio) reference genes for quantitative real-time qpcr normalization.Acta Biochim Biophys Sin2007,39:384–390.
46. Huggett J, Dheda K, Bustin S, Zumla A:Real-time QPCR normalisation; strategies and considerations.Genes Immun2005,6:279–284.
47. Fernandez P, DI Rienzo JA, Moschen S, Dosio GA, Aguirrezabal LA, Hopp HE, Paniego N, Heinz RA:Comparison of predictive methods and biological validation for qPCR reference genes in sunflower leaf senescence transcript analysis.Plant Cell Rep2011,30:63–74.
48. Selim M, Legay S, Berkelmann-Lohnertz B, Langen G, Kogel KH, Evers D:
Identification of suitable reference genes for real-time RT-PCR normalization in the grapevine-downy mildew pathosystem.Plant Cell Rep2012,31:205–216.
49. Bustin S:Quantification of mRNA using real-time reverse transcription (PCR QPCR): trends and problems.J Mol Endocrinol2002,29:23–39. 50. Leidenfrost S, Boelhauve M, Reichenbach M, Güngör T, Reichenbach H-D,
Sinowatz F, Wolf E, Habermann FA:Cell arrest and cell death in mammalian preimplantation development: lessons from the bovine model.PLoS One2011,6:e22121.
51. Lequarre AS, Grisart B, Moreau B, Schuurbiers N, Massip A, Dessy F:Glucose metabolism during bovine preimplantation development: analysis of gene expression in single oocytes and embryos.Mol Reprod Dev1997,
48:216–226.
52. Park M-R, Gurunathan S, Choi Y-J, Kwon D-N, Han J-W, Cho S-G, Park C, Seo HG, Kim J-H:Chitosan nanoparticles cause pre- and postimplantation embryo complications in mice.Biol Reprod2013,88(88):1–13. 53. Erkman L, Yates PA, Mclaughlin T, Mcevilly RJ, Whisenhunt T, O’connell SM,
Krones AI, Kirby MA, Rapaport DH, Bermingham JR, O'Leary DD, Rosenfeld MG:A POU domain transcription factor-dependent program regulates axon pathfinding in the vertebrate visual system.Neuron2000,28:779–792. 54. Lloyd C, Gunning P:beta- and gamma-actin genes differ in their
mechanisms of down-regulation during myogenesis.J Cell Biochem2002,
84:335–342.
55. Oishi M, Gohma H, Hashizume K, Taniguchi Y, Yasue H, Takahashi S, Yamada T, Sasaki Y:Early embryonic death-associated changes in genome-wide gene expression profiles in the fetal placenta of the cow carrying somatic nuclear-derived cloned embryo.Mol Reprod Dev2006,73:404–409. 56. Garcia-Herreros M, Aparicio IM, Rath D, Fair T, Lonergan P:Differential
glycolytic and glycogenogenic transduction pathways in male and female bovine embryos produced in vitro.Reprod Fertil Dev2012,
24:344–352.
57. Mack HI, Zheng B, Asara JM, Thomas SM:AMPK-dependent
phosphorylation of ULK1 regulates ATG9 localization.Autophagy2012,
8:1197–1214.
58. Finley LW, Haas W, Desquiret-Dumas V, Wallace DC, Procaccio V, Gygi SP, Haigis MC:Succinate dehydrogenase is a direct target of sirtuin 3 deacetylase activity.PLoS One2011,6:e23295.
59. Iwamoto D, Kasamatsu A, Ideta A, Urakawa M, Matsumoto K, Hosoi Y, Iritani A, Aoyagi Y, Saeki K:Donor cells at the G1 phase enhance homogeneous gene expression among blastomeres in bovine somatic cell nuclear transfer embryos.Cell Reprogram2012,14:20–28.
60. Kuchipudi SV, Tellabati M, Nelli RK, White GA, Perez BB, Sebastian S, Slomka MJ, Brookes SM, Brown IH, Dunham SP, Chang KC:18S rRNA is a reliable normalisation gene for real time PCR based on influenza virus infected cells.Virol J2012,9:230.
61. Fried G, Wramsby H:Increase in transforming growth factor beta1 in ovarian follicular fluid following ovarian stimulation and in-vitro fertilization correlates to pregnancy.Hum Reprod1998,13:656–659. 62. Samuel MS, Lundgren-May T, Ernst M:Identification of putative targets of
DNA (cytosine-5) methylation-mediated transcriptional silencing using a novel conditionally active form of DNA methyltransferase 3a. Growth Factors2007,25:426–436.
63. Castro CB, Whittock LD, Whittock SP, Leggett G, Koutoulis A:DNA sequence and expression variation of hop (Humulus lupulus) valerophenone synthase (VPS), a key gene in bitter acid biosynthesis.Ann Bot2008,
102:265–273.
64. Matousek J, Kocabek T, Patzak J, Skopek J, Maloukh L, Heyerick A, Fussy Z, Roldan-Ruiz I, Keukeleire DD:HlMyb3, a putative regulatory factor in hop (Humulus lupulus L.), shows diverse biological effects in heterologous transgenotes.J Agric Food Chem2007,55:7767–7776.
65. Nagel J, Culley LK, Lu Y, Liu E, Matthews PD, Stevens JF, Page JE:EST analysis of hop glandular trichomes identifies an O-methyltransferase that catalyzes the biosynthesis of xanthohumol.Plant Cell2008,
20:186–200.
66. Chang Z, Ling C, Yamashita M, Welham NV:Microarray-driven validation of reference genes for quantitative real-time polymerase chain reaction in a rat vocal fold model of mucosal injury.Anal Biochem2010,406:214–221. 67. Nicot N, Hausman JF, Hoffmann L, Evers D:Housekeeping gene selection
for real-time RT-PCR normalization in potato during biotic and abiotic stress.J Exp Bot2005,56:2907–2914.
68. Radonic A, Thulke S, Mackay IM, Landt O, Siegert W, Nitsche A:Guideline to reference gene selection for quantitative real-time PCR.Biochem Biophys Res Commun2004,313:856–862.
69. Sturzenbaum SR, Kille P:Control genes in quantitative molecular biological techniques: the variability of invariance.Comp Biochem Physiol B Biochem Mol Biol2001,130:281–289.
doi:10.1186/1756-0500-7-675