R E S E A R C H A R T I C L E
Open Access
Cost-effectiveness analysis of liraglutide versus
sitagliptin or exenatide in patients with
inadequately controlled Type 2 diabetes on oral
antidiabetic drugs in Greece
Charalampos Tzanetakos
1*, Andreas Melidonis
2, Christos Verras
2, Georgia Kourlaba
3and Nikos Maniadakis
1Abstract
Background:To evaluate the long-term cost-effectiveness of liraglutide versus sitagliptin or exenatide, added to oral antidiabetic drug mono- or combination therapy respectively, in patients with Type 2 diabetes in Greece.
Methods:The CORE Diabetes Model, a validated computer simulation model, was adapted to the Greek healthcare setting. Patient and intervention effects data were gathered from a clinical trial comparing liraglutide 1.2 mg once daily vs. sitagliptin 100 mg once daily, both combined with metformin, and a clinical trial comparing liraglutide 1.8 mg once daily vs. exenatide 10μg twice daily, both as add-on to metformin, glimepiride or both. Direct costs were reported in 2013 Euros and calculated based on published and local sources. All future outcomes were discounted at 3.5% per annum, and the analysis was conducted from the perspective of a third-party payer in Greece.
Results:Over a patient’s lifetime, treatment with liraglutide 1.2 mg vs. sitagliptin drove a mean increase in discounted life expectancy of 0.13 (SD 0.23) years and in discounted quality-adjusted life expectancy of 0.19 (0.16) quality-adjusted life years (QALYs), whereas therapy with liraglutide 1.8 mg vs. exenatide yielded increases of 0.14 (0.23) years and 0.19 (0.16) QALYs respectively. As regards lifetime direct costs, liraglutide 1.2 mg resulted in greater costs of€2797 (€1468) versus sitagliptin, and so did liraglutide 1.8 mg compared with exenatide (€1302 [€1492]). Liraglutide 1.2 and 1.8 mg doses were associated with incremental cost effectiveness ratios of€15101 and€6818 per QALY gained, respectively.
Conclusions:Liraglutide is likely to be a cost-effective option for the treatment of Type 2 diabetes in a Greek setting.
Keywords:Cost-effectiveness, Liraglutide, Type 2 diabetes, Greece
Background
Type 2 diabetes mellitus (T2DM) is a complex multifac-torial chronic progressive disease that is spread world-wide over the past three decades, making it a public health menace [1]. Accounting for approximately 90% of all diabetes cases, T2DM is shown to be associated with increased morbidity and mortality resulting in consider-able socioeconomic implications for national healthcare systems [2]. In Greece, following the prevalence patterns of other developed countries, the prevalence of T2DM among adults was estimated at 7.6% in men and 5.9% in
women [3]. According to International Diabetes Federation (IDF), the diabetes-related deaths among Greek patients aged between 20–79 years old mounted to 4906 in 2013 [4]. Furthermore, the average annual cost of treatment for a patient with T2DM in Greece was recently gauged at €1297.30 and could rise up to €2889 considering the cost of hospitalizations due to disease micro- and macrovascu-lar complications (2.3 billion Euros or 12% of total health-care expenditure) [5].
Current treatment recommendations advocate the use of lifestyle interventions (diet and exercise) and metformin as first-line therapy, with the subsequent stepwise addi-tions of an oral agent (sulphonylurea, thiazolidinedione or dipeptidyl peptidase-4 [DPP-4] inhibitor), a glucagon-like peptide 1 (GLP-1) receptor agonist or an insulin (usually * Correspondence:tzanet.haris@gmail.com
1
Department of Health Services Organisation and Management, National School of Public Health, 196 Alexandras Avenue, 11521 Athens, Greece Full list of author information is available at the end of the article
basal) [6,7]. Second and third-line drug choices are based on patient and drug characteristics, with the overarching goal of improving glycaemic control while minimizing side effects [6].
In light of drug characteristics, head-to-head clinical trial data from large, controlled studies have displayed the higher or comparable safety and efficacy of liraglutide, a longer-acting GLP-1 analogue, in terms of glycated haemo-globin (HbA1c) reduction, reductions in body weight, and the drug’s low hypoglycaemic event rates compared with other anti-hyperglycaemic agents from various antidiabetic classes such as sitagliptin, exenatide and basal insulin [8]. Hence, the multifactorial clinical profile of liraglutide has been well established and, makes it a good candidate for the treatment of patients with T2DM failing first-line anti-hyperglycaemic therapy based on the current disease man-agement guidelines [6].
Nonetheless, an antihyperglycaemic treatment may be an effective and safe option for T2DM, but it also imposes a tangible cost to the healthcare payers. The balance of treat-ment efficacy and costs should be examined to maximize value for money in healthcare spending. The aim of this study was to investigate the cost-effectiveness of liraglu-tide versus sitagliptin or exenaliraglu-tide respectively, as adjunct treatments to oral antidiabetic drug (OAD) therapy, in patients with T2DM failing first-line OAD therapy in a Greek setting.
Methods Model description
The present cost-effectiveness analysis was conducted using the CORE Diabetes Model (CDM) in order to pro-ject the long-term clinical and cost outcomes associated with liraglutide and its comparators. A detailed descrip-tion of the model’s design and operadescrip-tional features has been published elsewhere [9,10]. The CDM is an Internet-based computer simulation model developed to deter-mine the long-term health outcomes (life expectancy, quality-adjusted life expectancy, cumulative incidences of complications) and economic consequences (annual and cumulative costs per patient, costs associated with complications and treatment), as well as incremental cost-effectiveness ratios (ICER) of interventions in type 1 and type 2 diabetes. The model is a validated [9] non-product-specific, diabetes policy analysis tool that performs real-time simulations taking into account the baseline population characteristics, history of complications, vari-ous screening and treatment strategies for micro-vascular complications, treatment strategies for end-stage compli-cations, as well as other multi-factorial interventions. Dis-ease progression relies upon a series of inter-dependent Markov sub-models that simulate progression of disease related complications (angina, myocardial infarction, congestive heart failure, stroke, peripheral vascular disease,
diabetic retinopathy, macula oedema, cataract, hypoglycaemia, ketoacidosis, nephropathy and end-stage renal disease, neuropathy, foot ulcer, amputation, depression, and non-specific mortality). Each sub-model uses time, state and diabetes type-dependent probabilities derived from pub-lished sources and utilizes tracker variables to overcome the memory-less properties of standard Markov models, allowing interconnectivity and interaction between indi-vidual complication sub-models.
Simulated cohorts and treatment effects
For the comparison of liraglutide versus sitagliptin 100 mg once daily, both as add-on to metformin monotherapy, a patient cohort was defined with baseline demographics, baseline complications and physiological parameters rep-resentative of the patients enrolled in the respective treat-ment arms of the randomized head-to-head clinical trial (1860 Study Group) after being poorly controlled with metformin alone [11]. The chosen dose for liraglutide was 1.2 mg once daily following common clinical practice in Greece (standard dose). As regards the treatment com-parison of liraglutide versus exenatide, baseline patient cohort characteristics were elicited from the Liraglutide Effect and Action in Diabetes 6 (LEAD 6) randomized head-to-head clinical trial in which patients, inadequately controlled on metformin, sulfonylurea, or both, were assigned to receive additional liraglutide 1.8 mg once daily or exenatide 10 μg BID [12]. Note the dose-escalation of liraglutide from 1.2 mg to 1.8 mg was preserved in the model analysis since no clinical data was available for 1.2 mg dose. A subgroup of patients (65%) was assumed to take also glimepiride in conjunction with metformin. Furthermore, a cohort reflective of typical Greek patients was considered and inserted in the sensitivity analysis of liraglutide versus sitagliptin or exenatide, with data ex-tracted from Liatis et al. study [13] and other local sources (Table 1). Where input data were missing, data from 1860 clinical trial were encompassed. All simulated cohorts are shown in Table 1.
Table 1 Baseline patients’characteristics of 1860, LEAD-6 and Greek simulated cohorts
1860 LEAD-6 Greek*
Patient demographics
Baseline age (years) 55.3 (9.2) 56.7 (10.3) 64.5 (10.5)
Duration of diabetes (years) 6 (5.1) 8.2 (6) 10.4 (8.3)
Percentage male 52.9% 51.9% 51.5%
Baseline risk factors
HbA1c (%) 8.4 (0.8) 8.2 (1.0) 8.2 (1.8)
Systolic blood pressure (mmHg) 132.2 (14.5) 133.0 (16.6) 139.8 (19.3)
Total cholesterol (mmol/l) 4.79 (0.38) 4.7 (0.95) 5.5 (−)
HDL (mmol/l) 1.16 (0.31) 1.2 (0.3) 1.2 (0.3)
LDL (mmol/l) 2.65 (0.82) 2.95 (0.8) 3.7 (1.0)
Triglycerides (mmol/l) 2.38 (2.22) 2.15 (1.35) 1.9 (1.4)
Body mass index (kg/m2) 32.8 (5.2) 32.9 (5.7) 30.4 (5.3)
Proportion smoker¶ 36.0% 36.0% 36.0%
Cigarettes per day¶ 18.7 18.7 18.7
Alcohol consumption (Oz/week)¶ 15.91 15.91 15.91
Racial characteristics
Proportion White 90% 80.6% 100%
Proportion Black 7.5% 5.5% 0%
Proportion Hispanic 0% 12.4% 0%
Proportion Native American 0.5% 1.3% 0%
Proportion Asian/Pacific Islander 2% 0.2% 0%
Baseline CVD complications
Proportion with myocardial infarction 2.7% 2.6% 12.8%
Proportion with angina 1.8% 1.9% 5.0%
Proportion with peripheral vascular disease 0.9% 0.6% 5.6%
Proportion with stroke 0.8% 0.2% 8.1%
Proportion with congestive heart failure 0.4% 1.5% 4.2%
Proportion with atrial fibrillation 1.5% 1.5% 9.1%
Proportion with left ventricular hypertrophy 0.2% 0.2% 3.1%
Baseline renal complications
Proportion with microalbuminuria 1.1% 1.1% 1.1%
Proportion with gross proteinuria 0.2% 0.2% 0.2%
Proportion with end-stage renal disease 0.4% 0.6% 0.4%
Baseline retinopathy complications
Proportion with BDR 2.7% 1.1% 25%
Proportion with PDR 0.2% 0.2% 4%
Proportion with severe vision loss 0.4% 0.6% 4.5%
Baseline macular edema
Proportion with macular edema 1.1% 0.2% 1.1%
Baseline cataract
Proportion with cataract 1.7% 6.9% 1.7%
Baseline foot ulcer complications
Prop. uninfected ulcer 0.6% 0.2% 0.6%
treatment duration and returned to baseline level follow-ing treatment switchfollow-ing. Major and minor hypoglycaemic rates were based on 1860 and LEAD-6 trials [11,12] for the first 5 years of simulation, and on LEAD-5 trial [14] for the remainder of model duration.
Costs and utilities
The present analysis was conducted from a third-party payer perspective (National Organisation for Healthcare Services Provision [EOPYY]) and only direct healthcare costs were included in the model (Table 3). The daily drug costs were calculated by combining the daily dose of antihyperglycaemic agents, as retrieved from the corresponding clinical trials and validated by two autho-rized local diabetologist experts reflecting also current medical practice in Greece, with the drug unit costs pro-vided by the most recent price bulletin issued by the Greek Ministry of Health [15] in conjunction with the internal reference price system attached to the latest
[image:4.595.56.538.101.187.2]published positive drug list. More specifically, the drug unit costs were based on the social security reimbursement prices minus the patient co-payment, a rebate of 9% im-posed upon manufacturers to get into the positive drug list and another rebate based on volume which can be up to 8% depending on quarterly sales (law 4052/2012, Govern-ment Gazette). Finally, a conservative 5% volume-related rebate was considered on top of the 9%. Apart from anti-hyperglycaemic medication costs, the direct healthcare costs also reflected and encapsulated thoroughly the resource consumption incurred for the management of patients with diabetes and their developed complications. In particular, costs associated with patients’hospitalization, outpatient visits, screening, concomitant medication, laboratory tests and management of hypoglycaemic events were considered (Table 3). All cost data were reported in 2013 values (€). Data for resource utilization for the man-agement of T2DM and its complications were retrieved from diabetologist experts’ opinion. In addition, where Table 1 Baseline patients’characteristics of 1860, LEAD-6 and Greek simulated cohorts(Continued)
Prop. healed ulcer 0.0% 0.0% 0.0%
Prop. history of amputation 0.0% 0.2% 0.0%
Baseline neuropathy
Proportion with neuropathy 11.6% 7.8% 14.7%
Baseline depression
Proportion with depression† 0% 0% 9%
Data are mean (SD). *In the Greek cohort, all demographic and physiological parameters were retrieved from S. Liatis et al. study [13], while the renal, foot ulcer, macular oedema and cataract complications values were assumed to be the same as for 1860 cohort. All other diabetes-related complications were taken from National School of Public health (data on file) and racial characteristics from Hellenic Statistical Authority (www.statistics.gr).¶Considering all cohorts, the smoking status and number of cigarettes per day were elicited from National School of Public health, Healthcare map 2011 (data on file), whereas the alcohol consumption estimate from S. Liatis et al. study [13].†Proportion with depression assumed to be 0 in 1860 and LEAD-6 cohorts. Liraglutide Effect and Action in Diabetes 6 = LEAD-6; HbA1c = glycated haemoglobin; HDL = high-density lipoprotein; LDL = low-density lipoprotein; CVD = cardiovascular disease; BDR = background diabetic retinopathy; PDR = proliferative diabetic retinopathy.
Table 2 Summary of treatment effects: 1860 and LEAD-6 trials & long-term progression approach
Risk Factor 1860 clinical trial* LEAD-6 clinical trial¶ Long-term progression
Liraglutide (1.2 mg)
Sitagliptin (100 mg)
Liraglutide (1.8 mg)
Exenatide BID (10μg)
All comparators
Mean SD Mean SD Mean SD Mean SD
Change from baseline in HbA1c (%) −1.24 1.04 −0.90 1.04 −1.12 1.22 −0.79 1.22 No HbA1c creep assumption
Change from baseline in SBP (mm Hg) −0.55 13.23 −0.94 13.17 −2.51 17.55 −2.00 17.93 UKPDS progression
Change from baseline in total cholesterol (mmol/l) −0.03 0.82 −0.02 0.80 −0.20 1.02 −0.09 1.01 Framingham progression
Change from baseline in LDL (mmol/l) 0.08 0.69 0.13 0.68 −0.44 0.84 −0.40 0.84 Framingham progression
Change from baseline in HDL (mmol/l) 0.00 0.17 0.00 0.17 −0.04 0.23 −0.05 0.23 Framingham progression
Change from baseline in triglycerides (mmol/l) −0.19 1.42 −0.40 1.38 −0.41 1.50 −0.23 1.48 Framingham progression
Change from baseline in BMI (kg/m2) −1.00 0.08 −0.34 0.08 −1.15 1.35 −1.02 1.47 Constant after returning to baseline
Major hypoglycaemia (events per 100 patient-years) 1.00 0.00 0.00 2.00 0.00#
Minor hypoglycaemia (events per 100 patient-years) 17.80 10.60 193.20 260.00 128.70#
*P between treatment arms < 0.001 for change in HbA1c and BMI.¶
P between treatment arms < 0.0001 for change in HbA1c and P < 0.05 for change in triglycerides and minor hypoglycaemic events.#
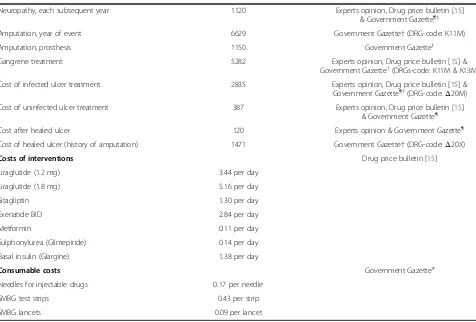
[image:4.595.62.540.522.698.2]Table 3 Health state, event, drug acquisition and consumable costs used in the analysis, expressed in 2013 Euros (€)
Cost description Costs (€) Reference
Management costs
Annual cost of statins 147.97 Experts opinion & Drug price bulletin [15]
Annual cost of aspirin 14.41 Experts opinion & Drug price bulletin [15]
Annual cost of ACE inhibitors 78.32 Experts opinion & Drug price bulletin [15]
Annual cost of screening for microalbuminuria 8.66 Government Gazette*
Annual cost of screening for gross proteinuria 8.66 Government Gazette*
Annual cost of stopping ACEIs due to side effects 15.00 Experts opinion
Annual cost of eye screening 10.00 Experts opinion & Government Gazette¶
Annual cost of foot screening program 10.00 Experts opinion & Government Gazette¶
Annual cost of non-standard ulcer treatment 0.00 This is a patient’s expenditure
Annual cost of anti-depression treatment 154.50 Experts opinion & Drug price bulletin [15]
Annual cost of screening for depression 10.00 Experts opinion & Government Gazette¶
Direct costs of cardiovascular complications
Myocardial infarction, 1st year of event 6000 G. Kourlaba et al. [19]
Myocardial infarction, each subsequent year 1964 G. Kourlaba et al. [19]
Angina, 1st year of event 3613 National School of Public Health (data on file)
Angina, each subsequent year 1197 National School of Public Health (data on file)
Congestive heart failure, year of onset 3910 National School of Public Health (data on file)
Congestive heart failure, each subsequent year 1398 National School of Public Health (data on file)
Stroke, 1st year of event 4406 G. Kourlaba et al. [19]
Stroke, each subsequent year 1976 G. Kourlaba et al. [19]
Stroke, death within 30 days 3675 Government Gazette†(DRG-code: N30Mα)
& G. Kourlaba et al. [19]
Peripheral vascular disease, year of onset 5713 G. Kourlaba et al. [20]
Peripheral vascular disease, each subsequent year 1426 G. Kourlaba et al. [20]
Direct costs of renal complications
Hemodialysis, first year 40352 D. Kaitelidou et al. & K. Souliotis et al. [17,18]
Hemodialysis, each subsequent year 40352 Assumed equal with 1st year hemodialysis cost
Peritoneal dialysis, first year 46156 Experts opinion & Government Gazette†
(DRGs-code:Υ28Αand Y02M)
Peritoneal dialysis, each subsequent year 43656 Experts opinion & Government Gazette†
(DRG-code:Υ28Α)
Kidney transplant, first year 18489 S. Sidiropoulos [21]
Kidney transplant, each subsequent year 5400 K. Souliotis et al. [17]
Direct costs of acute events
Major hypoglycaemic event 700 National School of Public Health (data on file)
Minor hypoglycaemic event 250 National School of Public Health (data on file)
Direct costs of eye disease
Cost of laser treatment 731 Government Gazette†(DRG-code: O03A)
Cost of cataract operation 933 Government Gazette†(DRG-code: O15A)
Cost following cataract operation 59 Experts opinion & Drug price bulletin [15]
Cost of blindness in year of onset 11280 Experts opinion & K. Athanasakis et al. [16]
Cost of blindness in subsequent years 6200 Experts opinion & K. Athanasakis et al. [16]
Direct costs of neuropathy, foot ulcer and amputation
Neuropathy, year of onset 1120 Experts opinion, Drug price bulletin [15]
available, cost of complications was extracted directly from published studies or other local sources [16-21] and cost data, not available in 2013 values, were inflated using the corresponding health inflation rates reported by the National Statistical Service [22]. Moreover, unit price
data were obtained from the “Government Gazette”,
as well as from data on file maintained by the National School of Public Health. Health state utility and event disutility values were the same as for an older cost-effectiveness analysis of liraglutide versus sitagliptin in the UK setting [23].
Cost-effectiveness analysis
A non-parametric bootstrapping approach was employed for this health economic analysis. After running 1000 sim-ulations over a cohort of 1000 non-identical patients gen-erated with mean and standard deviation (SD) values, 1000 bootstrap samples were drawn. For each bootstrap iteration, the progression of diabetes was simulated in
[image:6.595.59.535.110.432.2]the patient cohort, to calculate mean (SD) costs, life expectancy and quality-adjusted life expectancy [10]. The results from the bootstrapped simulations were used to generate acceptability curves. Although there is no official willingness-to-pay threshold for Greece, a treatment was considered to be cost-effective at a threshold of€34000 per quality-adjusted life year (QALY) gained. This is based on the World Health Organisation (WHO) guidelines that state that a treatment should be considered cost-effective if the ICER is between 1 or 3 times the Gross Domestic Product (GDP) per capita of that country and a treatment is considered highly cost-effective at less than 1 times the GDP per capita [24]. Using current prices, the International Monetary Fund (IMF) esti-mated Greek GDP per capita at€17000 [25]. In the base case, quality-adjusted life expectancy and future costs were discounted at a rate of 3.5% annually which is the standard practice in Greece [26] and simulations were run over patients’ lifetimes.
Table 3 Health state, event, drug acquisition and consumable costs used in the analysis, expressed in 2013 Euros (€)
(Continued)
Neuropathy, each subsequent year 1120 Experts opinion, Drug price bulletin [15]
& Government Gazette¶‡
Amputation, year of event 6629 Government Gazette†(DRG-code: K11M)
Amputation, prosthesis 1150 Government Gazette‡
Gangrene treatment 5282 Experts opinion, Drug price bulletin [15] &
Government Gazette†(DRGs-code: K11M & K13M)
Cost of infected ulcer treatment 2835 Experts opinion, Drug price bulletin [15] &
Government Gazette¶†(DRG-code:Δ20Μ)
Cost of uninfected ulcer treatment 387 Experts opinion, Drug price bulletin [15]
& Government Gazette¶
Cost after healed ulcer 120 Experts opinion & Government Gazette¶
Cost of healed ulcer (history of amputation) 1471 Government Gazette†(DRG-code:Δ20Χ)
Costs of interventions Drug price bulletin [15]
Liraglutide (1.2 mg) 3.44 per day
Liraglutide (1.8 mg) 5.16 per day
Sitagliptin 1.30 per day
Exenatide BID 2.84 per day
Metformin 0.11 per day
Sulphonylurea (Glimepiride) 0.14 per day
Basal insulin (Glargine) 1.38 per day
Consumable costs Government Gazette#
Needles for injectable drugs 0.17 per needle
SMBG test strips 0.43 per strip
SMBG lancets 0.09 per lancet
*Reimbursement for screening tests (Ministerial Decree,Α4 /2878/4-6-1992). ¶
Reimbursement for a doctor’s office visit (Presidential Decree, FEK 262A’/16-12-2011).
†Reimbursement for diagnosis-related groups (Common Ministerial Decree, FEK 946B’/27-3-2012). ‡EOPYY Health Provision Policy Regulation (Common Ministerial Decree, FEK 3054B’/18-11-2012).
#
Reimbursement for consumables (Common Ministerial Decree, FEK 1561B’/21-06-2013).
Sensitivity analyses
Univariate sensitivity analyses were performed for both treatment comparisons (1000 bootstrap iterations for each scenario) in order to evaluate the key drivers and robust-ness of the base case cost-effectiverobust-ness results. Specifically, individual parameters such as discount rate, cost of com-plications and treatment duration, were varied between low and high values within plausible ranges, whereas time horizon parameter was tested in a series of lower than base case values. In respect of parameters like disutility of major and minor hypoglycaemic events, values were removed or set all to one distinct value (−0.0052), as used in the National Institute for Health and Care Excellence (NICE) technology appraisal of insulin glargine [27]. For physiological parameters such as treatment effects in HbA1c, systolic blood pressure (SBP), blood lipids and BMI, the reported upper and lower 95% confidence inter-val (CI) in clinical trials for liraglutide arm were applied in the analyses. Further, the BMI benefit was assumed to be preserved after dropping incretin-based therapy. New pa-rameters’data were also tested via employing the United Kingdom Prospective Diabetes Study (UKPDS) progres-sion equation for the first five years of the simulation or the Greek cohort characteristics instead of baseline patients’characteristics from the clinical trials. Under the same rationale, as part of the follow-up to the 1860 clin-ical trial, one year clinclin-ical data for liraglutide vs. sitagliptin were also examined as well as a new treatment path involving a switch from sitagliptin to liraglutide after one year based on the 52- and 78-week extension studies, respectively [28,29]. Last, in an attempt to compare exena-tide with 1.2 mg liragluexena-tide, we used the price of the 1.2 mg dose and ran scenarios with efficacy set to 100%, 90%, 80% and 70% of the 1.8 mg dose. This approach is based on observed values in LEAD1-4 studies [8], where the clinical effectiveness of liraglutide 1.2 mg found to be between 80-90% of the 1.8 mg dose, depending on the parameter in scope.
Results
Base case analyses Liraglutide vs. sitagliptin
Compared with sitagliptin, liraglutide resulted in mean in-creases in discounted life expectancy and quality-adjusted life expectancy of 0.13 years (SD 0.23) and 0.19 QALYs (0.16) respectively, and was also correlated with greater lifetime health expenditures (€2797 [SD 1468]). Moreover, liraglutide was accompanied with lower cumulative inci-dence rates of long-term complications such as myocar-dial infarction, stroke and amputation (liraglutide: 17.16%, 8.79%, and 10.06% vs. sitagliptin: 17.83%, 9.24% and 10.54% respectively; Table 4). Considering both liraglutide and sitagliptin treatment arms, the largest component of lifetime direct costs was the drug acquisition costs,
accounting for 38.13% versus 30.60% of total costs re-spectively, while the second largest comprised of the ac-crued ulcer, amputation and neuropathy costs (16.86% vs. 19.42% respectively). Based on the aforementioned health
and cost outcomes, an ICER of€15101 per QALY gained
was estimated for liraglutide (Table 5). The probability of liraglutide 1.2 mg being a cost-effective therapeutic option at a willingness-to-pay threshold of €30000 per QALY gained was above 70% (72.5%) (Figure 1).
Liraglutide vs. exenatide
In comparison with exenatide, mean increases in dis-counted life expectancy and quality-adjusted life expect-ancy of 0.14 years (SD 0.23) and 0.19 QALYs (0.16) were associated with liraglutide 1.8 mg over a patient’s lifetime. These clinical benefits were endorsed by the reduced cu-mulative incidence of diabetes-related complications noted in the liraglutide arm (Table 4). Relating to the lifetime dir-ect costs, liraglutide maintained a more costly profile and was connected with higher mean costs of€1302 (SD 1492) with major cost contributor being again the drug acquisi-tion costs (proporacquisi-tion of total costs: 42.80% for liraglutide vs. 35.60% for exenatide). The second most significant cost driver remained the costs related to the diabetic foot and neuropathy complications (13.55% for liraglutide vs. 35.60% for exenatide). The ICER of liraglutide versus exe-natide was estimated at€6818 per QALY gained (Table 5).
At a willingness-to-pay threshold of €30000 per QALY
gained, liraglutide was found to be the accepted interven-tion in over 83.2% of cases (Figure 1).
Sensitivity analyses
two times (117%) since the HbA1c benefit of liraglu-tide 1.2 mg was not preserved. Changes in other physio-logical measures, as well as utility decrements attached to hypoglycaemic events, had leaner impact on the liraglutide 1.2 mg ICERs. In the Greek cohort analysis, although a quite elevated ICER (increased by 61.3%) was traced, yet liraglutide 1.2 mg continued to be a cost-effective option at the defined willingness-to-pay threshold. Likewise, when we varied the length of liraglutide treatment between 3 and 7 years towards replicating a real-life setting the cost-effective profile of liraglutide treatment was retained. 52-week clinical data were associated with an ICER reduced by 30%, while switching patients to liraglutide after 1 year of sitagliptin treatment demonstrated a greater ICER noting a 32.2% increase. Last, comparing liraglutide 1.2 mg with exenatide showed that the liraglutide treatment is the dominant strategy in all efficacy scenarios. As regards lira-glutide 1.8 mg, similar trends were found (Table 6).
Discussion
Long-term projections suggested that once daily doses of 1.2 and 1.8 mg of liraglutide treatment result in greater
improvements in life-expectancy and quality-adjusted life expectancy, as well as reduced incidence rates of diabetes-related complications compared with once daily 100 mg sitagliptin or twice daily 10 μg exenatide, respectively. From a third-party perspective (EOPYY), evaluation of cost-effectiveness based on quality-adjusted life expect-ancy of 1.8 and 1.2 mg liraglutide doses generated ICERs
varying from €6818 to €15101 per QALY gained,
re-spectively. These ICERs, in fact, lie below the
thresh-old of €34000 per QALY gained and, thus, liraglutide
1.2 mg combined with metformin monotherapy and liraglutide 1.8 mg combined with metformin and sul-phonylurea are found to be highly cost-effective strat-egies for the treatment of T2DM versus sitagliptin or exenatide, respectively. In the base case analysis, lira-glutide treatment was associated with higher direct
medical costs over patients’ lifetime, mainly due to
[image:8.595.61.538.100.435.2]increased drug acquisition costs. However, these were partially curbed by the cost savings marked in the treatment of diabetes-related complications due to the lower risk of unfolding these complications with liraglutide therapy.
Table 4 Cumulative incidence of long-term complications for liraglutide, sitagliptin and exenatide BID*
Complication Liraglutide 1.2 mg Sitagliptin Difference Liraglutide 1.8 mg Exenatide BID Difference
Eye disease, %
Background retinopathy 17.18 (1.26) 19.26 (1.29) −2.08 18.64 (1.24) 20.91 (1.27) −2.27
Proliferative retinopathy 0.51 (0.22) 0.67 (0.27) −0.15 0.61 (0.25) 0.78 (0.27) −0.17
Severe vision loss 6.78 (0.76) 7.51 (0.83) −0.73 6.59 (0.78) 7.46 (0.86) −0.87
Macular edema 13.59 (1.11) 15.44 (1.14) −1.85 12.95 (1.04) 14.88 (1.08) −1.93
Cataract 10.62 (0.96) 11.11 (1.02) −0.49 10.27 (1.02) 10.85 (1.05) −0.58
Renal disease, %
Microalbuminuria 24.22 (1.35) 27.02 (1.44) −2.80 28.95 (1.43) 31.87 (1.55) −2.92
Gross proteinuria 5.07 (0.71) 6.38 (0.78) −1.30 6 (0.78) 7.26 (0.81) −1.26
End-stage renal disease 0.58 (0.23) 0.83 (0.29) −0.26 0.65 (0.26) 0.90 (0.3) −0.26
Diabetic foot & neuropathy, %
Foot ulcer 30.91 (1.42) 32.97 (1.48) −2.07 28.36 (1.35) 30.21 (1.4) −1.85
Amputation 10.06 (1.05) 10.54 (1.01) −0.48 8.63 (0.98) 9.13 (1.01) −0.51
Neuropathy 47.51 (1.75) 52.27 (1.69) −4.76 45.74 (1.61) 50.13 (1.71) −4.39
Cardiovascular disease, %
Congestive heart failure 13.23 (1.05) 14.29 (1.08) −1.06 13.54 (1.09) 14.31 (1.15) −0.78
Peripheral vascular disease 9.34 (0.90) 10.82 (1) −1.49 8.69 (0.88) 10.43 (0.94) −1.73
Angina 13.01 (1.11) 13.52 (1.11) −0.51 12.05 (1.02) 12.87 (1.08) −0.82
Stroke 8.79 (0.95) 9.24 (0.91) −0.46 8.69 (0.94) 9.45 (0.92) −0.76
Myocardial infarction 17.16 (1.19) 17.83 (1.22) −0.68 16.31 (1.17) 17.55 (1.25) −1.24
Hypoglycaemia, %
Major hypoglycaemia 0.11 (0.01) 0 (0) 0.11 0 (0) 0.22 (0.02) −0.22
Minor hypoglycaemia 23.63 (0.48) 22.88 (0.45) 0.75 31.66 (0.50) 34.49 (0.46) −2.84
In various country-specific settings, earlier published cost-effectiveness analyses have been focused on com-paring liraglutide with sitagliptin or exenatide. Based on the results of the present analysis, we reach similar con-clusions as these previous evaluations where liraglutide was demonstrated to be a cost-effective strategy, under
[image:9.595.58.540.99.435.2]the reported willingness-to-pay thresholds, from a health-care payer perspective. In specific, regarding the liraglutide 1.2 mg versus sitagliptin comparison, Lee et al. [30] calcu-lated an ICER of $25742/QALY gained for the former treatment in the United States (US), while in the United Kingdom Davies et al. [23] found the subcutaneous
Table 5 Health and economic outcomes (ICERs) of the base case analyses
Liraglutide 1.2 mg Sitagliptin Difference
Discounted life expectancy (years) 14.22 (0.18) 14.09 (0.17) 0.13 (0.23)
Discounted quality-adjusted life expectancy (QALYs) 9.24 (0.12) 9.05 (0.11) 0.19 (0.16)
Discounted total lifetime direct medical costs (€) 39524 (1100) 36727 (1113) 2797 (1468)
Drug acquisition 15069 11240 3829
Patient management* 1939 1928 11
Cardiovascular disease 5858 6170 −312
Renal disease 1146 1253 −107
Diabetic foot and neuropathy 6665 7132 −467
Eye disease 5325 5676 −351
Hypoglycaemia 3522 3329 193
ICER (€per QALY gained) 15101
Liraglutide 1.8 mg Exenatide BID Difference
Discounted life expectancy (years) 14.10 (0.17) 13.96 (0.16) 0.14 (0.23)
Discounted quality-adjusted life expectancy (QALYs) 9.22 (0.12) 9.03 (0.11) 0.19 (0.16)
Discounted total lifetime direct medical costs (€) 43236 (1049) 41934 (1065) 1302 (1492)
Drug acquisition 18505 14927 3578
Patient management* 1931 1920 11
Cardiovascular disease 5544 5980 −436
Renal disease 1611 1692 −81
Diabetic foot and neuropathy 5859 6317 −458
Eye disease 4461 4948 −487
Hypoglycaemia 5326 6149 −823
ICER (€per QALY gained) 6818
Values shown are means with SDs in parentheses. *Concomitant medication and screening. QALY = quality-adjusted life year;€= 2013 Euros; ICER = incremental cost-effectiveness ratio.
0 10 20 30 40 50 60 70 80 90 100
0 10000 20000 30000 40000 50000 60000 70000 80000 90000 100000
Probability that liraglutide therapy
will be cost-effective
Willingness to pay ( per QALY gained)
Liraglutide vs. exenatide
Liraglutide vs. sitagliptin
[image:9.595.56.540.560.714.2]treatment to be associated with an ICER of £9851/QALY gained. Similarly, in Spain [31] liraglutide 1.2 mg resulted in an ICER of€13266/QALY gained. Considering the lira-glutide 1.8 mg versus exenatide (BID) comparison, the
[image:10.595.61.539.101.655.2]former treatment exhibited an ICER of $40282/QALY gained in the US payer setting [32], while in the European Union setting (in six different countries: Switzerland, Denmark, Norway, Finland, The Netherlands, and Austria)
Table 6 Summary of results of the sensitivity analyses
Sensitivity analysis Liraglutide 1.2 mg vs. sitagliptin Liraglutide 1.8 mg vs. exenatide BID
Difference in QALYs
Difference in costs [€]
ICER [€per QALY gained] Difference in QALYs
Difference in costs [€]
ICER [€per QALY gained]
Base case 0.19 (0.16) 2797 (1468) 15101 0.19 (0.16) 1302 (1492) 6818
Model time horizon:
30 years 0.18 (0.15) 2857 (1428) 15767 0.18 (0.15) 1380 (1541) 7874
20 years 0.12 (0.11) 2946 (1186) 23797 0.12 (0.12) 1531 (1218) 12531
10 years 0.06 (0.06) 3569 (791) 61595 0.05 (0.06) 2306 (774) 43977
5 years 0.04 (0.02) 3787 (452) 106618 0.03 (0.03) 2458 (516) 84503
Discount rate:
0% 0.34 (0.31) 2319 (2759) 6776 0.36 (0.30) 552 (2767) 1529
6% 0.13 (0.11) 2879 (1057) 22353 0.13 (0.11) 1529 (1081) 11754
Costs of complications:
Increased by 10% 0.19 (0.16) 2694 (1605) 14541 0.19 (0.16) 1074 (1630) 5625
Decreased by 10% 0.19 (0.16) 2902 (1323) 15666 0.19 (0.16) 1531 (1355) 8020
Physiological parameters:
HbA1c 95% upper limit 0.23 (0.15) 2411 (1565) 10334 0.26 (0.16) 798 (1500) 3101
HbA1c 95% lower limit 0.14 (0.16) 3270 (1557) 23725 0.12 (0.16) 1947 (1500) 15961
UKPDS creep of HbA1c for 5 years 0.10 (0.15) 3362 (1597) 32756 0.10 (0.15) 1922 (1613) 18940
SBP 95% upper limit 0.20 (0.16) 2784 (1517) 14086 0.21 (0.15) 1142 (1500) 5380
SBP 95% lower limit 0.18 (0.15) 2897 (1468) 16246 0.19 (0.15) 1375 (1444) 7327
Lipid 95% upper limit 0.22 (0.16) 2744 (1541) 12693 0.22 (0.15) 1162 (1605) 5373
Lipid 95% lower limit 0.17 (0.16) 2781 (1492) 16577 0.16 (0.15) 1459 (1525) 9400
BMI 95% upper limit 0.20 (0.15) 2810 (1500) 13823 0.20 (0.17) 1274 (1484) 6231
BMI 95% lower limit 0.18 (0.16) 2820 (1500) 16030 0.18 (0.16) 1269 (1460) 7263
BMI benefit maintained 0.25 (0.15) 2759 (1476) 11105 0.21 (0.16) 1312 (1492) 6408
Hypoglycaemia:
No hypo disutility 0.19 (0.16) 2797 (1468) 14867 0.18 (0.16) 1302 (1492) 7272
Disutility of−0.0052 for all hypos 0.19 (0.16) 2797 (1468) 15118 0.19 (0.16) 1302 (1492) 6699
Treatment duration:
7 years 0.20 (0.15) 3941 (1428) 19773 0.20 (0.17) 2114 (1557) 10458
3 years 0.19 (0.17) 1329 (1500) 7123 0.19 (0.16) 275 (1460) 1480
Greek cohort data 0.12 (0.14) 3008 (1775) 24355 0.12 (0.15) 1586 (1928) 13424
52 week clinical data 0.22 (0.17) 2309 (1508) 10564
Liraglutide delayed by 1 year 0.12 (0.16) 2340 (1581) 19960 - -
-Liraglutide 1.2 mg cost &:
100% of 1.8 mg efficacy - - - 0.19 (0.16) −1473 (1492) Lira. Dominant
90% of 1.8 mg efficacy - - - 0.14 (0.15) −1016 (1500) Lira. Dominant
80% of 1.8 mg efficacy - - - 0.08 (0.15) −625 (1613) Lira. Dominant
70% of 1.8 mg efficacy - - - 0.02 (0.15) −126 (1525) Lira. Dominant
liraglutide was associated with ICERs ranged between €6902 and €13546/QALY gained [33]. Overall, the results across the various country-specific settings are in line with results reported here and no meaningful deviations were traced.
In general, the sensitivity analyses indicated that these results were robust under a range of assumptions. In the liraglutide against sitagliptin comparison, the key drivers of cost-effectiveness were HbA1c and weight (to a lesser extent), with only small impact from the rest of the physiological parameters. These findings, are in accord-ance with previous cost-effectiveness studies [23,31], as well as the higher efficacy of liraglutide versus sitagliptin in decreasing HbA1c and weight reported in the 1860 clinical study. In to the liraglutide against exenatide comparison, HbA1c was the most important driver of cost-effectiveness in line with previous literature [32,33], with only small effects from the other physiological parameters. This is a quite reassuring remark, since the HbA1c effect was the primary efficacy endpoint of the LEAD 6 trial and benefit in HbA1c related with liraglu-tide was shown to be significantly greater than that observed with exenatide. In light of both treatment com-parisons, remarkably lower ICERs were yielded in case of 3 year treatment duration, as the accumulated effect-iveness of each therapy reached almost at the same level of the base case, whereas the respective direct total costs incurred by patients were significantly lower given the shortening of drugs usage duration. This outcome, indeed, is quite interesting and may be in need of further investigation at a later date. In respect of time horizon assumptions, the cost-effectiveness results were quite sensitive (upward trend) to deviations from baseline model timeframe, most probably on grounds of the con-siderable lag time in the manifestation of diabetes com-plications after long periods of poor glycaemic control. The shortening of simulation time horizons to this extent halters the emergence of any relative differences in complication rates. Additionally, when Greek cohort data geared higher ICERs were estimated. This could be attributed to the fact that the Greek intervention cohort might have been in a more advanced stage of disease progression, since the mean age and duration of diabetes were significantly higher than in the 1860 and LEAD-6 trial cohorts, and so did some mean baseline biochem-ical risk characteristics and proportions with comorbid-ity complications (Table 1). In this respect, the aging process alongside with the overall worse baseline cohort features likely had more severe consequences in patients’ health during model simulations, resulting, thus, in much lower accumulated QALYs considering all treatment com-parators. Nonetheless, it should be stressed that the ICER values were found to be below the threshold of €34000 per QALY gained and, therefore, liraglutide treatment
continued to be a cost-effective option. Furthermore, delaying liraglutide 1.2 mg treatment by 1 year was an un-favourable option (increased ICER) similar to findings in a previous study carried out in Spain [31]. The displayed liraglutide 1.2 mg dominance over exenatide was expected given the current clinical and cost data.
Several potential limitations to this study should be con-sidered. First, the generalizability of the present findings is constrained to those patients with relatively advanced disease (Table 1), who were insufficiently controlled with OADs. Moreover, based on three recent studies [34-36] and clinical experts opinion it was assumed that HbA1c could be maintained over time with adequate pharmaco-therapy, in both insulin and non-insulin users, in contrast to the UKPDS progression equation according to which, HbA1c levels gradually increase as beta-cell function diminishes over time [10]. In this regard, the results of the present study are fully related to this assumption in an at-tempt to best reflect current clinical practice. Additionally, like all models used to gauge the long-term outcomes of patients with T2DM, this model makes long-term projec-tions of outcomes relied upon the findings of short-term studies. Nevertheless, the CDM has been validated against real life data demonstrating a reliable predicting analysis behaviour [9].
Conclusions
To conclude, the present economic evaluation suggests that, under a willingness-to-pay threshold of €34000 per QALY gained, liraglutide was estimated to be a highly cost-effective option for the treatment of T2DM in a Greek setting.
Compliance with ethics
This study is an economic evaluation analysis and does not involve human subjects. Input data including human ma-terial or human data derived from other published studies performed with the approval of an appropriate ethics com-mittee. Therefore, no ethics approval arises for the per-formance of this cost-effectiveness analysis.
Competing interests
This study was funded by Novo Nordisk, the manufacturer of liraglutide. However, the study sponsor had no interference in the study design, data collection or writing of the manuscript. None of the authors has any personal or financial conflict of interest.
Authors’contributions
CT and GK collected the data, interpreted the results and wrote the manuscript. NM supervised the study, contributed to results interpretation, and he is the guarantor for the overall content. AM and CV were the local clinical experts contributed to data validation and results interpretation. All authors reviewed the manuscript. All authors read and approved the final manuscript.
Acknowledgments
Author details
1
Department of Health Services Organisation and Management, National School of Public Health, 196 Alexandras Avenue, 11521 Athens, Greece. 2
Diabetes Center, Tzanio General Hospital, Piraeus, Greece.3Collaborative Center for Clinical Epidemiology and Outcomes Research (CLEO),“Aghia Sophia”Children’s Hospital, Athens, Greece.
Received: 20 June 2014 Accepted: 15 September 2014 Published: 22 September 2014
References
1. Chen L, Magliano DJ, Zimmet PZ:The worldwide epidemiology of type 2 diabetes mellitus–present and future perspectives.Nat Rev Endocrinol 2012,8:228–236.
2. Williams R, Van Gaal L, Lucioni C, Board C-A:Assessing the impact of complications on the costs of Type II diabetes.Diabetologia2002,
45:S13–S17.
3. Panagiotakos DB, Pitsavos C, Chrysohoou C, Stefanadis C:The epidemiology of Type 2 diabetes mellitus in Greek adults: the ATTICA study.Diabet Med2005,22:1581–1588.
4. International Diabetes Federation:IDF Diabetes Atlas.6th edition. Brussels, Belgium: International Diabetes Federation; 2013. Accessed March 30, 2014 [http://www.idf.org/diabetesatlas]
5. Athanasakis K, Ollandezos M, Angeli A, Gregoriou A, Geitona M, Kyriopoulos J:Estimating the direct cost of Type 2 diabetes in Greece: the effects of blood glucose regulation on patient cost.Diabet Med2010,27:679–684. 6. Inzucchi SE, Bergenstal RM, Buse JB, Diamant M, Ferrannini E, Nauck M,
Peters AL, Tsapas A, Wender R, Matthews DR:Management of hyperglycaemia in type 2 diabetes: a patient-centered approach. Position statement of the American Diabetes Association (ADA) and the European Association for the Study of Diabetes (EASD). Diabetologia2012,55:1577–1596.
7. Hellenic Diabetes Association:Management guidelines for a diabetic patient.Accessed September 15, 2013 [http://www.ede.gr/] 8. Bode B:An overview of the pharmacokinetics, efficacy and safety of
liraglutide.Diabetes Res Clin Pract2012,97:27–42.
9. Palmer AJ, Roze S, Valentine WJ, Minshall ME, Foos V, Lurati FM, Lammert M, Spinas GA:Validation of the CORE Diabetes Model against epidemiological and clinical studies.Curr Med Res Opin2004,20(Suppl 1):S27–S40.
10. Palmer AJ, Roze S, Valentine WJ, Minshall ME, Foos V, Lurati FM, Lammert M, Spinas GA:The CORE Diabetes Model: projecting long-term clinical outcomes, costs and cost-effectiveness of interventions in diabetes mellitus (types 1 and 2) to support clinical and reimbursement decision-making.Curr Med Res Opin2004,20(Suppl 1):S5–S26. 11. Pratley RE, Nauck M, Bailey T, Montanya E, Cuddihy R, Filetti S, Thomsen AB,
Sondergaard RE, Davies M, Group L-D-S:Liraglutide versus sitagliptin for patients with type 2 diabetes who did not have adequate glycaemic control with metformin: a 26-week, randomised, parallel-group, open-label trial.Lancet2010,375:1447–1456.
12. Buse JB, Rosenstock J, Sesti G, Schmidt WE, Montanya E, Brett JH, Zychma M, Blonde L, Group L-S:Liraglutide once a day versus exenatide twice a day for type 2 diabetes: a 26-week randomised, parallel-group, multinational, open-label trial (LEAD-6).Lancet2009,374:39–47.
13. Liatis S, Thomakos P, Papaoikonomou S, Papazafeiropoulou A,
Giannakopoulos N, Karagiaouri E, Sotiropoulos A, Bousboulas S, Melidonis A, Pappas S, Katsilambros N:Trends in the management of type 2 diabetes and its prescription drug costs in Greece (1998 & 2006).Exp Clin Endocrinol Diabetes2009,117:505–510.
14. Russell-Jones D, Vaag A, Schmitz O, Sethi BK, Lalic N, Antic S, Zdravkovic M, Ravn GM, Simo R, Liraglutide E, Action in Diabetes 5 met SUSG:Liraglutide vs insulin glargine and placebo in combination with metformin and sulfonylurea therapy in type 2 diabetes mellitus (LEAD-5 met + SU): a randomised controlled trial.Diabetologia2009,52:2046–2055. 15. Greek Ministry of Health:Drug Price Bulletin.Accessed September 15, 2013
[http://www.yyka.gov.gr/]
16. Athanasakis K, Fragoulakis V, Tsiantou V, Masaoutis P, Maniadakis N, Kyriopoulos J:Cost-effectiveness analysis of ranibizumab versus verteporfin photodynamic therapy, pegaptanib sodium, and best supportive care for the treatment of age-related macular degeneration in Greece.Clin Ther2012,34:446–456.
17. Souliotis K, Papavasilopoulou M, Konstantinidou C, SpanakisΑΜ, Apostolakis
Μ, Iatrou C:Insurance coverage for the treatment of patients with chronic renal insufficiency. Adoption of economic assessment by the Institute of Social Insurance (IKA).Arch Hell Med2009,26(5):668–677. 18. Kaitelidou D, Ziroyanis PN, Maniadakis N, Liaropoulos LL:Economic
evaluation of hemodialysis: implications for technology assessment in Greece.Int J Technol Assess Health Care2005,21:40–46.
19. Kourlaba G, Fragoulakis V, Maniadakis N:Economic evaluation of clopidogrel in acute coronary syndrome patients without ST-segment elevation in Greece: a cost-utility analysis.Appl Health Econ Health Policy 2012,10:261–271.
20. Kourlaba G, Fragoulakis V, Maniadakis N:Clopidogrel versus aspirin in patients with atherothrombosis: a CAPRIE-based cost-effectiveness model for Greece.Appl Health Econ Health Policy2012,10:331–342. 21. Sidiropoulos S:Estimating the Cost of Renal Transplantation in Greece.Thesis:
University of Macedonia, Business Administration Department; 2009. 22. Hellenic Statistical Authority (EL. STAT.):Inflation rates.Accessed September
30, 2013 [http://www.statistics.gr/portal/page/portal/ESYE] 23. Davies MJ, Chubb BD, Smith IC, Valentine WJ:Cost-utility analysis of
liraglutide compared with sulphonylurea or sitagliptin, all as add-on to metformin monotherapy in Type 2 diabetes mellitus.Diabet Med2012,
29:313–320.
24. World Health Organisation (WHO):Choosing interventions that are Cost Effective (WHO-CHOICE): cost-effectiveness thresholds.Accessed December 10, 2013 [http://www.who.int/choice/costs/CER_thresholds/en/ index.html]
25. International Monetary Fund (IMF):World Economic Outlook Database.
Accessed December 10, 2013 [http://www.imf.org/external/pubs/ft/weo/ 2012/02/weodata/index.aspx]
26. Maniadakis N, Kaitelidou D, Siskou O, Spinthouri M, Liaropoulos L, Fragoulakis B, Hatzikou M, Alexopoulosi D:Economic evaluation of treatment strategies for patients suffering acute myocardial infarction in Greece.Hellenic J Cardiol2005,46:212–221.
27. National Institute for Health and Clinical Excellence (NICE):Guidance on the Use of long-Acting Insulin Analogues for the treatment of Diabetes-Insulin Glargine (TA53).Accessed September 30, 2013 [http://guidance.nice.org.uk/ TA53/Guidance/pdf/English]
28. Pratley RE, Nauck MA, Bailey T, Montanya E, Filetti S, Garber AJ, Thomsen AB, Furber S, Davies M, Group L-D-S:Efficacy and safety of switching from the DPP-4 inhibitor sitagliptin to the human GLP-1 analog liraglutide after 52 weeks in metformin-treated patients with type 2 diabetes: a randomized, open-label trial.Diabetes Care2012,35:1986–1993.
29. Pratley R, Nauck M, Bailey T, Montanya E, Cuddihy R, Filetti S, Garber A, Thomsen AB, Hartvig H, Davies M, Group L-D-S:One year of liraglutide treatment offers sustained and more effective glycaemic control and weight reduction compared with sitagliptin, both in combination with metformin, in patients with type 2 diabetes: a randomised, parallel-group, open-label trial.Int J Clin Pract2011,65:397–407.
30. Lee WC, Samyshkin Y, Langer J, Palmer JL:Long-term clinical and economic outcomes associated with liraglutide versus sitagliptin therapy when added to metformin in the treatment of type 2 diabetes: a CORE Diabetes Model analysis.J Med Econ2012,15(Suppl 2):28–37.
31. Mezquita Raya P, Perez A, Ramirez de Arellano A, Briones T, Hunt B, Valentine WJ:Incretin therapy for type 2 diabetes in Spain: a cost-effectiveness analysis of liraglutide versus sitagliptin. Diabetes Ther2013,4:417–430.
32. Lee WC, Conner C, Hammer M:Results of a model analysis of the cost-effectiveness of liraglutide versus exenatide added to metformin, glimepiride, or both for the treatment of type 2 diabetes in the United States.Clin Ther2010,32:1756–1767.
33. Valentine WJ, Palmer AJ, Lammert M, Langer J, Brandle M:Evaluating the long-term cost-effectiveness of liraglutide versus exenatide BID in patients with type 2 diabetes who fail to improve with oral antidiabetic agents.Clin Ther2011,33:1698–1712.
34. Gerstein HC, Miller ME, Byington RP, Goff DC Jr, Bigger JT, Buse JB, Cushman WC, Genuth S, Ismail-Beigi F, Grimm RH Jr, Probstfield JL, Simons-Morton DG, Friedewald WT:Effects of intensive glucose lowering in type 2 diabetes.N Engl J Med2008,358:2545–2559.
complications in veterans with type 2 diabetes.N Engl J Med2009,
360:129–139.
36. Patel A, MacMahon S, Chalmers J, Neal B, Billot L, Woodward M, Marre M, Cooper M, Glasziou P, Grobbee D, Hamet P, Harrap S, Heller S, Liu L, Mancia G, Mogensen CE, Pan C, Poulter N, Rodgers A, Williams B, Bompoint S, de Galan BE, Joshi R, Travert F:Intensive blood glucose control and vascular outcomes in patients with type 2 diabetes.N Engl J Med 2008,358:2560–2572.
doi:10.1186/1472-6963-14-419
Cite this article as:Tzanetakoset al.:Cost-effectiveness analysis of liraglutide versus sitagliptin or exenatide in patients with inadequately controlled Type 2 diabetes on oral antidiabetic drugs in Greece. BMC Health Services Research201414:419.
Submit your next manuscript to BioMed Central and take full advantage of:
• Convenient online submission
• Thorough peer review
• No space constraints or color figure charges
• Immediate publication on acceptance
• Inclusion in PubMed, CAS, Scopus and Google Scholar
• Research which is freely available for redistribution