R E S E A R C H
Open Access
Overexpression of FoxM1 is associated with
tumor progression in patients with clear cell renal
cell carcinoma
Yi-Jun Xue
†, Ri-Hai Xiao
†, Da-Zhi Long
†, Xiao-Feng Zou
*, Xiao-Ning Wang, Guo-Xi Zhang, Yuan-Hu Yuan,
Geng-Qing Wu, Jun Yang, Yu-Ting Wu, Hui Xu, Fo-Lin Liu and Min Liu
Abstract
Background:Fork head box M1 (FoxM1) is a proliferation-associated transcription factor essential for cell cycle progression. Numerous studies have documented that FoxM1 has multiple functions in tumorigenesis and its elevated levels are frequently associated with cancer progression. The present study was conducted to investigate the expression of FoxM1 and its prognostic significance in clear cell renal cell carcinoma (ccRCC). Meanwhile, the function of FoxM1 in human ccRCC was further investigated in cell culture models.
Methods:Real-time quantitative PCR, western blot and immunohistochemistry were used to explore FoxM1 expression in ccRCC cell lines and primary ccRCC clinical specimens. FoxM1 expression was knocked down by small interfering RNA (siRNA) in Caki-1 and 786-O cells; proliferation, colony formation, cell cycle, migration, invasion, and angiogenesis were assayed.
Results:FoxM1 expression was up-regulated in the majority of the ccRCC clinical tissue specimens at both mRNA and protein levels. Clinic pathological analysis showed that FoxM1 expression was significantly correlated with primary tumor stage (P<0.001), lymph node metastasis (P= 0.01), distant metastasis (P= 0.01), TNM stage (P< 0.001) and histological grade (P= 0.003). The Kaplan–Meier survival curves revealed that high FoxM1 expression was associated with poor prognosis in ccRCC patients (P< 0.001). FoxM1 expression was an independent prognostic marker of overall ccRCC patient survival in a multivariate analysis (P= 0.008). Experimentally, we found that down-regulation of FoxM1 inhibited cell proliferation and induced cell cycle arrest with reduced expression of cyclin B1, cyclin D1, and Cdk2, and increased expression of p21 and p27. Also, down-regulation of FoxM1 reduced expression and activity of matrix metalloproteinase-2 (MMP-2), MMP-9 and vascular endothelial growth factor (VEGF), resulting in the inhibition of migration, invasion, and angiogenesis.
Conclusions:These results suggest that FoxM1 expression is likely to play important roles in ccRCC development and progression, and that FoxM1 is a prognostic biomarker and a promising therapeutic target for ccRCC.
Keywords:Renal cell carcinoma, FoxM1, Prognosis, Small interfering RNA
* Correspondence:gyfyurology@126.com
†Equal contributors
Department of Urology, First Affiliated Hospital of Gannan Medical University, No. 23, Qing Nian Road, Ganzhou 341000, People’s Republic of China
Background
Renal cell carcinoma (RCC) accounts for approximately 3% of all adult malignancies and represents the most le-thal urological cancer [1]. Approximately 60,920 new cases of RCC were diagnosed in the United States in 2011, with an estimated 13,120 deaths [2]. Worldwide, the incidence of RCC is over 200,000 new cases annu-ally, with over 100,000 deaths per year [3]. Clear cell RCC (ccRCC) is the most common histological subtype, comprising 70–80% of all RCC cases [4]. Nearly 25-30% of patients with RCC have evidence of metastases at ini-tial presentation [5,6]. Although radical nephrectomy is effective to cure early and local RCCs, 30% of patients develop metastatic disease after surgery [7]. Patients with metastatic RCC face a dismal prognosis and have limited therapeutic options. Median survival in a recent cohort was only 1.5 years with fewer than 10% of patients surviving to 5 years [8]. Therefore, it is of para-mount importance to better understand the pathogen-esis of aggressive RCC in order to develop effective strategies for the prevention and treatment of RCC.
Fork head Box M1 (FoxM1) is a member of the Fork head Box family of transcription factors that share a conserved winged helix DNA binding domain [9]. FoxM1 is ubiquitously expressed in all proliferating cells, including many tumor-derived cell lines. In normal tis-sues, FoxM1 is detectable in progenitors with extensive proliferating capacity while its expression is extinguished in differentiated or resting cells [10,11]. FoxM1 is known to be a key cell cycle regulator of both the transition from G1 to S phase and the progression to mitosis by
regulating transcription of cell cycle genes, including cyclin B1, cyclin D1, Cdc25A, Cdc25B, aurora B kinase, surviving, p21Cip1, and p27Kip1 [12-17]. Loss of FoxM1 expression has been reported to generate mitotic spindle defects leading to mitotic catastrophe [16-18].
Recent data from several groups have highlighted that FoxM1 is up-regulated in a wide variety of cancers such as basal cell carcinomas, prostate cancer, glioblastomas, gastric cancer, breast cancer, and lung cancer [19-24]. More importantly, the increased expression of FoxM1 has been correlated with clinically aggressive behavior and patient survival in numerous human cancers [25-30]. Hence, FoxM1 not only promotes tumorigenesis by endowing proliferative capacity and leading to uncon-trolled cell division at the early period of cancer develop-ment but also enhances other tumorigenic behaviors in other stages of cancer development. Indeed, recent evi-dence has implicated FoxM1 in several other cancer-related processes such as angiogenesis, invasion, and metastasis. For instance, FoxM1 was shown to stimu-late invasion and angiogenesis of pancreatic cancer cells through induction of matrix metalloproteinase MMP-2 and MMP-9, as well as vascular endothelial
growth factor (VEGF) [31]. Similar functions of FoxM1 in stimulating expression of MMP-2 and MMP-9 have also been documented in other malignancies, such as glioblastoma [32], breast carcinoma [33], and colorectal carcinoma [34]. Moreover, overexpression of FoxM1 coin-cides with metastasis of prostate cancer [35]. Furthermore, the mechanistic studies by Park et al. suggested that FoxM1 could function as a master activator of metastasis in nude mice, as it induced various steps of metastasis [36]. The study demonstrated that in the absence of Arf, FoxM1 overexpression contributes directly to metastatic behavior by driving the epithelial-mesenchymal transition through Akt, disrupting the rigidity of the cytoskeleton by upregulating the microtubule destabilizing protein Stath-min, and promoting the formation of pre-metastatic niches at distant organs by upregulating the lysyl oxidase collagen cross-linking proteins LOX and LOX2. These results indicate that FoxM1 may play diverse roles in can-cer progression and that it could be a promising thera-peutic target.
However, the expression pattern, clinical relevance, and biological function of FoxM1 in ccRCC have so far not been investigated. In the present study, we examined both mRNA and protein expression patterns in ccRCC tissues. We also investigated the correlations between FoxM1 expression and various clinic pathologic para-meters, and its prognostic value for survival of patients with ccRCC. Then, we employed the small interfering RNA (siRNA) technique to evaluate the effects of knock-down of FoxM1 on proliferation, migration, invasion and angiogenesis of ccRCC cell lines in vitro. Together, our data highlight an important role for FoxM1 in controlling ccRCC progression.
Methods
Patients and surgical specimens
confirmed as ccRCC by the clinic pathologic department of the hospital. All of the cases were staged according to the tumor node metastasis staging system and nuclear grade was evaluated on the basis of the Fuhrman cri-teria. Patients’ data are summarized in Table 1. For the use of these clinical materials for research purposes, prior patient’s consent and approval from the Institute Research Ethics Committee were obtained.
Immunohistochemistry staining
All samples were fixed in 10% formaldehyde solution, embedded in paraffin blocks, cut in 4-μm-thick sections, and mounted on glass slides. Each slide was dewaxed in xylene and rehydrated in grade alcohol, followed by boil-ing in 10 mmol/L of citrate buffer (pH 6.0) for antigen retrieval. After inhibition of endogenous peroxidase ac-tivities for 30 minutes with methanol containing 0.3% H2O2, the sections were blocked with 2% bovine serum
albumin for 30 minutes and incubated overnight at 4°C with primary polyclonal rabbit human FoxM1 anti-body (Santa Cruz Biotechnology Inc, Santa Cruz, CA, USA; 1: 50 dilution). After washing thrice with PBS, the slides were incubated with horseradish peroxidase-conjugated goat anti-rabbit IgG for 30 minutes, followed by reaction with diaminobenzidine and counterstaining
with Mayer0 hematoxylin. Negative control was done by omission of the primary antibody and substituting it with nonspecific rabbit IgG.
Evaluation of immunohistochemical staining
Three pathologists (H.Y., S.P. and X.H.) evaluated the immunostaining in a blinded fashion without any know-ledge of the clinical outcome or other clinicopathological data. If there was a discrepancy in individual evaluations, then all the three pathologists reevaluated the slides to-gether to reach a consensus. Immunohistochemical stain-ing of FoxM1 was evaluated usstain-ing a semi-quantitative scoring system for both staining intensity and the percent-age of positive cells. A score was calculated by multiplying the intensity (negative scored as 0, mild scored as 1, mod-erate scored as 2 and strong scored as 3) by percentage of stained cells (0, < 5%; 1, 5–25%; 2, 26–50%; 3, 51–75%; and 4, 76–100%). Scores of multiplication were graded as follows:−, 0; +, 1–3; ++, 4–8; +++, 9–12. Additionally, for statistical analysis, the−and 1+ cases were pooled into the low-expression group, and the 2+ and 3+ cases were pooled into the high-expression group.
Cell lines
Human RCC cell lines 786-O and Caki-1 were pur-chased from the American Type Culture Collection (Rockville, MD). Another three human RCC cell lines, A498, ACHN and OS-RC-2 were preserved in our insti-tute. Immortalized normal human proximal tubule epi-thelial cell line HK-2 was obtained from the Cell Bank of Type Culture Collection of Chinese Academy of Sciences (Shanghai, China). HK-2 cells were cultured in K-SFM medium (Gibco Life Technologies, Grand Island, NY), and other cells were cultured in RPMI-1640 medium (HyClone Laboratories, Logan, UT) with 10% fetal bovine serum (Gibco Life Technologies, Grand Island, NY), 50U/ml of penicillin and 50 μg/ml of streptomycin. Human umbilical vein endothelial cells (HUVEC) were obtained from ScienCell Research La-boratories (Carlsbad, CA, USA) and cultured in ECM (Carlsbad, CA, USA). All cells were cultured in a sterile incubator maintained at 37°C with 5% CO2.
Gene silencing using siRNA
FoxM1 siRNA (GGACCACUUUCCCUACUUU) and control siRNA (GGACCUGUAUGC GUACAUU) were purchased from Shanghai Genepharma Co. Ltd. (Shanghai, China). Cells were Transfected using Lipofectamine 2000 (Invitrogen, Carlsbad, CA, USA) according to the manu-facturer’s instructions. Following transfection, the mRNA and protein levels were assessed 48 hours later.
Real-time quantitative PCR
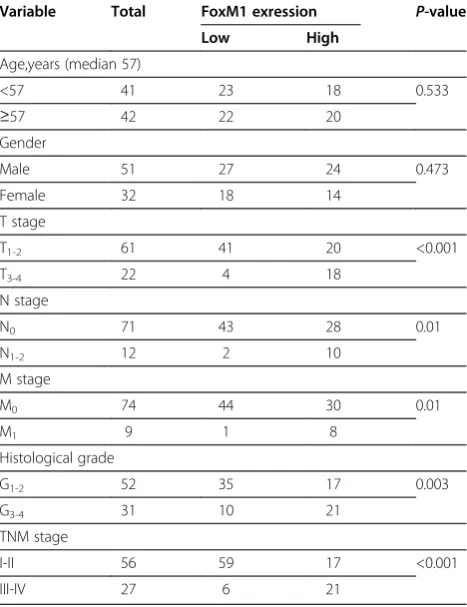
[image:3.595.57.291.430.734.2]Total RNA was isolated from tissues and Transfected cells using TRIzol (Invitrogen) according to the Table 1 FoxM1 protein expression in 83 ccRCC tissues
determined by immunohistochemistry
Variable Total FoxM1 exression P-value
Low High
Age,years (median 57)
<57 41 23 18 0.533
≥57 42 22 20
Gender
Male 51 27 24 0.473
Female 32 18 14
T stage
T1-2 61 41 20 <0.001
T3-4 22 4 18
N stage
N0 71 43 28 0.01
N1-2 12 2 10
M stage
M0 74 44 30 0.01
M1 9 1 8
Histological grade
G1-2 52 35 17 0.003
G3-4 31 10 21
TNM stage
I-II 56 59 17 <0.001
manufacturer’s protocol. First-strand cDNAs were synthesized using the High Capacity cDNA Reverse Transcription Kit (Applied Bios stems, Foster City, CA, USA). Quantitative real-time PCR was performed using SYBR Green PCR Master Mix (Applied Bios stems) in a 7900 Real-Time PCR System (Applied Bios stems). β -actin was used as the reference gene. The following primers were used: for FoxM1, 5'-AACCGCTACTT GACATT GG-3' (forward), 5'-GCAGTGGCTTCATCT TCC-3' (reverse); for CyclinB1, 5'-GGTTGG GTCGG CCTCTACC T-3' (Forward), 5'-AGCCAGGTGCTG CATAACTGGAA-3' (Reverse); for CyclinD1, 5'-TCTACACCGACAACTCCATCCG-3' (Forward), 5'-TCTGGCATTTTGG AGAGGAAGTG-3' (Reverse); for CDK2, 5'-CTCCTGGGCTCGAAATATTATTCCA CAG -3' (Forward), 5'-CCGGAAGAGCTGGTCAATCT CAGA-3' (Reverse); for p27, 5'-CGCT CGCCAGTC CATT-3' (Forward), 5'-ACAAAACCGAACAAAA CAAAG-3' (Reverse); for p21, 5'-TCCAGCGACCTTC CTCATCCAC-3' (Forward), 5'-TCCATAGCCTCTACT GCCA CCATC-3' (Reverse); for MMP2, 5'-CCGTGGT GAGATCTTCTTCT-3' (Forward), 5'-CCTC GTATACC GCATCAATCT-3' (Reverse); for MMP9, 5'-TTCATCTT CCAAGGCCAATC-3' (Forward), 5'-CTTGCTGCTGCT AAAGTTCG-3' (Reverse); for VEGF, 5'-C TCTACC T CCA CCATGCCAAGT-3' (Forward), 5'-TGATTCTGC CCTCCTCCTTCT-3' (Reverse). The PCR cycles were 95°C for 10 minutes, followed by 40 cycles of 95°C for 15 seconds and 60°C for 1 minute. Each reaction was performed in triplicate and analyzed individually. The results were calculated by using 2-ΔΔCtmethod.
Western blot assay
Cells and tissues were lysed in lysis buffer containing protease inhibitor cocktail. Protein concentration was determined using a Bio-Rad protein assay system (Bio-Rad, Hercules, CA, USA). Equivalent amounts of pro-teins were separated by SDS-PAGE, and then transferred to polyvinylidene difluoride membranes (Bio-Rad). After being blocked in Tris buffered saline (TBS) containing 5% non-fatmilk, the membranes were incubated with specific primary antibodies (Santa Cruz Biotechnology, Santa Cruz, CA, USA) at 4°C for 12 hours and then with horseradish peroxidase-conjugated anti-rabbit antibody (Zhongshan, Beijing, China) for 2 hour at room temperature. Signals were detected on X-ray film using the ECL detection system (Pierce, Rockford, IL, USA). The relative protein levels were calculated based on β -actin as the loading control.
MTT assay
Cells were plated in 96-well culture plates at about 5 × 10³cells per well 24 hour after transfection. Then, 20μl of 5 mg/ml MTT solution was added to each well and
incubated for 4 hours at 37°C, the media was removed from each well, and the resultant MTT formazan was solubilized in 150 μl of DMSO. The absorbance values at 490 nm were measured using a microplate reader (Bio-Rad). The experiment was repeated three times and each experiment had six replicate wells.
Colony formation assay
Cells were Transfected with control or FoxM1 siRNA for 48 hours and then plated at 1 × 10³cells/well of a 6-well plate in triplicate. After 14 days of culture, the col-onies were fixed with methanol and stained with crystal violet. The number of colonies per well was counted using a dissecting microscope with a threshold of 50 cells necessary to constitute a colony. At least two inde-pendent experiments were performed.
Cell cycle analysis
Cells were harvested 48 hours after transfection with control or FoxM1 siRNA and fixed in 70% ice-cold etha-nol overnight. The cells were then washed with PBS, and stained with propidium iodide (50 mg/ml) in PBS sup-plemented with RNase (50 mg/ml) in the dark at room temperature for 30 minutes. Tests were performed in triplicate for each sample, and analyses of cell cycle dis-tribution were performed by flow cytometer (FACS Can-toII, BD Bioscience, USA) in accordance with the manufacturer’s guidelines.
Gelatin zymography
After transfection with control siRNA or FoxM1 siRNA for 24 hours, the complete medium was removed, and the cells were cultured in serum-free medium. After 24 hours, the conditioned medium was harvested, and then centrifuged to remove the cellular debris and sepa-rated by 8% acrylamide gels that contained 0.1% gelatin under non-reducing conditions. Gels were washed in 2.5% Triton X-100 and incubated overnight in 2.5% Tri-ton X-100 solution at room temperature, with gentle agi-tation to remove SDS, and then were soaked in reaction buffer (50 mM Tris-HCl, 200 mM NaCl, 10 mM CaCl2)
at 37°C overnight. After reaction, the gels were stained with 0.5% Coomassie Brilliant Blue solution, containing 20% methanol and 10% acetic acid, for 1 hour, distained with 20% methanol and 10% acetic acid, and visualized. The bands represent the results of gelatinase quantity and activity.
Enzyme-linked immunosorbent assay (ELISA) for VEGF
systems, USA) according to the manufacturer' instruction.
Scratch migration assay
Cells were seeded to 12-well plates and Transfected with control or FoxM1 siRNA. At 24 hours after transfection, cells were scratched using the tip of a sterile 200-μl pip-ette (width: ~1 mm) in each well. The plates were washed twice with PBS in order to remove the detached cells, and incubated at 37°C in 5% CO2. Wound closure
was monitored at various time points by observation under a microscope and the degree of cell migration was quantified by the ratio of gap distance at 24 hours to that at 0 hour. The experiment was done in triplicate.
Matrigel invasion assay
Cell invasion assay was performed using a 24-well Tran swell chamber with a pore size of 8 μm (Costar, New York, NY, USA). The inserts were coated with 50 μl Matrigel (dilution at 1: 2; BD Bioscience, Franklin Lakes, NJ, USA). Cells were trypsinised after transfection with control or FoxM1 siRNA for 48 hours and transferred to the upper Matrigel chamber in 100 μl of serum free medium containing 1 × 10⁵ cells and incubated for 24 hours. The lower chamber was filled with medium that contained 10% fetal bovine serum as chemoattrac-tants. After incubation, the noninvaded cells on the upper membrane surface were removed with a cotton tip, and the cells that passed through the filter were fixed and stained using 0.1% crystal violet. The numbers of invaded cells were counted in five randomly selected high power fields under a microscope. This experiment was performed in triplicate.
Matrigel in vitro HUVEC tube formation assay
Cells Transfected with control or FoxM1 siRNA were cultured in serum-free RPMI 1640 for 24 hours. The conditioned medium were collected, centrifuged and stored at -20°C until assay. HUVEC (1 × 10⁵ cells/well) in 500 μl of the indicated conditioned medium were seeded onto a 24-well plate, which was precoated with 100 μl of growth factor-reduced Matrigel (BD Bio-science) for 30 minutes. Following stimulation with the cell conditioned medium for 12 hours, tube formation was observed under an inverted microscope and counted. The number of tube formations was measured by counting the number of tube-like structures formed by connected endothelial cells in five randomly selected fields under a microscope. The assay was performed in triplicate.
Statistical analysis
The statistical analyses were performed using the Statis-tical Package for the Social Sciences, version 16.0 (SPSS
Inc., Chicago, IL, USA). A paired-samples t-test was used to compare FoxM1 mRNA and protein expression in the ccRCC tissues with that of their paired adjacent nontumor tissue samples. The relationship between FoxM1 protein expression and the clinicopathological features was analyzed using χ2 tests. Overall survival curves were calculated with the Kaplan-Meier method and were analyzed with the log-rank test. A Cox propor-tionalhazards analysis was used in univariate and multi-variate analyses to explore the effects of FoxM1 expression and ccRCC clinicopathological variables on survival. Unpaired 2-tailed Student's t-tests were used to analyze comparisons between the 2 groups. AP-value of < 0.05 was regarded as statistically significant.
Results
FoxM1 mRNA and protein expression in primary ccRCC tissue samples and RCC cell lines
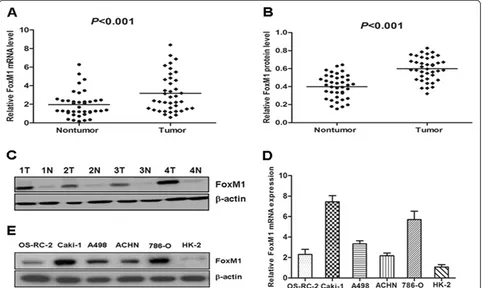
We first examined FoxM1 mRNA expression in 39 paired clinical samples from ccRCC patients (tumor tis-sues and matched adjacent nontumor tistis-sues) by real-time quantitative PCR. The results revealed a statistically significant elevation of FoxM1 mRNA in tumors, as compared to the matched adjacent nontumor tissues (P< 0.001, Figure 1A). To investigate whether FoxM1 was also elevated at the protein level, western blot was performed on those 39 paired ccRCC clinical samples. We found that the protein level of FoxM1 in tumor tis-sues was significantly higher than that in adjacent non-tumor tissues (P< 0.001, Figure 1B), consistent with the results of real-time quantitative PCR. The protein level of FoxM1 in four representative pairs of samples is shown in Figure 1C. We also used real-time quantitative PCR and western blot to detect the expression of FoxM1 mRNA and protein in RCC cell lines as well as in an immortalized normal human proximal tubule epithelial cell line. As shown in Figure 1D, the OS-RC-2, Caki-1, A498, ACHN and 786-O showed higher FoxM1 tran-script levels relative to the HK-2 normal proximal tubule epithelial cell line (Figure 1D). Likewise, FoxM1 protein expression was elevated in those RCC cell lines com-pared to the HK-2 cell line (Figure 1E).
Immunohistochemical analysis of FoxM1 expression in ccRCC clinical samples and its relationship to
clinicopathological parameters
(FoxM1++ or FoxM1+++). The relationship between FoxM1 expression and various clinicopathological para-meters is described in Table 1. FoxM1 staining level sig-nificantly correlated with primary tumor stage (P< 0.001), lymph node metastasis (P= 0.01), distant metas-tasis (P= 0.01), TNM stage (P< 0.001) and histological grade (P= 0.003). There was no significant association between FoxM1 expression and patients’gender and age.
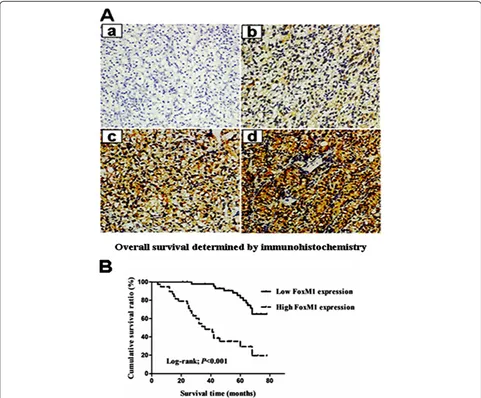
FoxM1 expression and patient survival
The prognostic value of FoxM1 for overall survival in ccRCC patients was evaluated by comparing the patients with high and low FoxM1 expression. According to the Kaplan–Meier survival analysis, ccRCC patients with high FoxM1 expression had obviously lower overall sur-vival rates than did those with low FoxM1 expression (Figure 2B, Log-rank value =27.484, P< 0.001). Univari-ate and multivariUnivari-ate analyses were conducted using Cox proportional hazards model to examine the impact of FoxM1 expression and other clinicopathological para-meters in ccRCC patients. FoxM1 expression (P< 0.001), primary tumor stage (P< 0.001), lymph nodes metastasis
(P= 0.007), distant metastasis (P< 0.001) and histological grade (P= 0.01) were significant prognostic factors in the univariate analysis (Table 2). Multivariate Cox re-gression analyses showed that advanced primary tumor stage (P= 0.001), distant metastasis (P= 0.025) and high FoxM1 expression (P= 0.008) were independent prog-nostic factors (Table 2). Thus, FoxM1 expression may be useful for predicting the overall survival of ccRCC patients.
Effects of FoxM1 depletion on cell growth
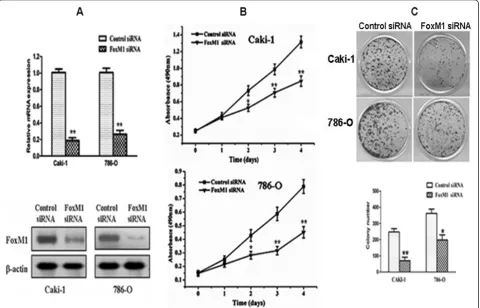
[image:6.595.58.540.90.378.2]In order to determine whether FoxM1 could be an ef-fective therapeutic target for ccRCC, we employed an RNA interference approach to knock down its expres-sion in Caki-1 and 786-O cells expressing high levels of endogenous FoxM1. The efficacy of FoxM1 siRNA for knockdown of FoxM1 mRNA and protein was con-firmed by real-time PCR and western blot analysis, re-spectively. We observed that FoxM1 mRNA levels were significantly reduced in cells Transfected with specific siRNA for FoxM1 compared with those Transfected with control siRNA (P< 0.01; Figure 3A). Also, the expression Figure 1The expression of FoxM1 mRNA and protein in the human ccRCC surgical specimens and RCC cell lines, as evaluated by real-time quantitative PCR and western blot. A, The relative mRNA expression of FoxM1 was higher in 39 ccRCC tumor tissues than in matched adjacent nontumorous tissues (P < 0.001).B,The FoxM1 protein expression was higher in the tumor tissues than in matched adjacent
of FoxM1 protein was significantly decreased compared with the control siRNA-Transfected cells. Thus, the FoxM1 siRNA could effectively knock down FoxM1 ex-pression at both transcriptional and translational levels. We next studied the impact of FoxM1 silencing on cell proliferation. The results of the MTT assay showed that down-regulation of FoxM1 significantly reduced the proliferation rate in both the cell lines tested compared with the control siRNA-Transfected cells (P< 0.01; Figure 3B). Colony formation assay further showed that down-regulation of FoxM1 in two tested cell lines with transfection of FoxM1 siRNA resulted in a clear reduction of the colony formation capacity compared with the control siRNA-Transfected cells (P< 0.05; Figure 3C). These results from colony formation assay are consistent with the MTT data, suggesting that
FoxM1 expression influences the growth and prolifera-tion of ccRCC cells.
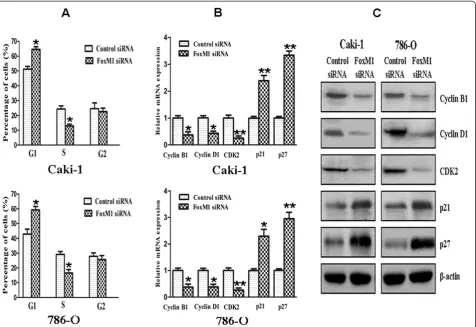
Effect of FoxM1 deletion on cell cycle
Cell cycle analysis revealed that FoxM1 silencing in Caki-1 and 786-O cells caused a accumulation of cells in the G0-G1 phase and a decrease in the S phase
[image:7.595.57.538.89.487.2]Table 2 Prognostic factors in Cox proportional hazards model
Variable Univariate analysis Multivariate analysis
Risk ratio 95% CI P Risk ratio 95% CI P
Age 0.958 0.506-1.811 0.894
≥57 vs <57
Gender 0.978 0.468-2.042 0.953
male vs female
Histological grade 2.317 1.224-4.388 0.01 G3-4vs G1-2
Lymph node status 2.787 3.317-5.899 0.007 N1-2vs N0
Primary tumour stage 6.295 3.190-12.421 <0.001 4.336 1.859-10.116 0.001 T3-4vs T1-2
Distant metastasis 8.951 3.828-20.930 <0.001 2.950 1.149-7.573 0.025 M1vs M0
FoxM1 5.505 2.728-11.109 <0.001 3.034 1.337-6.887 0.008
high vs low
Figure 3Effects of FoxM1 depletion on cell growth. A,FoxM1 mRNA levels were down-regulated by FoxM1 siRNA.B,FoxM1 protein levels were down-regulated by siRNA.C,Inhibition of cancer cell proliferation by FoxM1 siRNA tested by MTT assay.D,Inhibition of cancer cell colony formation capacity by FoxM1 siRNA. Experiments were repeated at least three times, and representative data are presented;bars, SD.*,P< 0.05; **,
[image:8.595.59.540.375.683.2]control siRNA (P< 0.05). In contrast, down-regulation of FoxM1 was found to result in an increase in the expres-sion of cyclin-dependent kinase inhibitors such as p21 and p27. Taken together, these results indicated that down-regulation of FoxM1 expression suppressed cell cycle progression in ccRCC cells.
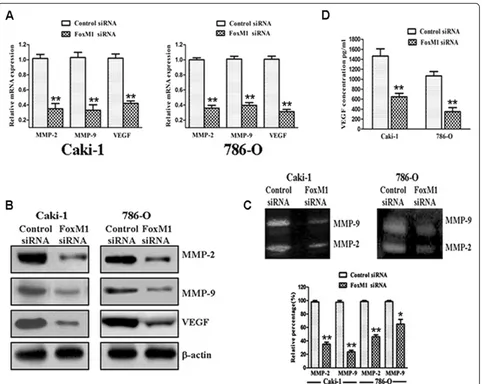
Effect of FoxM1 deletion on MMP-2, MMP-9 and VEGF
As shown in Figure 5A, real-time quantitative PCR ana-lysis demonstrated that FoxM1 knockdown significantly decreased MMP-2, MMP-9 and VEGF mRNA expres-sion compared with control siRNA-Transfected cells (P< 0.01). Similar results were observed by western blot analysis as well (Figure 5B). Next, we examined whether the down-regulation of FoxM1 could also lead to a de-crease in MMP-2, MMP-9 and VEGF activity. As shown in Figure 5C, both MMP-2 (Caki-1and 786-O, P< 0.01) and MMP-9 (P< 0.01 for Caki-1 and P< 0.05 for 786-O) activities were decreased in the FoxM1 siRNA-Transfected cells, as determined by gelatin zymography when compared with control siRNA-Transfected cells. We also found that VEGF activity was significantly
reduced by the down-regulation of FoxM1, as measured by ELISA when compared with control siRNA-Transfected cells (Figure 5D; P< 0.01). These results clearly suggest that tumor progression could be attenuated by the down-regulation of FoxM1.
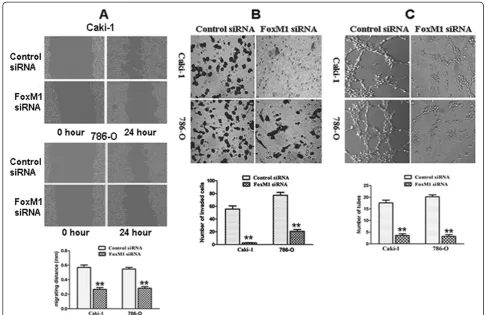
Effect of FoxM1 deletion on migration and invasion
[image:9.595.62.539.89.416.2]Because FoxM1 silencing inhibited the expression and activity of MMP-2, MMP-9 and VEGF that are thought to be critically involved in the processes of tumor cell migration, invasion and metastasis, we tested the effect of FoxM1 deletion on cancer cell migration and inva-sion. In the scratch migration assay, down-regulation of FoxM1 significantly suppressed the migration of both Caki-1 and 786-O cells (Figure 6A). The migrating dis-tance of Caki-1 cells was 0.571 ± 0.055 mm in the con-trol siRNA group and 0.267 ± 0.041 mm in the FoxM1 siRNA group (P< 0.01). In the 786-O cells, the migrating distance was 0.547 ± 0.040 mm in the control siRNA group and 0.283 ± 0.035 mm in the FoxM1 siRNA group (P< 0.01). Matrigel invasion assay showed that down-regulation of FoxM1 significantly suppressed the Figure 4Effect of FoxM1 deletion on cell cycle. A,The cell cycle distribution was analyzed using propidium iodide staining and flow
invasiveness of both cancer cells (Figure 6B). The aver-age cell counts crossing matrigel-coated membrane in one high power field was 55.7. ± 8.7 for the control siRNA group and 2.3 ± 0.6 for the FoxM1 siRNA group of Caki-1 cells (P< 0.01); 77.3 ± 8.1 for the control siRNA group and 20.6 ± 4.5 for the FoxM1 siRNA group of 786-O cells (P< 0.01).
Effect of FoxM1 deletion on angiogenesis
Because FoxM1 siRNA inhibited VEGF expression and activity, we tested whether FoxM1 siRNA-Transfected cells could reduce the tube formation of HUVECs cul-tured with conditioned medium (CM), an indirect meas-ure of angiogenesis. As illustrated in Figmeas-ure 6C, the CM obtained from the FoxM1 siRNA-Transfected cells showed significantly decreased tube formation per
microscopic field as compared to control siRNA-Transfected cells (Caki-1 control vs FoxM1 siRNA: 17.6 ± 2.7 vs 3.6 ± 1.5, P< 0.01; 786-O control vs FoxM1 siRNA: 20.2 ± 1.9 vs 3.2 ± 1.6, P< 0.01).
Discussion
[image:10.595.59.541.87.471.2]tissues. Immunohistochemical analysis also confirmed that tumor tissues exhibited abundant FoxM1 expres-sion, in contrast to adjacent nontumor tissues which dis-played absence or lower FoxM1 expression. To investigate whether FoxM1 expression might be asso-ciated with the progression of ccRCC, the FoxM1 ex-pression levels and the clinic pathologic characteristics of 83 patients with ccRCC were compared by immuno-histochemistry. We found that high FoxM1 expression is significantly correlated with primary tumor stage, lymph node metastasis, distant metastasis, TNM stage, and histological grade, suggesting that its expression might be important for the acquirement of malignant potential in ccRCCs. Furthermore, elevated FoxM1 expression was identified as an independent worse prognostic factor in ccRCC patients. These findings are in agreement with studies in other human cancers overexpressing FoxM1 [25-30].
We have clearly shown that FoxM1 is highly expressed in ccRCC cells from patient samples. This prompted us to examine the biological function of FoxM1 in greater
detail through in vitro analysis of ccRCC cell lines. Therefore, we first checked its expression level in several cell lines and picked up Caki-1 and 786-O with relatively high FoxM1 level for further study. We employed siRNA to knockdown FoxM1 expression in these two cell lines. We found an impaired proliferation capacity and colony formation ability of both Caki-1 and 786-O cells after FoxM1 knockdown. We also found that down-regulation of FoxM1 could inhibit cell migration, invasion, and angiogenesis. Thus, our study suggested that FoxM1 is a potential therapeutic target for the treatment of ccRCC.
Abnormal cell proliferation and growth are character-istics of cancer, including ccRCC. Most of the prolifera-tive factors influence cell growth by affecting cell cycle progression. The importance of FoxM1 with respect to the cell cycle is well recognized. In the present study, cell cycle analyses revealed that FoxM1 knockdown cells showed higher levels of G1phase and lower S phase than
the control cells. So FoxM1 knockdown inhibited G1to
[image:11.595.54.541.88.403.2]proliferation. Furthermore, we found that down-regulation of FoxM1 caused a marked reduction in cyc-lin B1, cyccyc-lin D1, and Cdk2 expression, which play im-portant roles in cell cycle progression. We also observed an increased expression of cyclin-dependent kinase inhibitors such as p21 and p27 in FoxM1 siRNA-Transfected cells, which are known to negatively regulate cell cycle progression. These results suggest that FoxM1 influences the cell cycle progression by positively regulating the factors that favor cell cycle progression and also by negatively influencing the inhibitors of cell cycle in ccRCC cells.
Metastasis is an important aspect of ccRCC. It is known that MMPs are involved crucially in the pro-cesses of tumor cell invasion and metastasis [37,38]. Among these MMPs, MMP-2 and MMP-9 are directly linked with angiogenesis and degradation of the base-ment membrane collagen, and their expression and ac-tivity are correlated with metastatic abilities and prognosis of cancer [39,40]. FoxM1 has been shown to be associated with MMP-2 and MMP-9 in multiple tumor types [31-34]. Here, we showed that down-regulation of FoxM1 by siRNA in Caki-1 and 786-O cells led to reduced expression of MMP-2 and MMP-9. We also found that down-regulation of FoxM1 decreased MMP-2 and MMP-9 activity in the culture medium based on gelatin zymography assay. These results suggest that the suppression of FoxM1 expres-sion has potential for antimetastatic therapy, at least in part, by inhibiting expression/activity of MMPs.
VEGF is another important factor in tumor cell inva-sion, angiogenesis, and metastasis. It is well documented that VEGF is a key mediator of angiogenesis and regu-lates most of the steps in the angiogenic signal cascade [41]. Several recent reports have documented a positive correlation between expression of FoxM1 and VEGF [31,33,34]. In the present study, we found a significant reduction in VEGF expression and activity by down-regulation of FoxM1 using siRNA transfection. These data suggest that the suppression of FoxM1 expression has potential for antimetastatic therapy, at least in part, by inhibiting expression/activity of VEGF.
In order to fully understand the consequences of such down-regulation in the expression and the activity of MMP-2, MMP-9 and VEGF, we performed scratch mi-gration assay and matrigel invasion assay of ccRCC cells and tube formation assay of HUVECs. We found that down-regulation of FoxM1 led to a significant reduction in the migration and invasive potential of Caki-1 and 786-O cells and the tube formation of HUVECs. These results are consistent with the inactivation of MMP-2, MMP-9, and VEGF by the down-regulation of FoxM1, which inhibits cancer cell migration, invasion and angio-genesis. We recognize some limitations in the article.
First, the precise molecular mechanisms of metastasis promotion by FoxM1 in ccRCC need to be further eluci-dated. Second, the in vivo metastasis assay should be performed to further testify the roles of FoxM1 in me-tastasis of human ccRCC.
Conclusions
In summary, the present study firstly showed that FoxM1 expression was up-regulated in the majority of the ccRCC clinical tissue specimens at both mRNA and protein levels. Higher expression of FoxM1 positively correlates with the aggressive phenotype of ccRCCs, and predicts poor survival outcome of patients. We have also presented experimental evidence that down-regulation of FoxM1 in ccRCC cell lines using siRNA inhibited cell proliferation and induced cell cycle arrest with reduced expression of cyclin B1, cyclin D1, and Cdk2, and increased expression of p21 and p27. Furthermore, down-regulation of FoxM1 reduced expression and ac-tivity of MMP-2, MMP-9, and VEGF, resulting in the in-hibition of migration, invasion, and angiogenesis. Based on these findings, we conclude that FoxM1 is function-ally important in the development and progression of ccRCC and may serve as a new target for ccRCC therapy.
Abbreviations
ccRCC: Clear cell renal cell carcinoma; FoxM1: Fork head box M1; MMP-2: Matrix metalloproteinase-2; MMP-9: Matrix metalloproteinase-9; VEGF: Vascular endothelial growth factor; ELISA: Enzyme-linked immunosorbent assay.
Competing interests
The authors declare that they have no competing interests.
Authors’contributions
YJX and XFZ are responsible for the study design. YJX, RHX, and XYW performed the experiments and draft the manuscript. GXZ, YHY and GQW collected the data. DZL, JY, YTW, HX, FLL, and ML participated in the data analysis and interpretation. All authors read and approved the final manuscript.
Received: 5 July 2012 Accepted: 19 September 2012 Published: 24 September 2012
References
1. Rini BI, Rathmell WK, Godley P:Renal cell carcinoma.Curr Opin Oncol2008,
20:300–306.
2. Siegel R, Ward E, Brawley O, Jemal A:Cancer statistics, 2011: the impact of eliminating socioeconomic and racial disparities on premature cancer deaths.CA Cancer J Clin2011,61:212–236.
3. Gupta K, Miller JD, Li JZ, Russell MW, Charbonneau C:Epidemiologic and socioeconomic burden of metastatic renal cell carcinoma (mRCC): a literature review.Cancer Treat Rev2008,34:193–205.
4. Rini BI, Campbell SC, Escudier B:Renal cell carcinoma.Lancet2009,
373:1119–1132.
5. Cindolo L, Patard JJ, Chiodini P, Schips L, Ficarra V, Tostain J, de La Taille A, Altieri V, Lobel B, Zigeuner RE, Artibani W, Guillé F, Abbou CC, Salzano L, Gallo C:Comparison of predictive accuracy of four prognostic models for nonmetastatic renal cell carcinoma after nephrectomy: A multicenter European study.Cancer2005,104:1362–1371.
Chautard D, Valeri A, Lechevallier E, Descotes JL, Lang H, Mejean A, Patard JJ:Multi-institutional validation of a new renal cancer-specific survival nomogram.J Clin Oncol2007,25:1316–1322.
7. Jiang Z, Chu PG, Woda BA, Liu Q, Balaji KC, Rock KL, Wu CL:Combination of quantitative IMP3 and tumor stage: a new system to predict metastasis for patients with localized renal cell carcinomas.Clin Cancer Res2008,14:5579–5584.
8. Patil S, Ishill N, Deluca J, Motzer RJ:Stage migration and increasing proportion of favorable-prognosis metastatic renal cell carcinoma patients: implications for clinical trial design and interpretation.Cancer
2010,116:347–354.
9. Myatt SS, Lam EW:The emerging roles of forkhead box (Fox) proteins in cancer.Nat Rev Cancer2007,7:847–859.
10. Costa RH, Kalinichenko VV, Holterman AX, Wang X:Transcription factors in liver development, differentiation, and regeneration.Hepatology2003,
38:1331–1347.
11. Ye H, Kelly TF, Samadani U, Lim L, Rubio S, Overdier DG, Roebuck KA, Costa RH:Hepatocyte nuclear factor 3/fork head homolog 11 is expressed in proliferating epithelial and mesenchymal cells of embryonic and adult tissues.Mol Cell Biol1997,17:1626–1641.
12. Wang X, Kiyokawa H, Dennewitz MB, Costa RH:The forkhead box m1b transcription factor is essential for hepatocyte DNA replication and mitosis during mouse liver regeneration.Proc Natl Acad Sci USA2002,
99:16881–16886.
13. Wang X, Quail E, Hung NJ, Tan Y, Ye H, Costa RH:Increased levels of forkhead box M1B transcription factor in transgenic mouse hepatocytes prevents age-related proliferation defects in regenerating liver.Proc Natl Acad Sci USA2001,98:11468–11473.
14. Krupczak-Hollis K, Wang X, Kalinichenko VV, Gusarova GA, Wang IC, Dennewitz MB, Yoder HM, Kiyokawa H, Kaestner KH, Costa RH:The mouse Forkhead Box m1 transcription factor is essential for hepatoblast mitosis and development of intrahepatic bile ducts and vessels during liver morphogenesis.Dev Biol2004,276:74–88.
15. Laoukili J, Kooistra MR, Brás A, Kauw J, Kerkhoven RM, Morrison A, Clevers H, Medema RH:FoxM1 is required for execution of the mitotic programme and chromosome stability.Nat Cell Biol2005,7:126–136.
16. Wang IC, Chen YJ, Hughes D, Petrovic V, Major ML, Park HJ, Tan Y, Ackerson T, Costa RH:Forkhead box M1 regulates the transcriptional network of genes essential for mitotic progression and genes encoding the SCF (Skp2-Cks1) ubiquitin ligase.Mol Cell Biol2005,25:10875–10894. 17. Kalinichenko VV, Major ML, Wang X, Petrovic V, Kuechle J, Yoder HM,
Dennewitz MB, Shin B, Datta A, Raychaudhuri P, Costa RH:Foxm1b transcription factor is essential for development of hepatocellular carcinomas and is negatively regulated by the p19ARF tumor suppressor.Genes Dev2004,18:830–850.
18. Wonsey DR, Follettie MT:Loss of the forkhead transcription factor FoxM1 causes centrosome amplification and mitotic catastrophe.Cancer Res
2005,65:5181–5189.
19. Teh MT, Wong ST, Neill GW, Ghali LR, Philpott MP, Quinn AG:FOXM1 is a downstream target of Gli1 in basal cell carcinomas.Cancer Res2002,
62:4773–4780.
20. Kalin TV, Wang IC, Ackerson TJ, Major ML, Detrisac CJ, Kalinichenko VV, Lyubimov A, Costa RH:Increased levels of the FoxM1 transcription factor accelerate development and progression of prostate carcinomas in both TRAMP and LADY transgenic mice.Cancer Res2006,66:1712–1720. 21. Liu M, Dai B, Kang SH, Ban K, Huang FJ, Lang FF, Aldape KD, Xie TX, Pelloski
CE, Xie K, Sawaya R, Huang S:FoxM1B is overexpressed in human glioblastomas and critically regulates the tumorigenicity of glioma cells.
Cancer Res2006,66:3593–3602.
22. Li Q, Zhang N, Jia Z, Le X, Dai B, Wei D, Huang S, Tan D, Xie K:Critical role and regulation of transcription factor FoxM1 in human gastric cancer angiogenesis and progression.Cancer Res2009,69:3501–3509. 23. Madureira PA, Varshochi R, Constantinidou D, Francis RE, Coombes RC, Yao
KM, Lam EW:The Forkhead box M1 protein regulates the transcription of the estrogen receptor alpha in breast cancer cells.J Biol Chem2006,
281:25167–25176.
24. Kim IM, Ackerson T, Ramakrishna S, Tretiakova M, Wang IC, Kalin TV, Major ML, Gusarova GA, Yoder HM, Costa RH, Kalinichenko VV:The Forkhead Box m1 transcription factor stimulates the proliferation of tumor cells during development of lung cancer.Cancer Res2006,66:2153–2161.
25. Chan DW, Yu SY, Chiu PM, Yao KM, Liu VW, Cheung AN, Ngan HY: Over-expression of FOXM1 transcription factor is associated with cervical cancer progression and pathogenesis.J Pathol2008,215:245–252. 26. Yang DK, Son CH, Lee SK, Choi PJ, Lee KE, Roh MS:Forkhead box M1
expression in pulmonary squamous cell carcinoma: correlation with clinicopathologic features and its prognostic significance.Hum Pathol
2009,40:464–470.
27. Jiang LZ, Wang P, Deng B, Huang C, Tang WX, Lu HY, Chen HY:
Overexpression of Forkhead Box M1 transcription factor and nuclear factor-κB in laryngeal squamous cell carcinoma: a potential indicator for poor prognosis.Hum Pathol2011,42:1185–1193.
28. Sun HC, Li M, Lu JL, Yan DW, Zhou CZ, Fan JW, Qin XB, Tang HM, Peng ZH:
Overexpression of Forkhead box M1 protein associates with aggressive tumor features and poor prognosis of hepatocellular carcinoma.Oncol Rep2011,25:1533–1539.
29. Priller M, Pöschl J, Abrão L, von Bueren AO, Cho YJ, Rutkowski S, Kretzschmar HA, Schüller U:Expression of FoxM1 is required for the proliferation of medulloblastoma cells and indicates worse survival of patients.Clin Cancer Res2011,17:6791–6801.
30. Xia JT, Wang H, Liang LJ, Peng BG, Wu ZF, Chen LZ, Xue L, Li Z, Li W:
Overexpression of FOXM1 is associated with poor prognosis and clinicopathologic stage of pancreatic ductal adenocarcinoma.Pancreas
2012,41:629–635.
31. Wang Z, Banerjee S, Kong D, Li Y, Sarkar FH:Down-regulation of Forkhead Box M1 transcription factor leads to the inhibition of invasion and angiogenesis of pancreatic cancer cells.Cancer Res2007,67:8293–8300. 32. Dai B, Kang SH, Gong W, Liu M, Aldape KD, Sawaya R, Huang S:Aberrant FoxM1B expression increases matrix metalloproteinase-2 transcription and enhances the invasion of glioma cells.Oncogene2007,26:6212–6219. 33. Ahmad A, Wang Z, Kong D, Ali S, Li Y, Banerjee S, Ali R, Sarkar FH:FoxM1
down-regulation leads to inhibition of proliferation, migration and invasion of breast cancer cells through the modulation of extra-cellular matrix degrading factors.Breast Cancer Res Treat2010,122:337–346. 34. Uddin S, Ahmed M, Hussain A, Abubaker J, Al-Sanea N, AbdulJabbar A,
Ashari LH, Alhomoud S, Al-Dayel F, Jehan Z, Bavi P, Siraj AK, Al-Kuraya KS:
Genome-wide expression analysis of Middle Eastern colorectal cancer reveals FOXM1 as a novel target for cancer therapy.Am J Pathol2011,
178:537–547.
35. Chandran UR, Ma C, Dhir R, Bisceglia M, Lyons-Weiler M, Liang W, Michalopoulos G, Becich M, Monzon FA:Gene expression profiles of prostate cancer reveal involvement of multiple molecular pathways in the metastatic process.BMC Cancer2007,7:64–85.
36. Park HJ, Gusarova G, Wang Z, Carr JR, Li J, Kim KH, Qiu J, Park YD, Williamson PR, Hay N, Tyner AL, Lau LF, Costa RH, Raychaudhuri P:
Deregulation of FoxM1b leads to tumour metastasis.EMBO Mol Med
2011,1:21–34.
37. Curran S, Murray GI:Matrix metalloproteinases: molecular aspects of their roles in tumour invasion and metastasis.Eur J Cancer2000,36:1621–1630. 38. Dong Z, Bonfil RD, Chinni S, Deng X, Trindade Filho JC, Bernardo M,
Vaishampayan U, Che M, Sloane BF, Sheng S, Fridman R, Cher ML:Matrix metalloproteinase activity and osteoclasts in experimental prostate cancer bone metastasis tissue.Am J Pathol2005,166:1173–1186. 39. Rink M, Chun FK, Robinson B, Sun M, Karakiewicz PI, Bensalah K, Fisch M,
Scherr DS, Lee RK, Margulis V, Shariat SF:Tissue-based molecular markers for renal cell carcinoma.Minerva Urol Nefrol2011,63:293–308. 40. Chang HR, Chen PN, Yang SF, Sun YS, Wu SW, Hung TW, Lian JD, Chu SC,
Hsieh YS:Silibinin inhibits the invasion and migration of renal carcinoma 786-O cells in vitro, inhibits the growth of xenografts in vivo and enhances chemosensitivity to 5-fluorouracil and paclitaxel.Mol Carcinog
2011,50:811–823.
41. Hicklin DJ, Ellis LM:Role of the vascular endothelial growth factor pathway in tumor growth and angiogenesis.J Clin Oncol2005,
23:1011–1127.
doi:10.1186/1479-5876-10-200
Cite this article as:Xueet al.:Overexpression of FoxM1 is associated with tumor progression in patients with clear cell renal cell carcinoma.