R E S E A R C H
Open Access
Development and evaluation of a real-time PCR
assay for the quantitative detection of
Theileria annulata
in cattle
Amaia Ros-García
1, Antoni Nicolás
2, Ana L García-Pérez
1, Ramón A Juste
1and Ana Hurtado
1*Abstract
Background:The tick-borne apicomplexan bovine parasiteTheileria annulata is endemic in many tropical and temperate areas, including Minorca (Balearic Islands, Spain). Real-time PCR is widely used for the detection of piroplasms but quantification is not commonly considered.
Results:We developed a real-time quantitative PCR (qPCR) assay for the detection and quantification ofT. annulata that included an internal amplification control (IAC) to monitor for the presence of potential inhibitors. Specificity, sensitivity, precision, linear range and PCR efficiency were calculated and different methods for transformation of quantification cycle (Cq) values into quantities (Q) were evaluated. The assay was able to detect (100% probability) and quantify (linear response) 100 gene copies, and clinical sensitivity was set at 10T. annulataperμl of blood. The assay was then validated on 141 bovine blood samples analyzed in parallel by a LuminexWsuspension array, showing the utility of the qPCR assay developed here for the detection and quantification of the parasite in field conditions. Once validated it was used to monitorT. annulataparasitaemia throughout a year in 8 carrier animals from a farm in Minorca.
Conclusions:The developed qPCR assay offers a reliable and simple way to quantifyT. annulatainfection loads, which could prove crucial in studying the role of carrier animals as a source of the infection, or assessing the efficacy of treatment and control measures.
Keywords:Theileria annulata, Mediterranean theileriosis, Quantitative real-time PCR, Spain, parasitaemia, Ticks
Background
Tropical theileriosis, also called Mediterranean theilerio-sis in the Mediterranean basin, is caused by infection with the protozoan parasiteTheileria annulata.This dis-ease is one of the most serious types of bovine theilerio-sis in Southern Europe, North Africa and Asia [1,2]. Main clinical signs associated with the infection include fever, swelling of superficial lymph nodes, inappetence, tachycardia, dyspnoea and weakness, and anaemia, leukopenia and lymphocytopenia are the most common haematological alterations in acute T. annulata infec-tion. Decreased milk production may be observed in chronic infections in dairy cattle.
The parasite is transmitted by several species of ticks
of the genus Hyalomma. In Spain, T. annulata is
restricted to Central, Southern and Eastern parts of the country where the tick vectors Hyalomma lusitanicum
and Hyalomma marginatum are present [3,4]. In Minorca, a small Mediterranean island in the Balearic Islands (Spain), Mediterranean theileriosis is endemic; prevalence ofT. annulatain cattle is high [5,6] and Hya-lomma ticks are abundant [7]. Animals with persistent infections by Theileria spp. become asymptomatic car-riers, and when enzootic stability is broken due to physiological or management changes, deaths can hap-pen. Buparvaquone, currently the most effective anti-theilerial drug for cattle, is not available in the European Union, and tick-control measures are the only tools used to combat the infection in Minorca. The main livestock species in the island is cattle, with sheep representing a
* Correspondence:ahurtado@neiker.net
1
Department of Animal Health, NEIKER - Instituto Vasco de Investigación y Desarrollo Agrario, Berreaga 1, Derio, Bizkaia 48160, Spain
Full list of author information is available at the end of the article
very small proportion; wild ungulates are absent and rabbits are the main wildlife species.
PCR has been used for the sensitive and specific detec-tion ofT. annulata [8-10]. More recently, hybridization methods with high multiplexing capacity such as Reverse Line Blot (RLB) and LuminexW suspension arrays have been developed for the simultaneous detection and iden-tification of the severalBabesiaandTheileriaspecies in-cluding T. annulata [11,12]. However, none of them allow reliable quantification of the parasite. Here, we described a real-time PCR assay that can be used for both the detection and the quantification ofT. annulata, we compared its performance on field samples with a LuminexW suspension array and used it to monitor
T. annulata parasitaemia throughout a year in adult carriers from an infected cattle herd in Minorca.
Methods
Design of aT. annulata-specific quantitative real-time polymerase chain reaction (qPCR) assay
The 18S rRNA gene sequences ofT. annulataand other piroplasm species available in GenBank were aligned and a pair of primers (Tann-18SF: 5’-AGACCTTAACCTGC-TAAATAGG-3’; Tann-18SR: 5’-CATCACAGACCTGT-TATTGC-3’), were designed to amplify a 120 bp fragment. A TaqManW LNA™ hydrolysis probe specific forT. annulatawas designed (FAM 5’-AAG[+T]TT[+C]
TA[+C]TG[+T]CCCGTT-3’ BHQ1) and synthesized by
Sigma (Sigma Aldrich, St. Louis, USA). The assay was developed for the co-amplification ofT. annulataand an internal amplification control (IAC) in each reaction. The IAC consisted of a plasmid containing a 68 bp frag-ment of the 16S rRNA gene of the bacterium Yersinia ruckeri (ATCC 29473), which is the causative agent of enteric redmouth disease in salmonid fish species [13] and therefore not found naturally in bovine blood. Pri-mers and probe used forY. ruckeriamplification were as described by Lundet al. [14], with a small modification to the probe that included an additional T at the 5’end
(HEX 5’-TGCGAGTAACGTCAATGTTCAGTGC-3’
Iowa BlackWFQ) as synthesized by IDT (Integrated DNA Technologies, Inc., IA, USA).
For real-time PCR assay optimization, recombinant plasmids containing the cloned PCR products of T. annulataandY. ruckeriwere generated using the appro-priate primers for each target. The PCR products were purified and inserted into a PCRW4-TOPOW vector (TOPO TA CloningWkit for Sequencing, Invitrogen, CA, USA) following manufacturer’s instructions. Cloned PCR products were sequenced using the ABI BigDyeTM Ter-minator Cycle Sequencing Ready Reaction Kit and an ABI3130 genetic analyzer (Applied Biosystems, Foster City, CA, USA). Sequences were subjected to BLAST search in the GenBank database and showed 100%
homology with the target sequences. Plasmids were then linearized and spectrophotometrically quantified with a NanoDrop ND-1000 Spectrophotometer (NanoDrop Technologies Inc., Wilmington, DE). Copy numbers of the cloned 18S rRNA gene were derived from the mo-lecular weights of the cloning vector and insert, and diluted in 10 mM Tris–HCl, pH 8.0 to generate stan-dards ranging from 1 to 106molecules.
Real-time quantitative PCR was performed in Micro-AmpTMFast optical 96-well reaction plates covered with thermo-sealing 4titude Clear Seal adhesives (Surrey, UK) at 180°C during 2 seconds in a 4s2™ Thermal Sealer (4titude Ltd., Surrey, UK). Analyses were performed using an ABI PRISM 7500 Sequence Detection System (Applied Biosystems) in 20 μl volume reactions. Opti-mized conditions consisted of 1x EXPRESS qPCR Super-Mix (Invitrogen), 50 nM ROX Reference Dye, 0.2μM of each primer, 150 nM of T. annulata probe, 200 nM of the IACY. ruckeriprobe, 5μl of extracted DNA and 100 copies of the IAC plasmid (optimal IAC plasmid amount for detection without affecting T. annulata detection limit). PCR cycling conditions were 50°C for 2 min, fol-lowed by 95°C for 10 min and then 40 cycles of 95°C for 15 s and 60°C for 1 min. Samples were analysed in dupli-cate along with the extraction negative controls and, at least three non-template negative controls were included in each plate. A 10-fold dilution series (106- 1 copy) of the plasmid DNA was analyzed in triplicate in each plate run.
Real-time qPCR assay performance evaluation
The analytical specificity of the T. annulata real-time PCR assay was evaluated using plasmid DNAs contain-ing inserts correspondcontain-ing to the 18S rRNA gene of other piroplasms including the closely related speciesTheileria parva,Theileria lestoquardi,Theileria equi,Theileria sp. OT1, Theileria sp. OT3, Babesia ovis, Babesia motasi,
Babesia occultans,Babesia bigemina and Babesia diver-gensconstructed as described elsewhere [15]. Blood from a known negative animal (not exposed to ticks) was also tested.
concentration response, was also determined. Intra-assay and inter-assay reproducibility of the T. annulata Taq-Man qPCR assay were represented as the standard devi-ation (SD) of the Cq values determined for the 10-fold serial dilutions of plasmid PCR standards analyzed.
The clinical sensitivity (or sample limit of detection) of the qPCR assay was determined using blood from an animal with clinical symptoms of Mediterranean theiler-iosis. Haematological examination revealed anaemia with low values in red blood cells (3.58 x 10⁶erythrocytes/μl), low packed cell volume (23%) and leukopenia (2.3 x 10³ leukocytes/μl). Giemsa-stained slides were examined under oil immersion using × 100 objective lens and 51% of the erythrocytes were parasitized by piroplasms. The number of erythrocytes and intracellular forms with morphology compatible withT. annulata present in 20 microscopic fields were counted. Mean parasitaemia was set at 0.78 theilerias/erythrocyte and parasitaemia esti-mated at 2.79 x 10⁹ theilerias/ml. Blood was serially diluted (1/10, from 2.79 x 10⁹to 2.79 x 10⁴parasites/ml and 1/2 thereafter, to 50 parasites/ml) and dilutions were processed as described above.
Real-time qPCR data analyses
Raw data from qPCR were recorded by the detection software SDS (v. 2.0.5, Applied Biosystems). The auto-matic settings for baseline and cycle threshold value were checked and adjustments made if necessary prior to calculation of the quantification cycle (Cq) values.
Three methods were compared for the transformation of Cq values into an estimate of copy number (Q) per reaction tube: i) the “single” approach, using the stand-ard curve included in each run; ii) the “master” ap-proach, using the curve obtained by the linear regression equation calculated using all Cq values (from triplicates) obtained for each standard dilution (27 Cq measure-ments), and; iii) the “mixed approach”which is a hybrid of the ‘master’and ‘single’strategies where the slope is fixed based on a series of repeated instrument runs, but the intercept is allowed to vary from run-to-run [16]. Twenty-five blood samples were analyzed in two differ-ent plates, and Q values obtained with the three calibra-tion curve strategies compared.
To plot a mean standard curve (“master” curve) and calculate the standard linear regression equation using SigmaPlotW(version 10.0), all Cq values obtained for the standard dilutions (9 runs, 27 Cq measurements) were considered. A calibration curve was fitted to these data by plotting the mean Cq values as a function of the known starting concentration of the standard dilutions. The standard linear regression equation thus calculated was then used to transform qPCR raw data from Cq values to an estimate of copy number (Q) per reaction tube (“master”approach). The slope of the master curve
was used in the mixed approach along with the intercept of the single curve included in each run.
Once Cq values were transformed into an estimate of copy number (Q) per reaction tube using either of the above mentioned methods, the level of parasitaemia (P), expressed as number of T. annulata cells per ml of blood, was calculated by multiplying each sample Q value by 50 in order to account for the dilutions and volume transformations during sample processing, and the target gene copy number. The calculations were as follows:
P¼Q x Vð B=VEXÞx Vð EL=VTÞx 1ð =CNÞ
where V is defined as volume inμl and represents the fol-lowing: volume of blood to refer the results to, i.e., 1 ml of blood (VB= 1000 μl), sample volume extracted
(VEX= 200 μl), nucleic acid extraction eluate
(VEL= 100 μl), and nucleic acid template added to the PCR reaction (VT= 5μl); and CN is the gene copy num-ber (2 copies per genome).
Percentage of parasitaemia expressed as the number of parasites per 100 red blood cells (RBC), was calculated as the proportion between the number of T. annulata
cells per ml of blood determined by qPCR and the total RBC count per ml of blood measured for each sample as described below.
Field samples
To assess the diagnostic test performance, the assay was then validated on cattle blood samples collected in two regions of Spain, one where Mediterranean theileriosis is endemic (Minorca, Balearic Islands, 102 samples from 2 farms) and another where the tick vector is not present (Basque Country, northern Spain, 39 samples from 3 farms). Forty-five blood samples from Minorca, which had been collected every 2 months throughout a year from 8 animals aged between 2–10 years, were then used to monitorT. annulataparasitaemia.
Leukocyte (WBC) and erythrocyte (RBC) counting was carried out with an electronic counter (Iber-cell, Barce-lona, Spain). Packed cell volume (PCV) was measured by the standard microhaematocrit method, and haemo-globin concentration was determined by colorimetric methods. Leukocyte differential counting was carried out by thin blood smears stained with Giemsa and analysed under an oil-immersion objective, differentiating at least 100 cells.
DNA extraction
of elution buffer and stored at −20°C until subsequent analysis.
Molecular detection and identification of piroplasms by Luminex xMAP technology
PCR amplicons of the hypervariable V4 region of the 18S rRNA gene were generated as previously described [17] and identified using the Luminex xMAP technology and species-specific probes for bovine piroplasms [12]. The median fluorescent intensity (MFI) of each reaction was measured in a Luminex 200W system (Austin, TX) at 54°C. Positive/negative cut-off values were calculated for each assay and probe as described elsewhere [12].
Statistical analyses
For statistical analyses, parasitaemia values were trans-formed into logarithmic values (log2) of the number of
T. annulata cells per ml of blood. Correlation analyses were performed to search for any associations between haematimetric variables and parasitaemia data. Then, differences on average parasitaemia values regarding age [categorical; heifers (<3 yr), cows (≥3 yr)] and month of sampling, were assessed by means of GLM procedure and comparison of means. SAS statistical package ver-sion 9.1 (SAS Institute Inc., Cary, NC, USA) was used for statistical purposes.Pvalues less than 0.05 were con-sidered significant.
The level of agreement between methods (Luminex and qPCR performed in parallel on the same samples) was tested by the Kappa (K) index test at a 95% confi-dence interval using Win Episcope 2.0.
Ethical considerations
Samples were collected by clinical veterinarians as part of the usual screening scheme on farms and Spanish eth-ical guidelines and animal welfare regulations (RD 1201/ 2005) were strictly respected. All herd owners had given an informed consent prior to the study.
Results
T. annulataqPCR optimization and data analysis
The developed qPCR assay amplified a 120 bp fragment of the 18S rRNA gene of T. annulataand a 68 bp frag-ment of the 16S rRNA gene of the bacteriumY. ruckeri
from recombinant plasmids containing their correspond-ing cloned PCR products. No amplification signals were detected for other Babesia and Theileria species likeT. parva,T. lestoquardi,T. equi,Theileriasp. OT1,Theileria
sp. OT3,B. ovis,B. motasi,B. occultans,B. bigeminaand
B. divergens, or from the negative controls. When Cq values for the IAC were undetermined or above 34 in the absence of amplification signal for theT. annulatatarget DNA, the qPCR was considered inhibited and the reac-tion repeated.
The unknown samples that were analyzed twice in two different plates had Cq values ranging from 19 to 32 and showed good reproducibility, with very small variation in Cq results between runs (coefficient of variation, CV < 3.5%). However, the transformation of Cq values into an estimate of copy number per reaction tube (log2 Q) using the “single” model showed important differences in Q values between runs (CVlog2Q= 2.7-26%). The
“mixed” approach showed similar or even higher
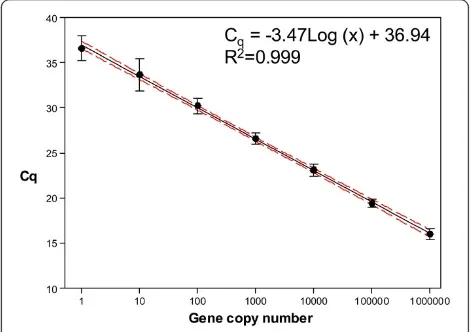
differ-ences (CVlog2Q= 7.3-37.4%). Finally, the“master” model reduced the CVlog2Qto 0.1-7.1% with values below 3% in 17 replicates. Therefore, the master standard linear re-gression equation calculated as described above was used to transform qPCR raw data from Cq values to an estimate of copy number (Q) per reaction tube. The standard curve thus obtained (y =−3.47Log(x) + 36.94; Figure 1) showed good linear response and a linear de-tection over at least seven log units, with a regression coefficient (R2) of 0.999 and an efficiency of 94%. The analytical sensitivity of the assay was 100% at the range of 106 to 100 copies of the target gene in the qPCR assay, but decreased to 88.8% at 10 copies and to 55.5% at 1 copy. Therefore, the analytical LoD, defined as the concentration at which 95% of positive samples are detected, was set at 100 copies. The analytical LoQ was also set at 100 copies corresponding to a mean Cq of 30.22 (95% CI: 30.39-30.05).
[image:4.595.304.539.480.646.2]The clinical sensitivity was determined by analysing ser-ial dilutions (in triplicates) of infected blood from an ani-mal with a known level ofT. annulataparasitaemia. The lowest dilution that produced amplification corresponded
Figure 1Master curve generated by plotting the mean Cq values as a function of the known starting concentration of the standard dilutions.Ten-fold serial dilutions (106- 1 copy) of the
to 220T. annulata/ml of blood (6 x 10⁻⁵% parasitaemia). However, only for dilutions ranging from 2.79 x 10⁸to 870T. annulata/ml were all 3 replicates positive; 2 fur-ther dilutions gave positive signals in 2 replicates (440T. annulata/ml) or 1 replicate (220T. annulata/ml). Thus, clinical LoD was set at 870T. annulata per ml of blood, which corresponded to 2.4 x 10⁻⁴% parasitaemia.
[image:5.595.59.538.191.696.2]Transformation of Cq values obtained from the dilutions into number of parasites per ml of blood showed good correspondence with values determined by microscopy. For example, the dilution that produced an amplification at the established analytical LoQ (Cq ~ 30.22), contained 6975 parasites/ml of blood according to microscopy and 5620T. annulata/ml as estimated by qPCR. These results
Figure 2Graphical representation of individual parasitaemia (log2T. annulata/ml of blood) variations (black dots) throughout the
would demonstrate reliable quantification ofT. annulata
(clinical LoQ) in blood field samples from as little as 104T. annulataper ml of blood (10 parasites perμl). T. annulataqPCR performance compared with Luminex
The performance characteristics of the qPCR assay were assessed by testing in parallel by qPCR and Luminex 141 cattle blood samples. All samples collected in the Basque Country (39) were negative by both techniques. Positive samples were only detected in Minorca. The results of real-time qPCR assay were compared with those of a LuminexW suspension array showing a very good kappa index of agreement (Kappa = 0.97). Only one of the 66 samples positive by Luminex was negative by qPCR, whereas another sample negative by Luminex was posi-tive by qPCR. However, estimated values for 3 samples (one of them corresponding to a Luminex negative sam-ple) were below the LoQ so that quantitative data would be less reliable (Q = 234, 589 and 840T. annulata/ml blood). Most T. annulata positive samples had been identified as mixed infections with either T. buffeli (21) or B. major (28) by Luminex, but this did not affect qPCR sensitivity.
A year-long monitoring ofTheileria annulatainfection
Fluctuations on parasitaemia levels could be monitored throughout a year in 8 carrier animals that remained positive during the study period in one of the farms from Minorca. The haematological parameters (PCV, haemoglobin, and RBC) of these animals remained close and occasionally below the lowest values considered nor-mal for cattle, but no correlation was found between parasite load and haematology values. Estimated parasit-aemia loads ranged between 2.75 x 10³and 8.14 x 10⁶T. annulata/ml blood (corresponding to 5 x 10⁻⁵ to 1.5 x 10⁻¹%T. annulata per 100 RBC), being the observed mean value of 1.1 x 10⁶T. annulata/ml blood. Individual parasitaemia variations throughout the study are shown in Figure 2 along with the corresponding PCV values. At the beginning of the study, in November, differences in parasite loads among the different animals were the lar-gest and the mean parasitaemia the highest (Figure 3). In most of the animals the peak of maximum parasit-aemia was observed either in January or March, the ex-ception being animal #3 which showed a peak at the beginning of the study that then dropped and remained at ca. 105T. annulata/ml blood. In May onwards, T. annulatainfection rate decreased and at the end of the study, in September, parasitaemia had the lowest mean values, and differences were significant (P < 0.05) when compared with mean values observed in January and March. No differences were found between heifers and adult animals when comparing parasitaemia data for each sampling date.
Discussion
[image:6.595.306.539.88.250.2]Several molecular tests based on PCR and hybridisation assays (RLB or LuminexW) are available for the detection and identification of T. annulata[9-12]. However, none of them allow reliable quantification of the parasite, which could prove very useful in following response to antitheilerial treatments, monitoring experimental infec-tions or studying the role of carrier animals as a source of infection. Here, we described a real-time PCR assay that can be used for both the detection and the quantifi-cation of T. annulata, and used it to monitor T. annu-lataparasitaemia in carrier cattle. Real-time quantitative PCR has a great potential for analytical applications in quantitative DNA analysis, but providing quantitative data requires a more complicated data analysis than qualitative PCR. Several methods can be used for trans-formation of qPCR raw data from a Cq to an estimate of concentration from an unknown sample and there is not clear consensus on the best approach. Here, we ran 9 independent standard curves, 5 of them along with the unknown blood samples. In total, 27 replicates of the 7 ten-fold plasmid serial dilutions (106 - 1 copy) were amplified and, results from these dilution series were used to plot a mean standard curve (“master”curve) and to calculate the standard linear regression equation. The inclusion of an independent standard curve accompany-ing each experiment and the repetition of unknown sam-ples in different runs allowed the comparison of different methods for the transformation of Cq values into Q esti-mates. Results showed that the use of the mean standard curve better controlled experiment-to-experiment vari-ability between plasmid replicate measurements asso-ciated to variation in dilution preparation and storage
and provided better reproducibility of sample quantita-tive data estimates. However, the use of a master curve does not preclude the inclusion in each run of positive controls, ideally at both limits of the dynamic range, which should fall within the master curve values for assay validation.
The newly developed qPCR assay showed high specifi-city and sensitivity and, reliable and reproducible quanti-fication over a broad range of template concentrations. The sensitivity and linear detection range were found to be high and broad enough to reliably detect and quantify as little as 100 target gene copies per reaction tube. Methodological variation was determined to be well-controlled within PCR runs and albeit slightly higher among replicate runs, reproducibility was good.
Here, we assumed that there are no differences be-tween respective genomic and plasmid DNA types, which does not always hold true [18]. In an attempt to validate findings from real-time PCR quantification on true bio-logical samples, qPCR results were compared with those obtained from more traditional approaches like micros-copy counts using serial dilutions of blood from an infected animal. Genetic and microscopy methods meas-ure different units (gene copy number vs.infected cells) and therefore, transformations are needed before com-parison is possible. A simple transformation as described here, allowed comparison and showed good correlation of quantitative data generated by real-time PCR quantifi-cation and the number of parasites estimated by micros-copy. The diagnostic test performance of the qPCR assay was also validated by the analysis in parallel of clinical bovine blood samples using a LuminexW suspension array, and concordance between techniques was shown to be very good. However, clinical sensitivity of qPCR (10T. annulata/μl blood) was lower than that of Lumi-nexW, previously reported to be 0.05T. annulata/μl [12]. Nevertheless, the results presented herein demonstrated the suitability of the qPCR assay for reliable quantifica-tion of T. annulata in blood samples from carrier ani-mals with parasitaemias as low as 5 x 10⁻⁵%. LoD was comparable to that determined for other real-time PCR procedures designed to detect different piroplasm species, which have been reported to range between 1.1 x 10⁻⁴% to 1.5 x 10⁻⁵% parasitaemia [19-21].
Following international standards for PCR-based diag-nostic techniques [22], an IAC was added to each real-time PCR reaction and used as an indicator of potential PCR reaction inhibition. Since partial inhibitions can cause an infra-estimation of the actual number of target gene copies, a Cq of 34 was set as the validation limit for IAC amplification. Presence of PCR inhibitors could thus be monitored and associated errors excluded.
Once validated, the qPCR assay was used to monitor
T. annulata infection dynamics throughout a year in 8
naturally infected animals from a herd in a region where
T. annulatais endemic. Parasitaemia levels among these animals (mean 1.1 x 10⁶T. annulata/ml blood) were clearly below those detected in the animal with clinical symptoms of Mediterranean theileriosis used to calculate the clinical sensitivity of the assay (2.79 x 10⁹T. annu-lata/ml blood). Thus, observed values were indicative of subclinical infections and consistent with the status of asymptomatic carriers. A peak was observed in January – March, but could not be associated with any changes in management or production system within the herd. The degree of parasitaemia of carrier animals may affect the level of infection acquired by feeding ticks. An over-lap between high parasitaemia levels and a peak of activ-ity of Hyalomma vector ticks could pose a higher risk for transmission. Presence of Hyalomma ticks feeding on animals from this farm has been recorded (data not shown), but data on tick population seasonality in Minorca are scarce. In the only study on cattle ticks car-ried out in Minorca, Hyalomma ticks were collected from spring to autumn, with the majority ofH. margina-tum adults being recorded in spring-summer and H. lusitanicum being more common in autumn (Castellá
et al.2001).
Although haematological parameters of these animals remained close and occasionally below the lowest values considered normal for cattle, no correlation was found between parasitaemia and haematology values. Major haematological alterations would be expected in young naive animals when first exposed to infected ticks. Un-fortunately, calves were not sampled in this study; the sampled animals (heifers and cows) were positive to T. annulata from the beginning of the study. In fact, the year before this study started, 4 deaths had been recorded in the farm (one 7 month-old calf and 3 cows), but no laboratory analyses were performed at the time to identify the cause. It would be interesting to monitor the initial stages of the infection when calves start get-ting exposed to T. annulata once maternal antibodies wane. This would allow investigating the dynamics ofT. annulata infection from the initial stages of parasit-aemia, its pathogenic effect after massive replication of the parasite inside erythrocytes and leukocytes and its impact in haematological parameters, which could not be clearly observed in this study.
Conclusions
cattle blood samples. This qPCR assay constitutes a valuable addition to the repertoire of parasite detection tools currently available for studies of T. annulata, and the quantitative data that the technique provides should contribute to enhanced understanding of T. annulata
infections.
Competing interests
The authors declare that they have no competing interests.
Authors’contributions
AR carried out the experimental work and participated in drafting of the manuscript. AN collaborated in the design of the field study and carried out sample collection. ALG performed the statistical analysis, interpreted data and critically revised the manuscript. RAJ participated in the critical reading of the publication. AH conceived the study, participated in its design and coordination, and drafted the final manuscript. All authors read and approved the final manuscript.
Acknowlegements
We thank Dr Dirk Geysen (Institute of Tropical Medicine, Belgium) for kindly providingT. parva, and Prof. Dr. Ulrike Seitzer (Research Center Borstel, Germany) forT. lestoquardi. The authors would also like to thank the farmers for their collaboration in sample collection. This work was conducted under financial support from the Spanish Agency for International Development Cooperation (AECID, Project No. A/026818/09), the Spanish National Institute for Agricultural and Food Research and Technology (INIA, Project No. RTA2009-000-18-00-00), and the European Regional Development Fund (ERDF). AR is the recipient of a predoctoral fellowship from INIA.
Author details
1Department of Animal Health, NEIKER - Instituto Vasco de Investigación y Desarrollo Agrario, Berreaga 1, Derio, Bizkaia 48160, Spain.2Menorca Gestió Veterinària, Occs Menorca, SL, S’Ull de Sol 1, Alaior, Menorca, Balearic Islands 07730, Spain.
Received: 4 July 2012 Accepted: 7 August 2012 Published: 13 August 2012
References
1. Preston PM:Theilerioses. InEncyclopedia of arthropod-transmitted infections of man and domesticated animals. Edited by Service MW. Wallingford, UK: CABI Publishing; 2001:487–502.
2. Uilenberg G:Babesiosis. InEncyclopedia of arthropod-transmitted infections of man and domesticated animals. Edited by Service MW. Wallingford, UK: CABI Publishing; 2001:53–60.
3. Estrada-Peña A, Bouattour A, Camicas J-L, Walker AR:Ticks of domestic animals in the Mediterranean region. A guide to identification of species. Zaragoza, Spain: University of Zaragoza; 2004.
4. Habela M, Rol JA, Antón JM, Pena J, Corchero E, Van HI, Jongejan E:
Epidemiology of Mediterranean theileriosis in Extremadura region, Spain.Parassitologia1999,41(Suppl 1):47–51.
5. Almería S, Castellá J, Ferrer D, Gutierrez JF, Estrada-Peña A, Sparagano O:
Reverse line blot hybridization used to identify hemoprotozoa in Minorcan cattle.Ann N Y Acad Sci2002,969:78–82.
6. Almería S, Delgado-Neira Y, Adelantado C, Huguet M, Vinent J, Nicolás A:
Mediterranean theileriosis and other tick transmitted piroplasmoses in in cattle in Minorca (Balearic Islands, Spain): the effect of tick control on prevalence levels analyzed by reverse line blot (RLB) macroarrays.
J Parasitol2009,95:598–603.
7. Castellá J, Estrada-Peña A, Almería S, Ferrer D, Gutierrez J, Ortuño A:A survey of ticks (Acari:Ixodidae) on dairy cattle on the island of Menorca in Spain.Exp Appl Acarol2001,25:899–908.
8. Almería S, Castellá J, Ferrer D, Ortuño A, Estrada-Peña A, Gutierrez JF:
Bovine piroplasms in Minorca (Balearic Islands, Spain): a comparison of PCR-based and light microscopy detection.Vet Parasitol2001,99:249–259. 9. Bilgic HB, Karagenc T, Shiels B, Tait A, Eren H, Weir W:Evaluation of
cytochrome bas a sensitive target for PCR based detection of T. annulatacarrier animals.Vet Parasitol2010,174:341–347.
10. d’Oliveira C, van der Weide M, Habela MA, Jacquiet P, Jongejan F:Detection ofTheileria annulatain blood samples of carrier cattle by PCR.J Clin Microbiol1995,33:2665–2669.
11. Gubbels JM, de Vos AP, van der Weide M, Viseras J, Schouls LM, de Vries E, Jongejan F:Simultaneous detection of bovineTheileriaandBabesia species by reverse line blot hybridization.J Clin Microbiol1999,
37:1782–1789.
12. Ros-García A, Juste RA, Hurtado A:A highly sensitive DNA bead-based suspension array for the detection and species identification of bovine piroplasms.Int J Parasitol2012,42:207–214.
13. Gibello A, Blanco MM, Moreno MA, Cutuli MT, Domenech A, Domínguez L, Fernández-Garayzabal JF:Development of a PCR assay for detection of Yersinia ruckeriin tissues of inoculated and naturally infected trout.Appl Environ Microbiol1999,65:346–350.
14. Lund M, Nordentoft S, Pedersen K, Madsen M:Detection ofCampylobacter spp. in chicken fecal samples by real-time PCR.J Clin Microbiol2004,
42:5125–5132.
15. Nagore D, García-Sanmartín J, García-Pérez AL, Juste RA, Hurtado A:
Identification, genetic diversity and prevalence ofTheileriaandBabesia species in a sheep population from Northern Spain.Int J Parasitol2004,
34:1059–1067.
16. Sivaganesan M, Haugland RA, Chern EC, Shanks OC:Improved strategies and optimization of calibration models for real-time PCR absolute quantification.Water Res2010,44:4726–4735.
17. Georges K, Loria GR, Riili S, Greco A, Caracappa S, Jongejan F, Sparagano O:
Detection of haemoparasites in cattle by reverse line blot hybridisation with a note on the distribution of ticks in Sicily.Vet Parasitol2001,
99:273–286.
18. Sivaganesan M, Seifring S, Varma M, Haugland RA, Shanks OC:A Bayesian method for calculating real-time quantitative PCR calibration curves using absolute plasmid DNA standards.BMC Bioinformatics2008,9:120. 19. Bhoora R, Quan M, Franssen L, Butler CM, van der Kolk JH, Guthrie AJ,
Zweygarth E, Jongejan F, Collins NE:Development and evaluation of real-time PCR assays for the quantitative detection ofBabesia caballiand Theileria equiinfections in horses from South Africa.Vet Parasitol2010,
168:201–211.
20. Kim C, Iseki H, Herbas MS, Yokoyama N, Suzuki H, Xuan X, Fujisaki K, Igarashi I:Development of TaqMan-based real-time PCR assays for diagnostic detection ofBabesia bovisandBabesia bigemina.Am J Trop Med Hyg2007,77:837–841.
21. Sibeko KP, Oosthuizen MC, Collins NE, Geysen D, Rambritch NE, Latif AA, Groeneveld HT, Potgieter FT, Coetzer JAW:Development and evaluation of a real-time polymerase chain reaction test for the detection ofTheileria parvainfections in Cape buffalo (Syncerus caffer) and cattle.Vet Parasitol 2008,155:37–48.
22. Hoorfar J, Malorny B, Abdulmawjood A, Cook N, Wagner M, Fach P:
Practical considerations in design of internal amplification controls for diagnostic PCR assays.J Clin Microbiol2004,42:1863–1868.
23. Bustin SA, Benes V, Garson JA, Hallemans J, Huggett J, Kubista M, Mueller R, Nolan T, Pfaffl MW, Shipley GL, Vandesompele J, Wittwer CT:The MIQE guidelines: minimum information for publication of quantitative real-time PCR experiments.Clin Chem2009,55:611–622.
doi:10.1186/1756-3305-5-171
Cite this article as:Ros-Garcíaet al.:Development and evaluation of a real-time PCR assay for the quantitative detection ofTheileria annulata