Article
Extended Delta-Bar-Delta Algorithm Application to
Evaluate Transmission Lines Overvoltages
Iman Sadeghkhani
1, Abbas Ketabi
2, and Rene Feuillet
31 Department of Electrical Engineering, Najafabad Branch, Islamic Azad University, Najafabad
85141-43131, Iran
2 Department of Electrical Engineering, University of Kashan, Kashan 87317-51167, Iran 3 Grenoble Electrical Engineering Lab (G2ELab), Grenoble INP, France
E-mail: 1[email protected] (Corresponding author), 2[email protected], 3[email protected]
Abstract. In this paper an intelligent approach is introduced to study switching
overvoltages during transmission lines energization. In most countries, the main step in the process of power system restoration, following a complete/partial blackout, is energization of primary restorative transmission lines. An artificial neural network (ANN) has been used to evaluate the overvoltages due to transmission lines energization. Three learning algorithms, delta-bar-delta (DBD), extended delta-bar-delta (EDBD) and directed random search (DRS), were used to train the ANNs. Proposed ANN is trained with equivalent circuit parameters of the network as input parameters; therefore developed ANNs have proper generalization capability. The simulated results for 39-bus New England test system, show that the proposed technique can estimate the peak values and duration of switching overvoltages with acceptable accuracy and EDBD algorithm presents best performance.
Keywords: Artificial neural networks, delta-bar-delta, directed random search, switching
overvoltages, power system restoration, transmission lines energization.
ENGINEERING JOURNAL Volume 17 Issue 4
1.
Introduction
Switching overvoltage is a primary importance in insulation co-ordination for extra high voltage (EHV) lines. The objective of simulating switching overvoltage is to help for a proper insulation co-ordination and would lead to minimize damage and interruption to service as a consequence of steady state, dynamic and transient overvoltage [1-5].
The magnitude and shape of the switching overvoltages vary with the system parameters and network configuration. Even with the same system parameters and network configuration, the switching overvoltages are highly dependent on the characteristics of the circuit breaker operation and the point-on-wave where the switching operation takes place [6-9].
In this paper power system blockset (PSB), a MATLAB/Simulink-based simulation tool [10-11] is used for computation of overvoltages. This paper presents the artificial neural network (ANN) application for estimation of peak and duration overvoltages under switching transients during transmission lines energization. A tool such as proposed in this paper that can give the maximum switching overvoltage and its duration will be helpful to the operator. It can be used as training tool for the operators. The proposed ANN is expected to learn many scenarios of operation to give the maximum peak overvoltage and it's duration in a shortest computational time which is the requirement during online operation of power systems.
In this paper we have considered the most important aspects, which influence the transient overvoltages such as voltage at sending end of transmission line before switching, equivalent resistance, equivalent inductance, equivalent capacitance, switching angle, line length, line capacitance, and shunt reactor capacity. This information will help the operator to select the proper sequence of transmission lines to be energized safely with transients appearing safe within the limits. Since ANN is trained with equivalent circuit parameters, thus it's applicable to every studied system. In fact, proposed ANN is trained just once with a simple circuit that includes equivalent circuit parameters. Therefore, developed ANN can estimate overvoltage peak and duration for every studied system. Results of the studies are presented for 39-bus New England test system to illustrate the proposed approach.
2.
Study System Modeling
In this paper the simulations are carried out employing PSB [10]. The simulation tool has been developed using state variable approach and runs in the MATLAB/Simulink environment. This program has been compared with other popular simulation packages (EMTP and Pspice) in [11]. The user friendly graphical interfaces of PSB enable faster development for power system transient analysis. Transmission lines are described by the distributed line model. This model is accurate enough for frequency dependent parameters, because the positive sequence resistance and inductance are fairly constant up to approximately 1 KHz [12] which cover the frequency range of harmonic overvoltages phenomena. In [13] generators have been modelled by generalized Park’s model that both electrical and mechanical part are thoroughly modelled, but it has been shown that a simple static generator model containing an ideal voltage source behind the sub-transient inductance in series with the armature winding resistance can be as accurate as the Park model. Thus in this work, generators are represented by the static generator model. Phases of voltage sources are determined by the load flow results. All of the loads and shunt devices, such as capacitors and reactors, are modelled as constant impedances.
3.
Switching Overvoltages during Restoration
Fig. 1. Study system for transmission line energization. G: generator, Reqv: equivalent resistance, Leqv: equivalent inductance, Ceqv: equivalent capacitance.
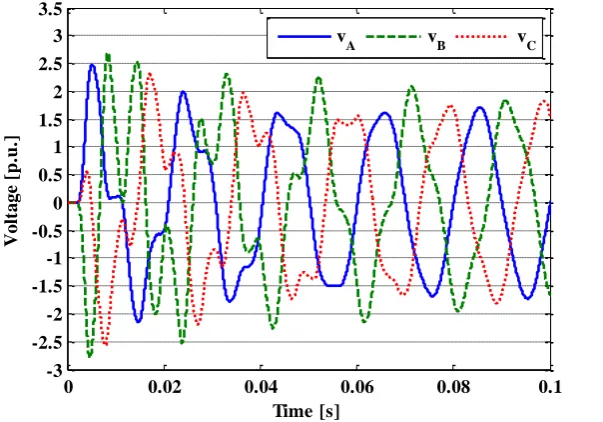
Fig. 2. Harmonic overvoltage at bus 3 (receiving end) after switching of transmission line.
The sample system considered for explanation of the proposed methodology is a 400 kV EHV network shown in Fig. 1. In the system studies 400 kV line-to-line is considered as a base voltage and 100 MVA is adopted as a base power. Fig. 2 shows the harmonic overvoltages at bus 3 when transmission line is energized.
In practical system a number of factors affect the overvoltages factors due to energization or reclosing. In this paper following parameters is considered as ANN inputs:
Voltage at sending end of transmission line before switching
Equivalent resistance of the network
Equivalent inductance of the network
Equivalent capacitance of the network
Closing time of the circuit breaker poles
Line length
Line capacitance
Shunt reactor capacity
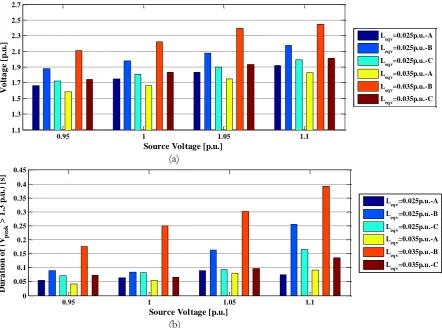
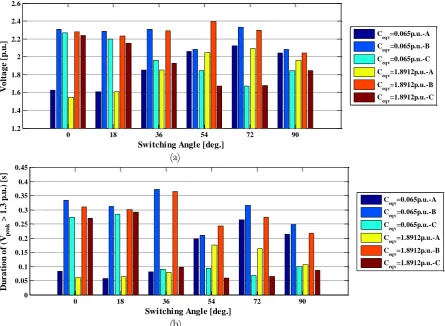
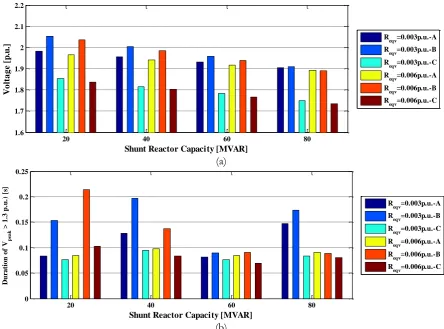
Fig. 3 shows the effect of source voltage on overvoltage at different equivalent inductance. Fig. 4 shows the effect of line length on overvoltages at different line capacitance. Also, Fig. 5 shows the effect of switching angle on overvoltage at different equivalent capacitance, and Fig. 6 shows the effect of shunt reactor capacity on overvoltage at different equivalent resistance.
As discussed above for an existing system the main factors which affect the peak and duration values of switching overvoltage are voltage at sending end of transmission line before switching, equivalent resistance, equivalent inductance, equivalent capacitance, switching angle, line length, line capacitance, and shunt reactor capacity. Here it should be mentioned that a single parameter often cannot be regarded independently from the other important influencing factors. The magnitude and duration of the overvoltages normally does not depend directly on any single isolated parameter and a variation of one
0 0.02 0.04 0.06 0.08 0.1
-3 -2.5 -2 -1.5 -1 -0.5 0 0.5 1 1.5 2 2.5 3 3.5
Time [s]
V
ol
tage
[
p
.u
.]
[image:3.595.148.450.200.411.2]parameter can often alter the influence of another parameter, in other words there exists an interaction between the various system and breaker parameters. This forbids the derivation of precise generalized rule of simple formulae applicable to all cases [16]. So an ANN can help to estimate the peak and duration values of switching overvoltages generated during transmission line energization. An ANN is programmed by presenting it with training set of input/output patterns from which it then learns the relationship between the inputs and outputs. In next section an ANN-based approach is described which can give an acceptable solution of switching transients by the help of which an operator can take a quick decision at the time of operation.
(a)
[image:4.595.79.522.191.519.2](b)
Fig. 3. Overvoltage at bus 3 as source voltage while equivalent resistance 0.005 p.u., equivalent capacitance 1.8912 p.u., switching angle 36°, line length 250 km, line capacitance 1.2121 F/km, and shunt reactor capacity 15 MVAR. Leqv is equivalent inductance. (a) Peak, (b) Duration.
(a)
0.95 1 1.05 1.1
1.1 1.3 1.5 1.7 1.9 2.1 2.3 2.5 2.7
Source Voltage [p.u.]
V o lt a g e [ p .u .]
Leqv=0.025p.u.-A Leqv=0.025p.u.-B Leqv=0.025p.u.-C Leqv=0.035p.u.-A Leqv=0.035p.u.-B Leqv=0.035p.u.-C
0.95 1 1.05 1.1
0 0.05 0.1 0.15 0.2 0.25 0.3 0.35 0.4 0.45
Source Voltage [p.u.]
D u r a ti o n o f (V p eak > 1 .3 p .u .) [ s]
Leqv=0.025p.u.-A Leqv=0.025p.u.-B Leqv=0.025p.u.-C Leqv=0.035p.u.-A Leqv=0.035p.u.-B Leqv=0.035p.u.-C
150 200 250 300 350
1.2 1.4 1.6 1.8 2 2.2 2.4 2.6 2.8
Line Length [km]
V o lt a g e [ p .u .]
(b)
Fig. 4. Overvoltage at bus 3 as line length while source voltage 1.05 p.u., equivalent resistance 0.005 p.u., equivalent inductance 0.02 p.u., equivalent capacitance 1.8912 p.u., switching angle 36°, and shunt reactor capacity 15 MVAR. CLine is line capacitance. (a) Peak, (b) Duration.
(a)
(b)
Fig. 5. Overvoltage at bus 3 as switching angle while source voltage 1 p.u., equivalent resistance 0.004 p.u., equivalent inductance 0.025 p.u., line length 300 km, line capacitance 1.237e-8 F/km, and shunt reactor capacity 20 MVAR. Ceqv is equivalent capacitance. (a) Peak, (b) Duration.
150 200 250 300 350
0 0.05 0.1 0.15 0.2 0.25
Line Length [km]
D u rat ion of ( V p eak > 1. 3 p .u .) [ s]
CLine=1.1875e-8F/km-A CLine=1.1875e-8F/km-B CLine=1.1875e-8F/km-C CLine=1.2617e-8F/km-A CLine=1.2617e-8F/km-B CLine=1.2617e-8F/km-C
0 18 36 54 72 90
1.2 1.4 1.6 1.8 2 2.2 2.4 2.6
Switching Angle [deg.]
V o lt a g e [ p .u .]
Ceqv=0.065p.u.-A Ceqv=0.065p.u.-B Ceqv=0.065p.u.-C Ceqv=1.8912p.u.-A Ceqv=1.8912p.u.-B Ceqv=1.8912p.u.-C
0 18 36 54 72 90
0 0.05 0.1 0.15 0.2 0.25 0.3 0.35 0.4 0.45
Switching Angle [deg.]
D u r a ti o n o f (V p eak > 1 .3 p .u .) [ s]
[image:5.595.78.524.296.622.2](a)
[image:6.595.76.521.78.407.2](b)
Fig. 6. Overvoltage at bus 3 as shunt reactor capacity while source voltage 1 p.u., equivalent inductance 0.025 p.u., equivalent capacitance 1.2825 p.u., switching angle 90°, line length 300 km, and line capacitance 1.237e-8 F/km. Reqv is equivalent resistance. (a) Peak, (b) Duration.
4.
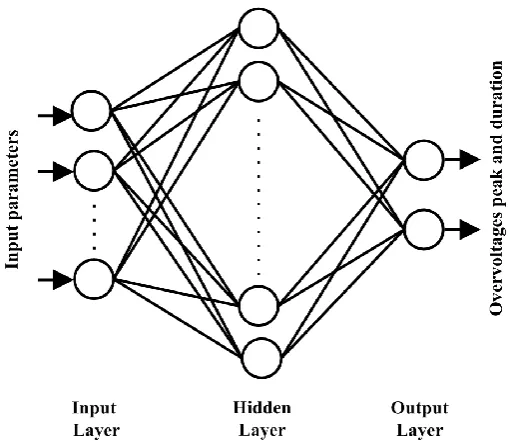
The Artificial Neural Network
The basic structure of the Artificial Neural Network (ANN) is shown in Fig. 7. The ANN consists of three layers namely, the inputs layer, the hidden layer, and the output layer. Training a network consists of adjusting weights of the network using a different learning algorithm [17,18]. In this work, ANNs are trained with the two supervised and one reinforcement learning algorithms. In this paper, the delta-bar-delta (DBD), the extended delta-bar-delta-bar-delta-bar-delta (EDBD) and the directed random search (DRS) were used to train the multi-layer perceptron (MLP) neural network [19]. To improve the performance of ANNs, tangent hyperbolic activation function was used. A learning algorithm gives the change Δwji(k) in the weight of a
connection between neurons i and j.
Relative error is calculated by the difference of PSB output and ANN output:
100 PSB
PSB ANN (%)
ErRelative (1)
and absolute error is calculated as:
PSB ANN
ErAbsolute (2)
In the next section, these learning algorithms have been explained briefly.
20 40 60 80
1.6 1.7 1.8 1.9 2 2.1 2.2
Shunt Reactor Capacity [MVAR]
V
o
lt
a
g
e
[
p
.u
.]
Reqv=0.003p.u.-A Reqv=0.003p.u.-B Reqv=0.003p.u.-C Reqv=0.006p.u.-A Reqv=0.006p.u.-B Reqv=0.006p.u.-C
20 40 60 80
0 0.05 0.1 0.15 0.2 0.25
Shunt Reactor Capacity [MVAR]
D
u
rat
ion
of
V
p
eak
>
1.
3
p
.u
.)
[
s]
Fig. 7. The structure of artificial neural network.
4.1. Delta-Bar-Delta Algorithm
The DBD algorithm is a heuristic approach to improve the convergence speed of the weights in ANNs [20]. The weights are updated by
( 1) ( ) ( ) ( )
w k w k k k (3)
where ( )k is the learning coefficient and assigned to each connection, ( )k is the gradient component of
the weight change. ( )k is employed to implement the heuristic for incrementing and decrementing the
learning coefficients for each connection. The weighted average (k) is formed as
( )k (1 ) ( )k (k 1)
(4)
where θ is the convex weighting factor. The learning coefficient change is given as
( 1) ( ) 0
( ) ( ) ( 1) ( ) 0
0 otherwise
k k
k k k k
(5)
where is the constant learning coefficient increment factor, and is the constant learning coefficient decrement factor.
4.2. Extended Delta-Bar-Delta Algorithm
The EDBD algorithm is an extension of the DBD and based on decreasing the training time for ANNs [21]. In this algorithm, the changes in weights are calculated from:
( 1) ( ) ( ) ( ) ( )
w k k k k w k
(6)
and the weights are then found as
( 1) ( ) ( )
In Eq. (6), ( )k and ( )k are the learning and momentum coefficients, respectively. The learning
coefficient change is given as
exp( ( ) if ( 1) ( ) 0
( ) ( ) if ( 1) ( ) 0
0 otherwise
a k k k
k k k k
(8)
where is the constant learning coefficient scale factor, exp is the exponential function, is the constant
learning coefficient decrement factor, and is the constant learning coefficient exponential factor. The
momentum coefficient change is also written as
exp( ( ) if ( 1) ( ) 0
( ) ( ) if ( 1) ( ) 0
0 otherwise
k k k
k k k k
(9)
where is the constant momentum coefficient scale factor, is the constant momentum coefficient
decrement factor, and is the constant momentum coefficient exponential factor. In order to take a step
further to prevent wild jumps and oscillations in the weight space, ceilings are placed on the individual connection learning and momentum coefficients [21].
4.3. Directed Random Search Algorithm
The directed random search is a reinforcement learning approach and used to calculate the weights of ANNs. This algorithm also tries to minimize the overall error [22]. Random steps are taken in the weights and a directed component is added to the random step to enable an impetus to pursue previously search directions. The DRS is based on four procedures as random step, reversal step, directed procedure and self-tuning variance. In the random step, a random value is added to each weight of network and the error is then evaluated for all training sets as
( 1) best ( )
w k w dw k (10)
where wbest is the best weight vector previous to iteration k and dw k( ) is the delta weight vector at iteration
k. Depending on the error evaluation, the weights are replaced with the new weights. If there is no improvement at the error in the random step, some random value is subtracted from the weight value during the reversal step, that is
( 1) best ( )
w k w dw k (11)
In [22], a directed procedure has been added to the random step to further improve with reversals. The new weights are obtained from:
( 1) best ( ) ( )
w k w dw k dp k (12)
where dp(k) is the directed procedure and based on the history of success or failure of the random steps.
As mentioned before, the following parameters are used as ANN inputs:
Voltage at sending end of transmission line before switching
Equivalent resistance of the network
Equivalent inductance of the network
Closing time of the circuit breaker poles
Line length
Line capacitance
Shunt reactor capacity
To train ANNs, all experiments have been repeated for different system parameters. After learning, all parameters of the trained networks have been frozen and then used in the retrieval mode for testing the capabilities of the system on the data not used in learning. The testing data samples have been generated through the PSB program by placing the parameter values not used in learning, by applying different parameters. A large number of testing data have been used to check the proposed solution in the most objective way at practically all possible parameters variation.
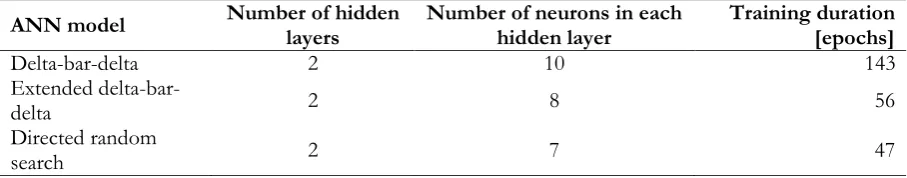
[image:9.595.71.525.315.404.2]In this study, a number of tests were performed varying with the one or two hidden layers as well as varying the number of neurons in each hidden layer for every algorithm. Specification of developed ANNs is presented in Table 1. These values (number of hidden layers and units) are optimum case for every algorithm from both the accuracy and training speed point of view and present best evaluation of transmission line overvoltages.
Table 1. Specification of developed ANNs
ANN model Number of hidden layers Number of neurons in each hidden layer Training duration [epochs]
Delta-bar-delta 2 10 143
Extended
delta-bar-delta 2 8 56
Directed random
search 2 7 47
5.
Case Study
In this section, the proposed algorithm is demonstrated for two case studies that are a portion of 39-bus New England test system, of which its parameters are listed in [23].
In the proposed method, first, studied system must be converted to equivalent circuit of Fig. 1, i.e., values of voltage at sending end of transmission line before switching, equivalent resistance, equivalent inductance, and equivalent capacitance are calculated by using equivalent circuit theory. These values are used in trained artificial neural network to estimate overvoltages peak and duration.
5.1. Case 1
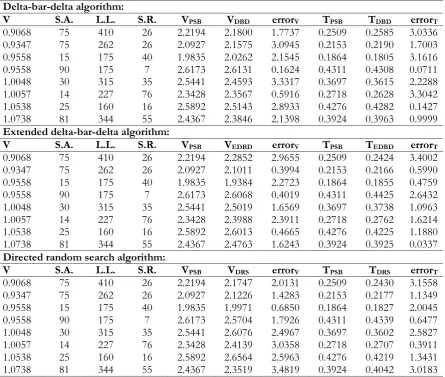
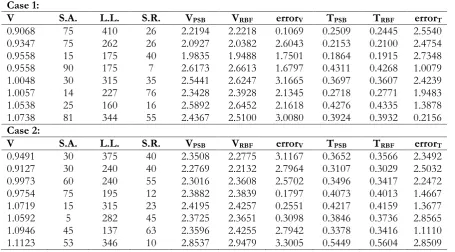
Fig. 8 shows a one-line diagram of a portion of 39-bus New England test system which is in restorative state. In the next step of the restoration, line 5_6 must be energized. First, equivalent circuit of this system, seen behind bus 5, is determined and values of voltage at sending end of transmission line before switching, equivalent resistance, equivalent inductance, and equivalent capacitance are calculated. In other words, this system is converted to equivalent system of Fig. 1. Values of equivalent resistance, equivalent inductance and equivalent capacitance are 0.006408 p.u., 0.02375, and 1.4516 p.u., respectively. For testing trained ANN, values of voltage at sending bus of transmission line before switching, switching angle, line length, and shunt reactor capacity are varied and in each state, overvoltage peak values are calculated from trained ANN and actual system (no equivalent). Table 2 contains the some sample result of test data of case 1.
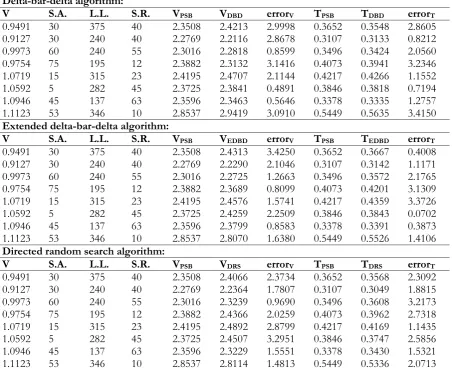
5.2. Case 2
cases of transmission line energization are taken into account and corresponding peak and duration overvoltages are computed from PSB program and trained ANN. Summary of few result are presented in Table 3. It can be seen from the results that the developed ANNs are able to estimate overvoltage peak and duration with good accuracy.
[image:10.595.77.523.304.681.2]Fig. 8. Studied system for case 1.
Table 2. Case 1 some sample testing data and output.
Delta-bar-delta algorithm:
V S.A. L.L. S.R. VPSB VDBD errorV TPSB TDBD errorT
0.9068 75 410 26 2.2194 2.1800 1.7737 0.2509 0.2585 3.0336
0.9347 75 262 26 2.0927 2.1575 3.0945 0.2153 0.2190 1.7003
0.9558 15 175 40 1.9835 2.0262 2.1545 0.1864 0.1805 3.1616
0.9558 90 175 7 2.6173 2.6131 0.1624 0.4311 0.4308 0.0711
1.0048 30 315 35 2.5441 2.4593 3.3317 0.3697 0.3615 2.2288
1.0057 14 227 76 2.3428 2.3567 0.5916 0.2718 0.2628 3.3042
1.0538 25 160 16 2.5892 2.5143 2.8933 0.4276 0.4282 0.1427
1.0738 81 344 55 2.4367 2.3846 2.1398 0.3924 0.3963 0.9999 Extended delta-bar-delta algorithm:
V S.A. L.L. S.R. VPSB VEDBD errorV TPSB TEDBD errorT
0.9068 75 410 26 2.2194 2.2852 2.9655 0.2509 0.2424 3.4002
0.9347 75 262 26 2.0927 2.1011 0.3994 0.2153 0.2166 0.5990
0.9558 15 175 40 1.9835 1.9384 2.2723 0.1864 0.1855 0.4759
0.9558 90 175 7 2.6173 2.6068 0.4019 0.4311 0.4425 2.6432
1.0048 30 315 35 2.5441 2.5019 1.6569 0.3697 0.3738 1.0963
1.0057 14 227 76 2.3428 2.3988 2.3911 0.2718 0.2762 1.6214
1.0538 25 160 16 2.5892 2.6013 0.4665 0.4276 0.4225 1.1880
1.0738 81 344 55 2.4367 2.4763 1.6243 0.3924 0.3925 0.0337 Directed random search algorithm:
V S.A. L.L. S.R. VPSB VDRS errorV TPSB TDRS errorT
0.9068 75 410 26 2.2194 2.1747 2.0131 0.2509 0.2430 3.1558
0.9347 75 262 26 2.0927 2.1226 1.4283 0.2153 0.2177 1.1349
0.9558 15 175 40 1.9835 1.9971 0.6850 0.1864 0.1827 2.0045
0.9558 90 175 7 2.6173 2.5704 1.7926 0.4311 0.4339 0.6477
1.0048 30 315 35 2.5441 2.6076 2.4967 0.3697 0.3602 2.5827
1.0057 14 227 76 2.3428 2.4139 3.0358 0.2718 0.2707 0.3911
1.0538 25 160 16 2.5892 2.6564 2.5963 0.4276 0.4219 1.3431
1.0738 81 344 55 2.4367 2.3519 3.4819 0.3924 0.4042 3.0183
= overvoltage duration calculated by DRS [s], errorV = voltage error [%], and errorT = duration time error [%].
Fig. 9. Studied system for case 2.
Table 3. Case 2 some sample testing data and output.
Delta-bar-delta algorithm:
V S.A. L.L. S.R. VPSB VDBD errorV TPSB TDBD errorT
0.9491 30 375 40 2.3508 2.4213 2.9998 0.3652 0.3548 2.8605
0.9127 30 240 40 2.2769 2.2116 2.8678 0.3107 0.3133 0.8212
0.9973 60 240 55 2.3016 2.2818 0.8599 0.3496 0.3424 2.0560
0.9754 75 195 12 2.3882 2.3132 3.1416 0.4073 0.3941 3.2346
1.0719 15 315 23 2.4195 2.4707 2.1144 0.4217 0.4266 1.1552
1.0592 5 282 45 2.3725 2.3841 0.4891 0.3846 0.3818 0.7194
1.0946 45 137 63 2.3596 2.3463 0.5646 0.3378 0.3335 1.2757
1.1123 53 346 10 2.8537 2.9419 3.0910 0.5449 0.5635 3.4150 Extended delta-bar-delta algorithm:
V S.A. L.L. S.R. VPSB VEDBD errorV TPSB TEDBD errorT
0.9491 30 375 40 2.3508 2.4313 3.4250 0.3652 0.3667 0.4008
0.9127 30 240 40 2.2769 2.2290 2.1046 0.3107 0.3142 1.1171
0.9973 60 240 55 2.3016 2.2725 1.2663 0.3496 0.3572 2.1765
0.9754 75 195 12 2.3882 2.3689 0.8099 0.4073 0.4201 3.1309
1.0719 15 315 23 2.4195 2.4576 1.5741 0.4217 0.4359 3.3726
1.0592 5 282 45 2.3725 2.4259 2.2509 0.3846 0.3843 0.0702
1.0946 45 137 63 2.3596 2.3799 0.8583 0.3378 0.3391 0.3873
1.1123 53 346 10 2.8537 2.8070 1.6380 0.5449 0.5526 1.4106 Directed random search algorithm:
V S.A. L.L. S.R. VPSB VDRS errorV TPSB TDRS errorT
0.9491 30 375 40 2.3508 2.4066 2.3734 0.3652 0.3568 2.3092
0.9127 30 240 40 2.2769 2.2364 1.7807 0.3107 0.3049 1.8815
0.9973 60 240 55 2.3016 2.3239 0.9690 0.3496 0.3608 3.2173
0.9754 75 195 12 2.3882 2.4366 2.0259 0.4073 0.3962 2.7318
1.0719 15 315 23 2.4195 2.4892 2.8799 0.4217 0.4169 1.1435
1.0592 5 282 45 2.3725 2.4507 3.2951 0.3846 0.3747 2.5856
1.0946 45 137 63 2.3596 2.3229 1.5551 0.3378 0.3430 1.5321
1.1123 53 346 10 2.8537 2.8114 1.4813 0.5449 0.5336 2.0713
[image:11.595.74.527.316.686.2]= overvoltage duration calculated by DRS [s], errorV = voltage error [%], and errorT = duration time error [%].
6.
Discussion
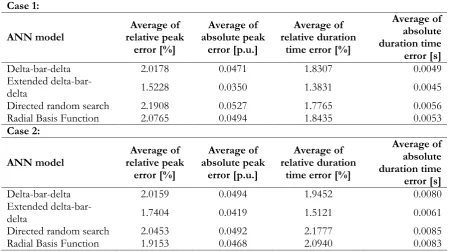
As seen in Tables 2 and 3, all trained ANNs based on DBD, EDBD, and DRS algorithms can estimate overvoltages peak and duration with proper accuracy. Also, the author in [24] evaluated “single-phase” transmission lines overvoltages using radial basis function (RBF) neural network. Because of “three-phase” transmission lines are considered in this paper, evaluation of “three-phase” transmission lines using RBF neural network is presented in Table 4 for comparison with developed ANNs. Optimum structure of RBF for this study involves two hidden layers and 10 hidden units in each hidden layer. Table 5 presents a comparison between DBD, EDBD, DRS algorithms and RBF structure based on average of relative and absolute errors. Based on Table 5, it can be concluded that EDBD algorithm has better performance (smaller relative and absolute errors in both case studies) and is proper for evaluating of transmission line overvoltages in power system studies.
7.
Conclusion
[image:12.595.73.529.442.694.2]This paper presents an ANN-based method to evaluate transmission lines switching overvoltages during power system restoration. The delta-bar-delta, extended delta-bar-delta and directed random search has been adopted to train ANN. Since equivalent circuit parameters of the network are employed as ANN inputs, developed ANNs are applicable for every studied system. Best performance has been achieved by extended delta-bar-delta algorithm. The results from this scheme are close to results from the conventional method and helpful in predicting the overvoltage of the other case studies within the range of training set. Therefore, the ANN application is recommended as an operator-training tool for estimation of temporary overvoltages during power system restoration.
Table 4. Some sample testing data and output for RBF structure.
Case 1:
V S.A. L.L. S.R. VPSB VRBF errorV TPSB TRBF errorT
0.9068 75 410 26 2.2194 2.2218 0.1069 0.2509 0.2445 2.5540 0.9347 75 262 26 2.0927 2.0382 2.6043 0.2153 0.2100 2.4754 0.9558 15 175 40 1.9835 1.9488 1.7501 0.1864 0.1915 2.7348 0.9558 90 175 7 2.6173 2.6613 1.6797 0.4311 0.4268 1.0079 1.0048 30 315 35 2.5441 2.6247 3.1665 0.3697 0.3607 2.4239 1.0057 14 227 76 2.3428 2.3928 2.1345 0.2718 0.2771 1.9483 1.0538 25 160 16 2.5892 2.6452 2.1618 0.4276 0.4335 1.3878 1.0738 81 344 55 2.4367 2.5100 3.0080 0.3924 0.3932 0.2156 Case 2:
V S.A. L.L. S.R. VPSB VRBF errorV TPSB TRBF errorT
0.9491 30 375 40 2.3508 2.2775 3.1167 0.3652 0.3566 2.3492 0.9127 30 240 40 2.2769 2.2132 2.7964 0.3107 0.3029 2.5032 0.9973 60 240 55 2.3016 2.3608 2.5702 0.3496 0.3417 2.2472 0.9754 75 195 12 2.3882 2.3839 0.1797 0.4073 0.4013 1.4667 1.0719 15 315 23 2.4195 2.4257 0.2551 0.4217 0.4159 1.3677 1.0592 5 282 45 2.3725 2.3651 0.3098 0.3846 0.3736 2.8565 1.0946 45 137 63 2.3596 2.4255 2.7942 0.3378 0.3416 1.1110 1.1123 53 346 10 2.8537 2.9479 3.3005 0.5449 0.5604 2.8509
Table 5. Values of relative and absolute errors for developed ANNs.
Case 1:
ANN model relative peak Average of
error [%]
Average of absolute peak
error [p.u.]
Average of relative duration
time error [%]
Average of absolute duration time error [s]
Delta-bar-delta 2.0178 0.0471 1.8307 0.0049
Extended
delta-bar-delta 1.5228 0.0350 1.3831 0.0045
Directed random search 2.1908 0.0527 1.7765 0.0056
Radial Basis Function 2.0765 0.0494 1.8435 0.0053
Case 2:
ANN model relative peak Average of
error [%]
Average of absolute peak
error [p.u.]
Average of relative duration
time error [%]
Average of absolute duration time error [s]
Delta-bar-delta 2.0159 0.0494 1.9452 0.0080
Extended
delta-bar-delta 1.7404 0.0419 1.5121 0.0061
Directed random search 2.0453 0.0492 2.1777 0.0085
Radial Basis Function 1.9153 0.0468 2.0940 0.0083
References
[1] M. M. Adibi, R. W. Alexander, and B. Avramovic, “Overvoltage control during restoration,” IEEE Trans. Power Syst., vol. 7, no. 4, pp. 1464-1470, 1992.
[2] M. M. Adibi, and R. J. Kafka, “Power system restoration issues,” IEEE Comput. Appl. Power, vol. 4, no. 2, pp. 19-24, 1991.
[3] X. Liu, X. Cui, and L. Qi, “Calculation of lightning-induced overvoltages on overhead lines based on DEPACT macromodel using circuit simulation software,” IEEE Trans. on Electromagnetic Compatibility, vol. 54, no. 4, pp. 837-849, Aug. 2012.
[4] J. W. Feltes et al., “Some considerations in the development of restoration plans for electric utilities serving large metropolitan area,” IEEE Trans. Power Syst., vol. 21, no. 2, pp. 909-915, 2006.
[5] A. Ketabi, A. M. Ranjbar, and R. Feuillet, “Analysis and control of temporary overvoltages for automated restoration planning,” IEEE Trans. Power Delivery, vol. 17, no. 4, pp. 1121-1127, 2002. [6] T. Keokhoungning, S. Premrudeepreechacharn, and K. Ngamsanroaj, “Evaluation of switching
overvoltage in 500 kV transmission line interconnection Nam Theun 2 Power Plant to Roi Et 2 substation,” in Proc. Asia Pacific Power and Energy Engineering Conference, pp. 1-4, 2009.
[7] D. Li, C. Wang, and X. Liu, “Investigation of lightning-induced overvoltages affected by the sag of the overhead transmission line,” IEEE Power Engineering and Automation Conference (PEAM), pp. 335-338, 2011.
[8] A. Vanegas, E. Velilla, J. Herrera, and J. A. Valencia, “An efficient procedure for computing lightning induced overvoltages on overhead lines,” in Proc. Compatibility and Power Electronics Conf. 2009, CPE ’09, pp. 368-374, 2009.
[9] B. Gustavsen, “Study of transformer resonant overvoltages caused by cable-transformer high-frequency interaction,” IEEE Transactions on Power Delivery, vol. 25, no. 2, pp. 770-779, 2010.
[10] A. Ketabi, and I. Sadeghkhani, Electric Power Systems Simulation Using MATLAB, 2nd ed., Morsal Publications, 2012 (in Persian).
[12] P. G. Boliaris, J. M. Prousalidis, N. D. Hatziargyriou, and B. C. Papadias, “Simulation of long transmission lines energization for black start studies,” in Proc. 7th Mediterranean Electrotechn. Conf., pp. 1093-1096, 1994.
[13] M. M. Duro, “Damping modelling in transformer energization studies for system restoration: Some standard models compared to field measurements,” in Proc. IEEE Bucharest Power Tech Conference, Bucharest, Romania, 2009.
[14] I. Sadeghkhani, A. Ketabi, and R. Feuillet, “Artificial neural network based method to mitigate temporary overvoltages,” Journal of Engineering Science and Technology Review, vol. 4, no. 2, pp. 193-200, Dec. 2011.
[15] A. Ketabi, I. Sadeghkhani, and R. Feuillet, “Using artificial neural network to analyze harmonic overvoltages during power system restoration,” European Transactions on Electrical Power,vol. 21, no. 7, pp. 1941-1953, Oct. 2011.
[16] Cigre Working Group, “Switching overvoltages in EHV and UHV systems with special reference to closing and reclosing transmission lines,” Electra 30, pp. 70-122, 1973.
[17] S. Haykin, Neural Network: A Comprehensive Foundation, 2nd ed., Prentice Hall, 1998.
[18] A. Maren, C. Harston, and R. Pap, Handbook of neural computing applications, London Academic Press, 1990.
[19] R. Bayindir, S. Sagiroglu, and I. Colak, “An intelligent power factor corrector for power system using artificial neural networks,” Electric Power Systems Research, vol. 79, no. 1, pp. 152-160, 2009.
[20] R.A. Jacobs, “Increased rate of convergence through learning rate adaptation,” Neural Networks, vol. 1, no. 4, pp. 295–307, 1988.
[21] A. Minai, and R. D. Williams, “Acceleration of backpropagation through learning rate and momentum adaptation,” International Joint Conference on Neural Networks, pp. 676-679, 1990.
[22] J. Matyas, “Random optimization,” Automation and Remote Control, vol. 26, no. 2, pp. 246-253, 1965. [23] S. Wunderlich, M. M. Adibi, R. Fischl, and C. O. D. Nwankpa, “An approach to standing phase angle
reduction,” IEEE Trans. Power Syst., vol. 9, no. 1, pp. 470-478, 1994.