This is a repository copy of The Impact of Central Government Policies on Local
Authorities’ Transport Expenditure and Provision. 2: Analysis of Trends in Local Transport Expenditure Since 1979..
White Rose Research Online URL for this paper: http://eprints.whiterose.ac.uk/2292/
Monograph:
Sanderson, Ian (1988) The Impact of Central Government Policies on Local Authorities’ Transport Expenditure and Provision. 2: Analysis of Trends in Local Transport Expenditure Since 1979. Working Paper. Institute of Transport Studies, University of Leeds , Leeds, UK.
Working Paper 261
eprints@whiterose.ac.uk https://eprints.whiterose.ac.uk/
Reuse
Unless indicated otherwise, fulltext items are protected by copyright with all rights reserved. The copyright exception in section 29 of the Copyright, Designs and Patents Act 1988 allows the making of a single copy solely for the purpose of non-commercial research or private study within the limits of fair dealing. The publisher or other rights-holder may allow further reproduction and re-use of this version - refer to the White Rose Research Online record for this item. Where records identify the publisher as the copyright holder, users can verify any specific terms of use on the publisher’s website.
Takedown
If you consider content in White Rose Research Online to be in breach of UK law, please notify us by
White Rose Research Online http://eprints.whiterose.ac.uk/
Institute of Transport Studies
University of Leeds
This is an ITS Working Paper produced and published by the University of Leeds. ITS Working Papers are intended to provide information and encourage discussion on a topic in advance of formal publication. They represent only the views of the authors, and do not necessarily reflect the views or approval of the sponsors.
White Rose Repository URL for this paper: http://eprints.whiterose.ac.uk/2292/
Published paper
Sanderson, Ian (1988) The Impact of Central Government Policies on Local Authorities’ Transport Expenditure and Provision. 2: Analysis of Trends in Local Transport Expenditure Since 1979. Institute of Transport Studies, University of Leeds. Working Paper 261
Workins Paner 261
May 1988
THE IMPACT OF CENTRAL GOVERNMENT POLICIES ON LOCAL
AUTHORITIES' TRANSPORT EXPENDITURE AND PROVISION
2: Analysis of Trends in Local Transport Expenditure
Since 1979
Ian Sanderson
ITS Working Papers are intended to provide information and encourage discussion on a topic in advance of formal publication. They represent only the views of the authors and do not necessarily reflect the views or approval of sponsors.
CONTENTS
1. Introduction
1.1 Background 1.2 Research Focus
1.3 Structure of Report
2. Trends in Local Transport Expenditure to 1984/85
2.1 Introduction
2.2 Current Expenditure
2.2.1 Trends between 1979/80 and 1982/83 2.2.2 Trends between 1982/83 and 1984/85 2.2.3 Block Grant, Targets and Penalties 2.3 Capital Expenditure
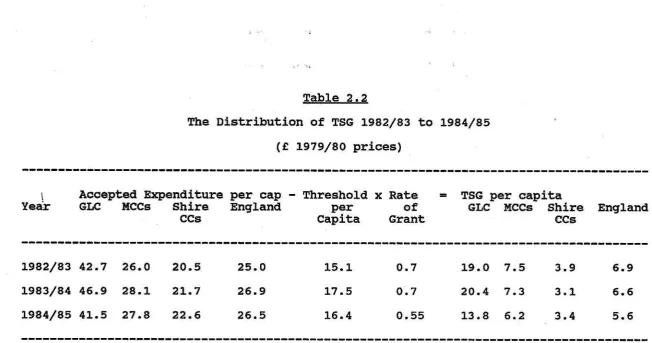
2.4 The Role of Transport Supplementary Grant 2.5 Discussion
3. Local Transport Expenditure Since 1984/85
3.1 Introduction
3.2 Recent Developments Affecting Local Transport Expenditure
3.3 The Refoxm of the TSG System
3.3.1 Current Expenditure since 1984/85 3.3.2 Capital Expenditure since 1984/85 3.4 Discussion
4. Summary and Conclusion
5. Research Issues
Annex : Real Terns Price Indices
Notes on Figures
Figures
Acknowledaement
The author wishes to acknowledge the assistance of various individuals and organisations in providing material for this research. In particular, thanks are due to M Howard Emmens and his staff in the Road Programme Division of the Department of Transport for assistance and comments and other staff in the
Finance Section of the Department. Also, information was
1. Introduction
1.1 Background
This report presents results from the second stage of a research project, funded by the Rees Jeffreys Road Fund, which aims to assess the impact of recent changes in central government policies and powers in relation to local government finance upon local authoritiesf transport expenditure and outputs and upon their approach to addressing local transport problems and needs. A previous Working Paper (Sanderson, 1988) reviews relevant changes in government policies and financial control mechanisms and identifies major research issues. The results presented in the present report derive from an analysis of data on trends in local authoritiesf transport expenditure relative to Government's spending plans and expenditure provisions over the period since 1979/80 which attempts to identify the impact of changes in government policies and controls. Conclusions from this analysis will provide the basis for a more detailed examination of information relating to a small sample of local authorities from which a better understanding of cause-effect relationships will be obtained. The results from this latter stage of the research will be published in a third working paper.
1.2 Research Focus
As indicated in our previous report (Sanderson, 1988, p 49-51) the central focus of our research is on the change in the Transport Supplementary Grant (TSG) system announced in 1984 which restricted TSG support from 1985/86 to capital expenditure in respect of road schemes 'of more than local importancef, specifically In... investment on roads which form part of the primary route network of major through routes, important urban roads, and bypasses and relief roads which relieve communities of the effects of heavy through trafficww (Department of Transport,
1984, para 2). However, it is considered that this change should
be examined in the context of a wide range of measures introduced
by the Conservative Government since 1979 affecting local
government finance in general, and the financing of local transport expenditure in particular. A consistent theme, with both economic and political dimensions, can be seen as running through these changes from the Local Government Planning and Land Act 1980, through the Local Government Finance Act 1982, the Rates Act 1984, the Transport Acts of 1983 and 1985, the Local Government Act 1985, and culminating in the Government's present proposals for the abolition of domestic rates and reform of the grants system, already on the Statute Book in respect of Scotland. These legislative measures can be seen as representing concrete manifestations of the Government's broader economic and political programme for Britain in which the objectives of reducing the role of the public sector and, conversely, providing the conditions for a flourishing and profitable private sector, produce major implications for local government, its role, responsibilities and financing (cf. Sanderson, 1988).
The specific measures which.have been introduced since the early
expenditure can be summarised as follows (see Sanderson op cit for a full discussion):
the introduction of the block grant system in 1981/82, following the Local Government Planning and Land Act 1980, with grant distribution based upon the new GRE methodology;
deriving from the same legislation, and also introduced in 1981/82, a new system of control over capital expenditure which replaced 'loan sanctions' with expenditure allocations for service blocks, thus shifting the focus of control from borrowing to actual spending;
the super-imposition on the basic block grant system of expenditure targets and grant penalties, which operated with increasing severity up to 1985/86, being replaced in 1986/87 by a modification to the 'grant-related poundage* schedule in the basic block grant formula;
the introduction of the 'selective rate limitation scheme' ('rate-capping') in 1985/86, following the Rates Act 1984, which provided for direct control by the Secretary of State
of the expenditure levels of those authorities whose
expenditure is considered to be 'excessive and
unreasonablef;
following the successful legal challenge by Bromley Council to the GLC's 'Fares Fair' policy and the consequent 1983 Transport Act, the designation by the Secretary of State of Protected Expenditure Levels' (PELs) relating to public transport revenue support in the metropolitan areas;
the transfer, in June 1984, of responsibility for public
transport in London from the GLC to London Regional
Transport, a nationalised industry whose financing is under the direct control of the Secretary of State;
the reform of the Transport Supplementary Grant (TSG) system from 1985/86 so as to terminate supplementary support for local transport current expenditure and restrict TSG to 'highways capital expenditure which is of more than local importance';
the abolition, in March 1986, of the GLC and the
Metropolitan County Councils and the transfer of
responsibility for public transport in the Metropolitan Counties to 'joint board' PTAs whose expenditure for the first three years of their existence is subject to direct control by the Secretary of State via the designation of
Expenditure Levelsf (ELs) and precept limits ;
the deregulation of local bus transport from October 1986, producing a requirement for local authorities to subject to competitive tender the 'supported services' which they wish to secure over and above the 'commercial services' provided by private bus operators;
authorities1 accumulated capital receipts in the designation
by the Government of capital allocations and 'their
relationship to provision.
Taken together with the Governmentls present proposals to replace domestic rates with a per capita 'community charge1, to introduce central control over the level and distribution of non-domestic rates, and to replace the present block grant with a 'needs grantf supplemented by a per capita 'standard grant1, the measures introduced since 1980 can be seen as effecting a significant increase in the degree of central control over local government expenditure. In terms of assessing the implications of these changes for local transport expenditure and provision we are clearly presented with an extremely complex task due to the coincidence and interaction of the effects of a number of different measures.
As indicated above, our research focusses, in particular, upon the reform of the TSG system in 1985/86 and it is obvious that this was introduced into a complex and changing context of measures with expenditure consequences. Thus, for example, when looking at the impact of the loss of TSG support for transport
current expenditure and the full incorporation of such
expenditure within the block grant system in 1985/86, the operation of the system of expenditure targets and penalties and the first year of the rate-capping system have to be examined; revenue support for public transport in London had ceased to be a local authority responsibility. The picture is complicated the following year by the ending of specific targets and penalties and by the abolition of the GLC and metropolitan county councils, with highways current expenditure transferring to the boroughs and districts but public transport current expenditure in the metropolitan counties becoming the responsibility of the PTAs. From October 1986 expenditure on public transport in all areas
was affected by bus deregulation. The capital expenditure
picture is similarly complicated, additionally by the inclusion in transport capital provision from 1987/88 of an assumed proportion of local authorities1 capital receipts accumulated
from previous years under the ,cascadingf system.
1.3 Structure of Report
2. Trends in Local Transvrt Exvenditure to 1984/85
2.1 Introduction
In this section we examine trends in transport expenditure by local authorities over the period 1979/80 to 1984/85 compared with trends in provision for such expenditure made by the Government in the context of the annual public expenditure planning system and published each year in the Public Expenditure
White Paper. In addition, the Government's plans for local
transport expenditure are reflected in the annual TSG settlement, which provides authorities with TSG on the basis of 'accepted
expenditures', which also reflect the Government's expenditure
plans. In general terms, when we use the term 'provision1 we
refer to the Government's plans as published in the Public Expenditure White Paper. The purpose of analysing trends up to 1984/85 is to provide an understanding of the context in which
the reform of the TSG system took place, discontinuing
supplementary grant support for current expenditure on road maintenance, safety and public transport revenue support and restricting it to capital expenditure on road schemes of more
than local importance. In particular, we aim to derive an
assessment of the role of TSG in explaining trends up to 1984/85 relative to the role of the broader systems for controlling local authorities1 current and capital expenditure.
The first part of this section looks at trends in local authoritiesf current expenditure relative to the Government's provision up to 1984/85 in terms of two sub-periods (first, 1979/80 to 1982/83 and, second, 1982/83 to 1984/85) with a specific examination of the role of the block grant system,
expenditure targets and grant penalties. Trends in capital
expenditure are then analysed with particular focus on the capital expenditure control system. Finally, an attempt is made to assess the role of TSG in explaining the trends in the context of the broader expenditure control systems.
2.2 Current Exvenditure
2.2.1 Trends Between 1979/80 and 1982/83
The trend in English local authorities1 current transport
expenditure since 1979/80 relative to the Government's planned
provision is shown in Figures 2.1
-
2.3. Two distinct periodsare evident in the trends to 1984/85. First, during the period
1979/80 to $982/83 total current expenditure increased by 13% in
real terms while the Government's provision decreased by 12%
reflecting the Government's attempts to reduce local authority spending in the context of broader measures to control public
expenditure generally (Sanderson, 1988, p 9-11). Consequently,
whereas there had been a slight underspend in 1979/80 (3.5%)' by 1982/83 local authorities' transport expenditure was some 23% in
...
l Throughout this report 'real terms' expenditure data is
derived using the GDP market price deflator except for road maintenance current expenditure for which a separate index
excess of provision. Most of the increase in expenditure up to 1982/83 was accounted for by support for public transport, 'which increased by 60%, and by concessionary fares (a 24% increase). On the other hand, the Government's spending plans provided for a decrease in such expenditure so that by 1982/83 spending on public transport revenue support was 63% in excess of provision,
while the overspend on concessionary fares was 24%. Over this
same period expenditure on road maintenance remained relatively constant in real terms while provision was decreased by some 7%,
producing a 5.7% overspend in 1982/83. Administration
(professional and technical services) was also substantially (c. 28%) overspent by 1982/83 in spite of a real terms reduction in spending of 14%, which failed to match the reduction in provision of 35%.
Therefore, it is apparent that between 1979/80 and 1982/83 the
Government's efforts to control local authoritiesf current
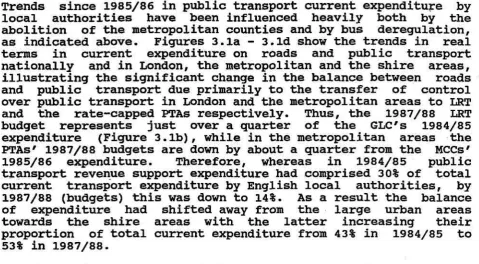
expenditure by decreasing provision (and Rate Support Grant) did not meet with success. Expenditure on public transport revenue support was responsible for much of the 'overspend problem' and, in particular, increased expenditure in London and Metropolitan
Counties
-
up by 82% between 1979/80 and 1982/83 (see Figure2.4).
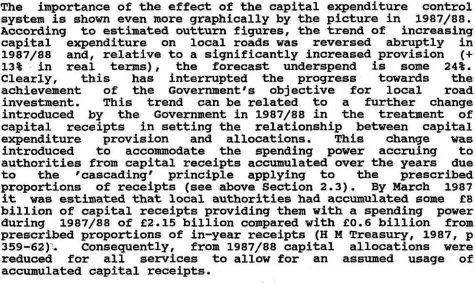
The pattern of revenue support expenditure over this period is shown in more detail in Figures 2.5a
-
2.5e. From Figure 2.5a it can be seen that, nationally, there was a steady decrease in provision in real terms between 1979/80 and 1981/82 contrasting with the steady increase in expenditure: however, in 1982/83 a small real terms increase in provision was made by the Government to allow for # l . . . overspending in 1981-82 (which) means that local authorities will not be able to achieve the previously planned levels . . . l 8 (H M Treasury, 1982, p 24). Notwithstandingthis fconcession' by the Government, expenditure increased
substantially in real terms in 1982/83 so the overspend against provision in 1982/83 was 63% (compared with 44% the previous year).
Figures 2.5b
-
2.5e show trends in London, the Metropolitan and shire areas comparing outturn expenditure with TPP bids and expenditure accepted for TSG. It can be seen that up to 1981/82 the 'overspend' problem (i.e. outturn expenditure relative to accepted expenditure) was attributable mainly to the metropolitan counties (MCCs) where a 59% increase in expenditure contrasted with a 13% decrease in the level of expenditure accepted for TSG, producing an 'overspend' against the latter of 94% (Figures 2 . 5 ~ to 2.5e).
It can be seen that 1981/82 was the year in which revenue support expenditure in the MCCs moved seriously out of line with the Governmentfs plans and this can be related clearly to the changes in political control in these authorities at the May 1981 local
elections. Table 2.1 shows the changes in political control in
counties producing increased demands for subsidies to avoid fares increases.
Table 2.1
Changes in Political Control in May 1981 in the Metropolitan County Councils and Implications for
Revenue Support Expenditure 1981/82
Political Control Revenue Support
Expenditure
1980 1981 1981/82
Party ~ajorit~' Party Majority1 Outturn %
Factor Factor Original
Budget
Greater Manchester Con 3.08 Lab 2.79
+
32.7Merseyside con 2.09 Lab 1.25
+
37.2South yorkshire Lab 1.63 Lab 4.56
+
6.4Tyne and Wear Lab 1.04 Lab 2.25
-
2.0West Midlands con 3.16 Lab 2.47
+
84.0West yorkshire con 1.51 Lab 2.52
+
48.5Note- 'Majority Factor' = Seats of maioritv ~ a r t v
-*
Total of other seats
Source: CIPFA Finance and General Statistics 1981/82; Highways
and Transportation Statistics 1981/82; Municipal Yearbook
1982.
The degree of overspend in the MCCs decreased in 1982/83 as the rate of growth in expenditure moderated and was more than offset
by the increase in 'accepted expenditure1 of 16%. This latter
increase can be related to the substantial increase in the TPP bid for revenue support by the MCCs in 1982/83, this being the first bid by the authorities following the political changes in May 1981.
The bids for 1981/82 by the previous administrations had been
reduced in line with the new Conservative Government's guidance
for TPP preparation which had indicated that the spending provision in the Public Expenditure White Paper should be taken as the basis for authorities1 bids (Department of Transport,
1980, para 2). Nationally, the sum of revenue support bids
exceeded provision by only 6.6% and in the MCCs 86% of the bid was accepted for TSG. However, following the change in political control in the MCCs there was clearly less inclination to conform to the Governmentls guidance for 1982/83 TPP preparation (again exhorting authorities to conform to the PEWP provisions) in the face of deteriorating trends in public transport patronage and the 1982/83 bids from these authorities were, in total, 57% up from 1981/82, compared with the 7.6% real terms increase in provision.
Labour in May 1981, expenditure actually fell in real terms in
1981/82. However, the effect of the cheap fares policy pursued
by the new Labour Council is reflected in the 1982/83 outturn which was 81% in excess of the 'accepted expendituref for that
year. The substantial increase in the TPP bid in respect of
revenue support came in 1983/84 one year later than in the MCCs, and in contradiction to increasingly specific guidance from the Government in respect of TPP preparation referring to the need to
"...
contain revenue support to public transport ...l1 andindicating the Governmentfs unwillingness to accept It... proposals for subsidies intended to implement generalised low
fares p o l i c i e ~ . ~ ~ (Department of Transport, 1982, paras 3,lO).
In contrast to the large urban areas, the picture in the shire areas is one of underspending on revenue support, although between 1980/81 and 1982/83 the degree of underspend against ,accepted expendituref decreased significantly as increasing actual expenditure caught up with a relatively static 'accepted expenditurer. As in the MCCs, a significant increase in the TPP bids from the shire counties occurred in 1982/83 which, again, can be related to the impact of the economic recession on bus patronage.
As regards road maintenance (and safety), as indicated above, a modest overspend against provision nationally (5.7%) by 1982/83 was primarily due to a decrease in provision, particularly in
1981/82 (Figures 2.2
-
2.3). This trend is shown more clearly in Figures 2.6a-
2.6d. In 1981/82 London and the metropolitan areas suffered a real terms decrease in accepted expenditure of15% and 13% respectively; in the shire areas it was 9.3%. These
decreases followed reduced bids in 1981/82 in line with the
Government's guidance for TPP preparation which reflected their
broader concern to achieve reductions in public expenditure. Therefore, in 1981/82 there was a sizeable overspend against accepted expenditure compared to an underspend the previous year. Provision was increased by the Government in 1982/83 (as in the case of revenue support) in recognition of authoritiesf inability to meet the previously planned level, and this reduced the degree of ovespending. In London and the metropolitan areas the degree of overspend on maintenance was much lower than for revenue
support and the marginal increase in real terms in the MCCs
bids for road maintenance in 1982/83 (+ 1%) contrasts markedly with the 57% increase in the bid for revenue support, indicating a greater preparedness to conform to Government policy in respect of road maintenance expenditure (Figures 2 . 5 ~ and 2.6~). In the shire areas the overspend on maintenance in 1982/83 contrasts with the underspend on revenue support (relative to 'accepted expendituref) indicating the difference in the perceived needs and priorities in these areas compared with the large urban centres.
Therefore, the period 1979/80 to 1982/83 presents a picture of
local authorities increasingly out of step with central
government policies and provisions in respect of current
conflict with the Government after 1981. In the transport field, public transport revenue support was the main source of conflict and overspending as councils in the large urban centres adopted 'cheap faresf policies in response to declining patronage trends due to the economic recession. Following the legal challenge by Bromley Borough Council to the GLCfs cheap fares policy in 1982, the resulting Lordsf ruling against the GLC, and subsequent
similar challenges to the policies of West Midlands and
Merseyside County Councils, the Government passed the 1983
Transport Act which established 'Protected Expenditure Levelsf
for revenue support in the metropolitan areas (cf. Sanderson, 1988, p 39-43). The purpose of this legislation was explicitly '
l . .
. to restrain expenditure on public transport revenue support
in the metropolitan areas."
(H
M Treasury, 1983, p 30). This legislation, and the broader operation of the Government'scontrol system for current expenditure (particularly, the
increasingly severe regime of grant penalties) provides the context for examining trends in transport expenditure during the second distinctive period, from 1982/83 to 1984/85.
2.2.2 Trends Between 1982/83 and 1984/85
During this period the real terms increase in expenditure, which had taken place up to 1982/83, was effectively halted; local transport current expenditure remained relatively constant in real terms up to 1984/85, as did the level of the Government's total provision and, consequently, the degree of overspending,
which varied between 23% and 26% over this period. Therefore,
the period is one of continuing substantial disjunction between the Government's policies and provisions and local authoritiesf behaviour (Figs 2.1
-
2.3).However, the trends in respect of the two major current
expenditure programmes over this period (i.e. revenue support and
road maintenance) show significant differences. As regards
public transport support (Figure 2.5a), expenditure increased
only slightly in real terms, a marked reduction in the rate of
increase from previous years. The Government's provision was
decreased in 1983/84 by 10% in real terms reflecting the concern to achieve a reduction in expenditure: as a result the degree of
overspend increased in 1983/84 to 82%. This level of
overspending against provision was sustained in 1984/85 as a small real terms increase in provision matched the increase in expenditure (cf. Figure 2.3).
It is notable that the Governmentfs provision for revenue support actually increased in 1984/85 at a time when it was concerned to
effect a substantial reduction in expenditure. Figure 2.5a also
shows that there was a significant increase in the level of expenditure accepted for TSG in 1983/84. There are two relevant factors here. First, it can be seen that TPP bids for revenue support increased substantially in 1983/84, primarily due to a 148% increase in the GLC bid (Figure 2.5b). The GLC achieved a 22% real increase in its revenue support 'accepted expenditure' in 1983/84 in spite of the Governmentfs view that its expenditure was far in excess of desirable levels. However, perhaps of more
relevance was the introduction, in 1983/84, of Protected
significantly in excess of specific provision for these areas. The Government's view of the relationship between the PELS, the level of provision in spending plans, and accepted expenditure for TSG was stated as follows:
~lLegislation has now been introduced to restrain expenditure on public transport revenue support in the metropolitan
areas. But past failure to tailor services to demand,
inefficiency in operation and in some cases too low fares means that it will not be practicable to bring revenue support to the Passenger Transport Executives and London Transport in line with the Governmentts plans immediately. The levels of expenditure which it is proposed to protect from legal challenge under the new legislation will reflect the difficulties of adjusting rapidly to more balanced policies and may therefore exceed the specific provision for 1983-84 by about £135 million
....
The Government is not, however, prepared to grant-aid the protected expenditure levelsin
full, and the revenue support expenditure for the metropolitan areas accepted for Transport Supplementary Grant will be less than the total of the provisional protected expenditure levels under the legislation."(H M Treasury, 1983, p 30)
However, in view of the fact that In... PELs are not intended as guidelines but maxima ...lt (H M Treasury, 1984, p 45) it is difficult to see the Government's logic in providing TSG support for levels of expenditure on revenue support in excess of the provision made in the spending plans when it is this provision which represented the Government's view of the desirable level of
expenditure. Thus, in 1983/84 expenditure accepted for TSG
support exceeded provision by 26%, although this excess was reduced to 12% in 1984/85. As indicated earlier, the GLC would appear to have been the main beneficiary in terms of increased accepted expenditure (Figure 2.5b) and through an increase in TSG
of 7% (compared with a national decrease of 5%). Thus, in
1983/84 the proportion of total TSG allocated to London and the
metropolitan areas was 71% compared to 65.6% in 1982/83. It
would appear that this could have helped to sustain high levels of spending on revenue support since in 1983/84, there was only a small overspend on road maintenance and an underspend on roads capital expenditure (see Section 2.4).
In 1984/85 provision for revenue support was increased slightly in real terms
(+
1.4%) whereas PELs and accepted expenditure decreased, the latter being particularly marked in London and the metropolitan areas (- 14%). which also, therefore, suffered a significant loss of TSG (- 26%). (This is also related to adecrease in capital accepted expenditure in London. )
in the metropolitan counties) there remains a substantial
question mark over the effectiveness of PELs. In particular,
they would appear to have contributed to a higher degree of TSG support being given to the GLC and NCCs than may otherwise have been the case at a time when these authorities were overspending substantially on revenue support (this will be discussed further in Section 2.4 below).
The trend in road maintenance expenditure relative to provision over the period 1982/83 to 1984/85 presents a somewhat different
picture. Nationally, a modest overspend in 1982/83 had been
virtually eliminated by 1984/85 as expenditure declined by some
3% in real terms while provision increased by a similar
proportion (Figures 2.1
-
2.3). The disrepancies betweenexpenditure and the Government's plans over this period were
substantially less than in the case of revenue support. Figure
2.2 indicates that a significant increase in provisio
y
was made in 1982/83 for road maintenance (+ 4.5% in real terms ) , as it was for revenue support, In... because overspending in 1981-82 means that local authorities will not be able to achieve the previously planned levels ...l1 (H M Treasury, 1982, p 24).The degree of overspend in 1982/83 (6%) was therefore reduced from the previous year. Figures 2.6a
-
2.6d indicate that most of the overspend relative to expenditure accepted for TSG (which is roughly equivalent to provision) was accounted for by the shire areas but the largest proportional overspend (14%) was in London.In setting the provision for the next two years, the Government's main concern was to reduce ovespending. For example, in the 1983 Public Expenditure White Paper it is argued that:
I1Responsible pay settlements, increased efficiency and the
avoidance of waste should enable local government to
maintain satisfactory levels of road maintenance and other services which they themselves provide without having to overspend the provision.I1
(H M Treasury, 1983, p 30)
In 1983/84 national provision was increased marginally in real terms but the GLC and the metropolitan counties suffered a
decrease in 'accepted expendituret while the shire counties
received a slight increase (Figures 2.6a
-
2.6d). This contrasts interestingly with the picture for revenue support (above p. 9)where the GLC and the metropolitan counties received a
significant increase in accepted expenditure in 1983/84,
resulting in an increase in their share of TSG. It is rather
difficult to see how this situation fits in with the Government's
objectives: London and the metropolitan areas benefitted in
terms of TSG support in respect of revenue support expenditure siqnificantly at odds with the Governmentrs policies and lost
l Road maintenance and lighting cost figures have been
(marginally) in respect of road maintenance expenditure whi.ch was only slightly in excess of the Government's provision; on the other hand, the shire areas suffered a decrease in TSG support in spite of an increase in accepted expenditure for both revenue support and maintenance and in spite of being much closer to the Government's plans in their expenditure behaviour.
Therefore, in 1983/84 expenditure on road maintenance in London and the metropolitan areas actually increased in real terms taking them further out of line with the Government's plans while in the shire areas expenditure decreased (in spite of the increase in accepted expenditure) bringing them broadly into line with the Government's plans. However, the real terms decline in expenditure in the shire areas continued into 1984/85 and, because accepted expenditure was increased slightly, resulted in
an underspend, notwithstanding an increase in TSG support. A
decline in expenditure in the metropolitan areas also produced an
underspend against 'accepted expenditure1. In contrast
expenditure continued to increase in real terms in London in 1984/85 increasing the overspend against ,accepted expendituref to 38% (Figures 2.6b
-
2.6d).
Therefore, over the period 1982/83 to 1984/85, although
nationally the total of transport current expenditure remained relatively constant in real terms, there were changes in its composition and distribution between local authority classes. Taking revenue support and road maintenance expenditure (over three quarters of the total during this period) two main trends are in evidence. First, revenue support expenditure increased its share of the total from 37.8% to 39.4% which contrasts with
its share of provision which fell from 29.4% to 27%. Second,
expenditure on both maintenance and revenue support increased in London by some 15% and decreased in both the metropolitan areas
( - 4%) and the shire areas ( - 6%). This contrasts with the trend in accepted expenditure which decreased in London by 5%, remained relatively constant in the metropolitan areas and increased by about 6% in the shire areas. Therefore, over this period it is clearly London which is mostly out of line with Government policies for current expenditure, being 75% overspent against accepted expenditure by 1984/85, mainly due to revenue support. Despite reducing their current expenditure in real terms, the metropolitan areas were still 28% overspent against accepted
expenditure in 1984/85, wholly due to revenue support. In
contrast the shire areas were experiencing a problem of being increasingly underspent against accepted expenditure (7% in 1984/85) as spending declined in real terns in spite of an increase in accepted expenditure.
As indicated earlier it is necessary to refer to the operation of both the TSG system and the wider block grant system (with the additional system of targets and penalties) in attempting to explain these trends in current expenditure. Since TSG covered both current and capital expenditure over this period it will be appropriate to leave its consideration until after the analysis of trends in capital expenditure. In the next section we shall look briefly at the impact of the block grant system, targets and penalties.
2.2.3 Block Grant. Taraets and Penalties
Since the introduction of the block grant system in 1981/82 the Governmentls attempts to restrain local authoritiesf expenditure have resulted in a declining contribution of Aggregate Exchequer
Grant to total relevant expenditure. Figure 2.7 shows this
declining contribution, down from 59% in 1981/82 to 50% in
1984/85. Moreover, the decline in the contribution of block
grant to total expenditure was even more marked over the same period (45% down to 35%) as the amount of AEG earmarked for specific and supplementary grants increased (by 30%).
This decline in the level of support provided by central government to local authority expenditure placed authorities under increasing pressure to restrain expenditure given that their only alternative was to increase their rate poundages. The trend shown in Figure 2.7 is accounted for by two main factors. First, the original determination of AEG and block grant each year by the Secretary of State for the Environment, and published in the Rate Support Grant Main Reports, declined over the period to 1984/85; thus, block grant provision was reduced by some 12%. Second, up to 1985/86 authorities whose expenditure exceeded their targets suffered grant penalties but the block grant withheld from these authorities was not re-cycled under the 'close-ending1 arrangements resulting in a reduction in the total
block grant paid. Thus, the reduction in the 1983/84 block grant
between the original determination (in 1982) and the latest Supplementary Rate Support Grant Report1 (1988) is 4%; the equivalent figure in respect of 1984/85 is 2%.
The prospect of block grant abatement due to the operation of the system of targets and penalties was an important factor in local authorities1 spending decisions over the period 1982/83 to 1984/85 and, as indicated in the previous section, is a relevant consideration in explaining trends in local transport current
expenditure. During this period grant penalties became
increasi gly severe on authorities overspending their expenditure targets.' For example, an authority spending 6% over target in 1982/83 suffered a loss of grant equivalent to 15 pence in the pound at ratepayer level; by 1984/85 the penalty for the same degree of overspending had increased to 41p.
Targets did not bear a simple relationship to grant-related expenditures (GREs). Whereas the latter represents a level of expenditure which the Government considers is lobjectively' required for an authority to provide an 'appropriate1 level of
service, targets expressed a more pragmatic view of what
authorities could realistically achieve in the light of their past spending behaviour. Therefore, the main criteria in setting targets in any one year tended to be specified relationships either to previous years1 budgets or to the previous year1s target (Smith and Stewart, 1985). Overall, targets were related
to the Government's provision for total local authority
expenditure, differing from GREs primarily in respect of a
proportion of the provision not allocated to services and,
therefore, not appearing in GREs.
...
l The system is explained in more detail in Sanderson (1988, p
The discrepancy between targets and GREs, and the fact that the system of targets and penalties 'cut across' the logic of the basic block grant system, constituted a basis for considerable criticism (for example, from the Audit Commission, 1984) which eventually led to their abandonment by the Government in the financial year 1986/87. In 1982/83, in fact, any authority with an initial target below its GRE was allowed to use the latter as its effective target and this protected from penalty several low- spending authorities. However, in 1983/84 this 'GRE exemption1 was discontinued and as Smith and Stewart commented (op cit, p. 26-7):
"This brought loud protest from low-spending, predominantly Conservative-controlled councils, many of which would now be penalised for spending above target, even though they were spending below GRE, the Governmentls own assessment of their standard level of expenditure."
In 1984/85 the system was made markedly more severe both in terms of the relationship of the targets set to the previous year1s targets and budgets and in terms of the grant penalties imposed
(ibid. p 27-8).
It is possible to make a general assessment at this stage of the impact of targets and penalties on transport current expenditure in the different local authority classes between 1982/83 and
1984/85. Figure 2.8 shows the relationships between targets and
total GREs for the GLC, the metropolitan counties and the shire
counties. It can be seen that in 1982/83 the metropolitan were
given targets significantly in excess of GRE while in the GLC and shire counties the 'GRE exemption1 applied on the whole with targets equal to GREs. However, in 1983/84 while the GLC and the metropolitan counties received an increase in their targets in excess of the increase in their GREs, the shire counties collectively found their targets to be below GRE due to the ending of the 'GRE exemptionp. For many shire counties the targets in 1983/84 represented a 4% increase on 1982/83 budgets, where those budgets had been within 1% of target, and several
authorities now found these targets to be below their GREs. On
the other hand, the high spending metropolitan authorities were allowed targets 1% below their 1982/83 budgets, whatever the relationship of those to the targets, resulting in a real terms increase in their targets of 7% (compared to a decrease for the shire counties of 1.3%) (Smith and Stewart, 1985).
The substantial increase in targets for the GLC and metropolitan authorities in 1983/84 (which reduced the incidence of penalties for a given level of spending) can be seen as a factor serving to sustain the continued high level of overspending, particularly on
public transport revenue support, in these authorities.
Moreover, it may have served to reinforce the effect of an increase in TSG to the GLC in that year which in turn may have been a factor in promoting real terms growth in revenue support
in excess of the Government's spending plans. Conversely, the
real terms reduction in targets for the shire counties and the prospects of penalties on expenditure below GRE for many of these authorities is likely to have been a factor in the reduction of
transport current expenditure, particularly on -highway
reduction in TSG support and pressing needs across a range of
services (e.g. education, social services, police and fire). It
is noteworthy, therefore, that whereas current expenditure on revenue support and maintenance declined by 4% in real terms between 1982/83 and 1983/84 in the shire counties, spending on social services increased by 2.7%, police by 4.5%, fire services by 2%, while education spending decreased by less than 1%. The
average for all services was a 0.1% decrease (Department of
Environment 1983-1988).
As indicated above the target and penalty regime was made more severe in 1984/85 with all authorities experiencing a real terms decrease in their targets. The GLC8s target was reduced by 5% in real terms, the MCCs by nearly 3% and the shire counties by some 2% (Figure 2.8). Nevertheless, the targets still allowed the GM: and MCCs to spend well in excess of GRE before incurring penalties while for the shire counties, the collective target was now 3% below GRE (CIPFA Finance and General Statistics 1983/84 and 1984/85). There is little evidence of a moderating influence on the GLC which budgeted to spend 67% in excess of target in 1984/85 (compared with 53% in 1983/84) and we have seen that current expenditure on revenue support and highway maintenance
continued to increase in spite of a reduction in TSG. The
metropolitan counties do display some evidence of a moderating impact with the excess of budgeted expenditure over target down from 6.2% in 1983/84 to 5% in 1984/85 and the excess over GFtE down from 27% to 18% (CIPFA Finance and General Statistics op
cit). We have also seen that current expenditure on revenue
support and maintenance continued to decrease in real terms in 1984/85 in the MCCs.
As regards the shire counties expenditure on road maintenance and revenue support continued to decline in real terms in 1984/85 notwithstanding the relatively favourable treatment of these
authorities in that year's TSG settlement. This trend would
appear to be amenable to explanation more in terms of the block grant and penalty system than the TSG system because of the relatively low proportion of total accepted expenditure in the shires supported by TSG up to 1984/85 (see below Section 2.4). In fact it would appear that the more stringent target and penalty system operative in 1984/85 more than offset a more generous TSG settlement. Because their collective target was reduced in real terms to 3% below GFtE, the shire counties faced harsher penalties for a lower 'overspend8 in relation to target. Thus, although the excess of their budgets over target was reduced from 1.6% in 1983/84 to 1.4% in 1984/85 the estimated penalty on these budgets increased by some 80% in real terms, and some shire authorities faced significant penalties even though
their budgets were below GRE. For example, Staffordshire
budgeted to spend 0.6% less than their GRE but faced an estimated
penalty of some 7% of their 'pre-abatement' block grant
entitlement (CIPFA Finance and General Statistics op cit). As in 1983/84, outturn expenditures indicate that revenue support and road maintenance received rather lower priority than other major
services. Thus, the reduction of some 2% in real terms in
Therefore, it would appear that current expenditure restraints through the block grant system and targets and penalties were an important factor between 1982/83 and 1984/85, particularly in the shire counties which experienced the harshest targets relative to
GRE. Of course, authorities were free to determine their own
priorities within constrained budgets so the fact that transport current expenditure decreased in the shire counties in real terms more than other services (and while expenditure on some other services decreased) is not attributable directly to the system of expenditure restraints but rather upon authorities' reactions to
it. The problem was one of the priority accorded to local
transport expenditure relative to expenditure on other services such as education, social services, poliae and fire. The lower
proportion of transport expenditure in the shire counties
supported by TSG than in-the GLC and MCCs meant that the influence of targets and penalties would have been felt more by the shire authorities and changes in TSG support would have less influence on expenditure behaviour. However, before looking more specifically at the role of TSG we will examine trends in capital expenditure and provision up to 1984/85.
The trend in English local authorities transport capital
expenditure relative to the Government's planned provision
between 1981/82 and 1984/85 is shown in Figures 2.9a
-
2.9~. The level of spending in 1981/82 in fact represents a significant reduction from 1980/81-
14% in real terms for local transport as a whole-
associated with the introduction of the new capital expenditure control system.The relative reduction of highways and public transport capital expenditure in 1981/82 is illustrated in Figures 2.11a
-
2.11f. In England as a whole (Figure 2.11a) highways expenditure wasreduced by some 13% in real terms and public transport
expenditure by 10%. However, as Figure 2.11~ shows, the
reduction in public transport spending was concentrated in the
metropolitan counties where the main programmes were the
construction of the Tyne and Wear Metro and investment in PTE bus
systems. The reduction in highways-related capital investment
was concentrated in the shire areas (Figures 2.11d and 2.11f).
Therefore, in 1981/82 local authorities underspend the
Government's provision for transport capital expenditure by a
significant margin (c. 11%), with both the roads and public
transport components below provision (Figure 2.9~). However,
despite being underspent against provision, total transport capital expenditure was close to the total allocation, which was set some 12% below provision to allow for an assumed use of capital receipts (principally from the disposal of land and
assets) to supplement the allocation (Figure 2.10)
.
Thisindicates that local authorities were not able to apply capital receipts to transport expenditure to the extent assumed by the
Government. This contrasts with the picture in respect of, for
example, education and environmental services (such as leisure
and recreation ) which were overspent against provision
Between 1981/82 and 1984/85 transport capital expenditure increased steadily in real terms although at a diminishing rate, (as Figures 2.9a and 2.11a show), the total increase over the
period being some 17%. On the other hand, provision for
transport actually decreased in real terms by 2% so by 1984/85
the previous underspending had been transformed into a 6%
overspend against total provision (Figure 2.9~). However, the
overspend was attributable to public transport (18% above
provision) and car parks (345% in excess of provision),
expenditure on these programmes having increased in real terms in
spite of reductions in provision by the Government. This
contrasts with the roads capital programme which was subject to persistent underspending up to 1984/85 as the increase in expenditure failed to match the increase in provision (Figures 2.9a
-
2.9~).Looking in more detail at public transport, Figures 2.11a to
2.11d show that the picture was dominated over the period up to
1984/85 by London (GLC) which accounted for 80% of total national capital expenditure by local authorities on public transport in 1984/85, most of the remainder being accounted for by the metropolitan counties (Figures 2.11b and 2.11~). It is clear that the GLC and metropolitan counties assigned a higher degree of priority to investment in their public transport systems, particularly in 1983/84 and 1984/85, than was accorded by the Government, producing the overspending shown in Figure 2.9~. The large real terms increase in expenditure in London in 1983/84 is of interest (Figure 2.11b) since in that year the GLC experienced a relatively favourable TSG settlement, indicating that some priority may have been given to TSG-supported public transport schemes (this is discussed further in the next section).
As regards local authoritiesf roads capital programmes,
underspending by local authorities during the period to 1984/85 was a source of concern to the Government. Indeed, together with the contrasting overspending on current expenditure (particularly revenue support, as discussed in Section 2.2 above), it was a major factor in the Government's reasoning behind the reform of the TSG system, restricting support from 1985/86 to capital expenditure on roads 'of more than local importancef (see next section). The degree of underspending in 1983/84 and 1984/85 (7% and 6% respectively) was, however, not of major proportions given
the size of the total programme. Moreover, the discrepancy
between expenditure and provision illustrated in Figure 2.9~ is not a true reflection of the extent to which actual output of local roads matched the output implied in the provision due to discrepancies between outturn road construction prices in any one year and the prices assumed by the Government when setting provision. The constant prices used in Figures 2.9a and 2.9b are based on the GDP deflator and this probably understates the change in output because between 1982 and 1985 (first quarters) the roads output price index increased by only 3.5% compared with an increase of 16% in the GDP deflator (H M Treasury, 1987, p
135). This does not affect the comparison between outturn and
In explaining the trend of local transport capital expenditure relative to the Government's plans we can refer to the operation of both the TSG system, which supported such expenditure on highways-related and public transport programmes, and the wider capital expenditure control system. The TSG system will be considered in more detail in the next section but at this stage we can look briefly at the trends in local authorities1 TPP bids
in respect of capital expenditure and these are shown in Figures
2.12a to 2.12d. It can be seen that, following a significant
real-terms reduction in bids in 1982/83 (cf. difficulties with the new capital control system and run-down of construction on the Tyne and Wear Metro), there was a subsequent substantial increase up to 1984/85 in bids by the GLC, the metropolitan counties and the shire counties. However, the proportion of bids accepted for TSG declined nationally, from 83% to 68% indicating a reduction in the extent to which the Governmentls provision met
the perceived expenditure needs of local authorities. This
decline was particularly marked in the GLC (85% down to 66%) and,
to a lesser extent, the metropolitan counties (66% down to 53%)
reflecting the greater importance of public transport expenditure in the capital programmes of these authorities and the declining provision made by the Government for such expenditure (Figures
2.12b and 2.12~). In the shire counties the proportion of the
capital bid accepted for TSG declined from 86% in 1982/83 to 77% in 1984/85. This represented a significant real terms increase in accepted expenditure in the shires (some 21%) probably reflecting the Government's priority over this period to roads capital expenditure on by-pass schemes designed to provide relief
to towns and villages from the effects of lorry traffic. This
priority was expressed in guidance, in particular, in the circular relating to 1983/84 TPP submissions which indicated that TSG support would be given to such schemes (Department of Transport, 1982, para 4).
Notwithstanding this priority on the part of the Government, the evidence suggests that the shire counties in particular were experiencing difficulties with roads programmes. Thus, between 1983/84 and 1984/85 expenditure increased by some 6% in cash terms compared with a 13% increase in accepted expenditure (total capital) and a 12% increase in the roads capital allocation (DTp data). In 1984/85 expenditure on roads by the shire counties was 9% below the capital allocation. There are two aspects of the
broader systems for controlling local authorities' expenditure
which are relevant to this problem. First, we have seen in section 2.2 above that the shire counties faced some difficulty with restraints on current expenditure, particularly through the system of expenditure targets and penalties because in 1983/84 and 1984/85 these authorities collectively faced targets below GRE. This, in turn, would have resulted in restraints on capital expenditure in order to restrict the burden of debt charges on revenue accounts. The second aspect relates to the operation of the capital expenditure control system and we shall now consider this in more detail.
As indicated above, in the new capital control system introduced in 1981/82, capital allocations provided to authorities to cover prescribed expenditure were generally set below provision to
allow for the use of capi*al receipts. Figure 2.10 shovs that
to 1984/85 consistently exceeded the allocation but, yp to
1983/84 failed to reach the level of provision. This indicates
that authorities were unable to use capital receipts to
supplement transport expenditure on the scale assumed by the
Government. However, the increasing availability of capital
receipts to authorities over this period is reflected in the closing gap between expenditure and provision and the emergence of an overspend in 1984/85 (cf. Figure 2.9~). Nevertheless, as we have seen, this overspend was attributable to public transport and car parks suggesting that receipts were supporting such expenditure more than that on road construction and improvement.
Indeed, local authorities' ability to supplement allocations from receipts was causing a substantial overspending problem in respect of total capital expenditure which contrasted with the
underspending on roads programmes. By 1983/84 authorities were
overspending by 16.5% on total expenditure compared with the 7%
underspend on roads capital expenditure. In particular,
education capital expenditure was 54% in excess of provision in 1983/84 indicating a priority in the use of capital receipts to
this service. This general overspending problem caused the
Government to react by limiting the use of capital receipts by
authorities in any one year to 'prescribed proportions' of
income. In 1983/84 the 'prescribed proportion' for non-housing receipts was 50% but this has subsequently been reduced to 30%. However, this reaction to the general problem clearly did not help the specific problem of underspending on roads and in order to encourage authorities to increase their expenditure in this
respect, the Government took the compensating step of
supplementing transport capital allocations for 1983/84 and 1984/85 by 50% of forecast local transport capital receipts. This would permit additional spending financed by borrowing if such receipts were not in fact available.
Nevertheless, the persistence of underspending on roads and the failure of the shire counties in particular to spend up to allocations indicates the dual influence of restraints on current
expenditure (via debt charges) and an inability (or
unwillingness) of authorities to apply capital receipts to roads
capital expenditure. As regards the latter problem, a
substantial part of the difficulty arose from the distribution of expenditure and receipts between different authorities. This is illustrated in Figures 2.13a to 2.13d. The increasing use of capital receipts to supplement capital allocations in respect of prescribed expenditure is clearly evident, particularly over the period 1982/83 to 1984/85. However, it can be seen that the authorities generating and applying the largest amounts of receipts were precisely those with the least transport capital
expenditure responsibilities, with the exception of the GLC.
Thus, it was the lower tier authorities (London Boroughs, metropolitan and shire districts) which had the most receipts available but these were therefore applicable to a very limited part of the total transport programme mainly, in fact, car parking (explaining the substantial overspend on this item by
1984/85). The GLC was also able to generate substantial receipts