www.ej.eng.chula.ac.th ENGINEERING JOURNAL : VOLUME 14 ISSUE 3 ISSN 0125-8281 : ACCEPTANCE DATE, JUL. 2010
15
R
EVIEWS ON
M
ICRO-
G
RID
C
ONFIGURATION AND
D
EDICATED
H
YBRID
S
YSTEM
O
PTIMIZATION
S
OFTWARE
T
OOLS:
A
PPLICATION TO
L
AOS
Sengprasong Phrakonkham
1, 2*, Jean-Yves Le Chenadec
3,
Demba Diallo
1, Ghislain Remy
1and Claude Marchand
11
Laboratoire de Génie Electrique de Paris (LGEP) / SPEE-Labs, CNRS UMR
8507; SUPELEC; Université Pierre et Marie Curie P6; Université Paris-Sud 11;
11 rue Joliot Curie, Plateau de Moulon F91192 Gif sur Yvette CEDEX, France
2
Department of Electrical Engineering, Faculty of Engineering,
National University of Laos, Vientiane 01000, Laos
3
Département de Génie Electrique et Electrotechnique, IUT de Cachan,
Cachan Cedex 94234, Université Paris Sud 11, France
Email : [email protected]*, [email protected]*
[email protected],[email protected],
[email protected]
and [email protected]
ABSTRACT
Connecting the electric grid to rural and remote areas is very uneconomical
to carry out
. Moreover, the utility network is not designed to fulfill the growing
needs of the population and may be destabilized by new consumers.
Therefore, it is more economical to electrify those areas with a micro-grid by
means of existing renewable energy sources available locally. The micro-grid
configuration represents the energy distribution architecture from the
producing sites to consumers and eventually the interconnection between
several sites and several consumers.
The design and study of such a grid
configuration is realized using simulation tools
and has to be considered from
the system level with economical matters in addition to the technical aspects.
As for the optimization of a hybrid/micro-grid system, several software tools
have been developed and designed to simulate and optimize hybrid systems.
In this paper, an analysis of the current status of electrification in Laos is
presented. Then, a literature review of the existing micro-grid configuration is
presented and a case study of a typical rural, remote and isolated village in
Laos is simulated, using some of the selected software tools.
KEYWORDS
energy
excess, hybrid systems, micro-grid, multi-objective optimization,
16 ENGINEERING JOURNAL : VOLUME 14 ISSUE 3 ISSN 0125-8281 : ACCEPTANCE DATE, JUL. 2010 www.ej.eng.chula.ac.th
I . Introduction
Autonomous off-grid rural electrification based on the on-site production of renewable energy has been proven to be capable of delivering a degree of quality and reliable electricity for powering rural villages, i.e. lighting, cooking, communication etc. In [1] it is reported that off-grid renewable energy technologies satisfy energy demand directly and avoid the need for long and expensive distribution infrastructures.
Combinations of different but complementary energy generation systems based on renewable or mixed energy (renewable energy with a backup bio-fuel/diesel generator) are known as a renewable energy hybrid system. The grid formed by this system is known as a micro-grid due to its size compared to the main grid. According to energy conversion technologies, different micro-grid configurations have been studied, developed and implemented worldwide to meet the energy demands of off-grid modern societies.
When designing a hybrid system for the production of electrical energy, various aspects have to be considered, such as cost and environmental impact (CO2 emission). Availability and reliability will be, however, among the key issues. Therefore, the design of the micro-grid is a multi-objective problem. It is reported in [2] that multi-objective design methods have been applied successfully in several fields of engineering with several mathematical techniques. The study results will then be used as part of the decision-making process for investing.
In this paper, firstly, the status and development of electrification as well as the available renewable energy sources in Laos are presented in the second section. In the third section, the review of research on different micro-grid configurations is summarized, concluding with the current implementation in Laos. In the fourth section, a short review of existing simulation tools is presented. Then, a case study, with respect to economic optimization for a selected Northern Lao village, is performed using two different simulation software tools. The optimization results are then compared, regarding the unmet load and the unused energy excess Furthermore, the need to optimize excess energy as a part of the optimization criteria and the demand of more flexible software tools, with respect to the sizing and optimizing of grid components, are raised and discussed. Finally, the unavoidable needs of micro-grids for the development of rural electrification in Laos are highlighted.
Il. Electrification in Laos
2.1 2006 Status and Development Plan
Of the about 5.5 million inhabitants in Laos, only 54 % can benefit from the national grid to satisfy their daily lives for lighting, cooking, cleaning, entertaining, etc. In the rest of the country, especially in the small villages or communities in the remote and mountainous areas, access to electric energy is practically impossible due to the non-profitability of grid extension.
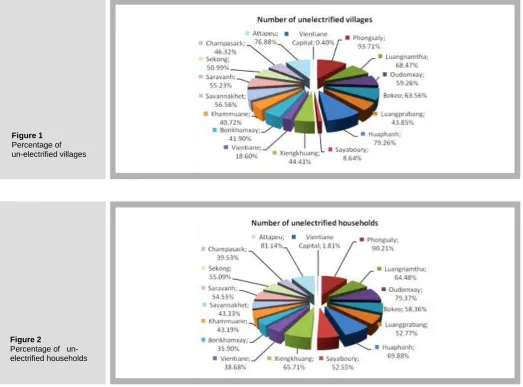
The report in [3] cited that the highest priorities of the Government of the Lao PDR’s (GOL) Socio-economic Development Strategy to 2020 are addressing poverty, improving the living standards of the population, and removing the country from the Least Developed Country (LDC) list through economic growth based on the sustainable use of the country’s natural resource base. The Lao power sector is still in its infancy with more than 45 % of the population with no access to electricity. Extracted from the database in [4], [6], Figure 1 and 2 illustrate the provincial rates of electrification of villages and households respectively throughout the country.
www.ej.eng.chula.ac.th ENGINEERING JOURNAL : VOLUME 14 ISSUE 3 ISSN 0125-8281 : ACCEPTANCE DATE, JUL. 2010
17
Picture , Capture, Image, Table
Figure 2
Percentage of un-electrified households
[image:3.595.38.562.59.446.2]Picture , Capture, Image, Table
Figure 1 Percentage of un-electrified villages 4 0 .3 7 % 4 2 .7 7 % 4 5 .1 9 % 4 7 .5 9 % 5 0 .0 0 % 5 3 .0 0 % 5 6 .0 0 % 5 8 .9 9 % 6 1 .9 9 % 6 4 .9 9 % 6 7 .9 9 % 7 0 .9 9 % 7 3 .9 9 % 7 6 .9 9 % 7 9 .9 9 % 3 6 .8 8 % 3 9 .1 7 % 4 1 .3 7 % 4 3 .5 8 % 4 5 .7 8 % 4 8 .5 3 % 5 1 .2 7 % 5 4 .0 3 % 5 6 .7 7 % 5 9 .5 2 % 6 2 .2 6 % 6 5 .0 1 % 6 7 .7 6 % 7 0 .5 0 % 7 3 .2 5 % 3 .4 9 % 3 .6 1 % 3 .8 1 % 4 .0 1 % 4 .2 2 % 4 .4 7 % 4 .7 2 % 4 .9 7 % 5 .2 2 % 5 .4 8 % 5 .7 3 % 5 .9 8 % 6 .2 4 % 6 .4 9 % 6 .7 5 %
2006 2007 2008 2009 2010 2011 2012 2013 2014 2015 2016 2017 2018 2019 2020
T o b e e le c tr if ie d v ill a g e s Year
Government target EDL target (On grid) Others (Of f grid)
[image:3.595.28.558.572.769.2]Picture , Capture, Image, Table
Figure 3 Forecast of electrified villages (2007-2020)
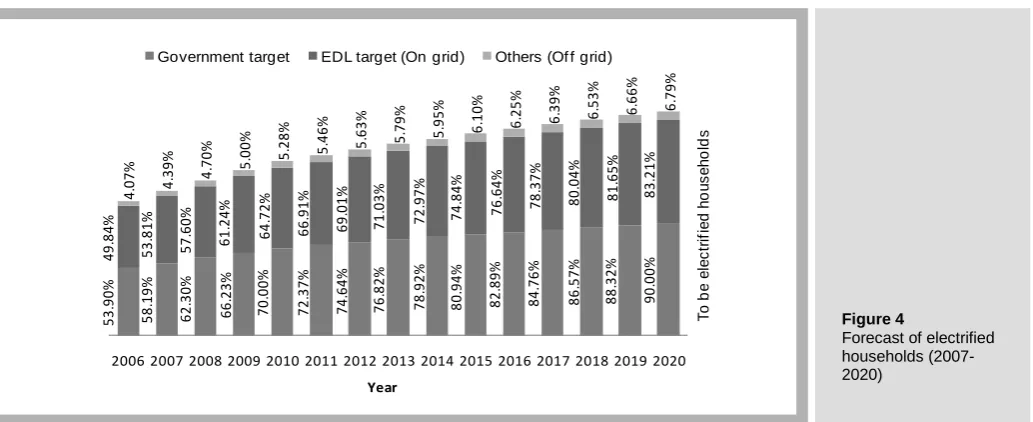
18 ENGINEERING JOURNAL : VOLUME 14 ISSUE 3 ISSN 0125-8281 : ACCEPTANCE DATE, JUL. 2010 www.ej.eng.chula.ac.th 5 3 .9 0 % 5 8 .1 9 % 6 2 .3 0 % 6 6 .2 3 % 7 0 .0 0 % 7 2 .3 7 % 7 4 .6 4 % 7 6 .8 2 % 7 8 .9 2 % 8 0 .9 4 % 8 2 .8 9 % 8 4 .7 6 % 8 6 .5 7 % 8 8 .3 2 % 9 0 .0 0 % 4 9 .8 4 % 5 3 .8 1 % 5 7 .6 0 % 6 1 .2 4 % 6 4 .7 2 % 6 6 .9 1 % 6 9 .0 1 % 7 1 .0 3 % 7 2 .9 7 % 7 4 .8 4 % 7 6 .6 4 % 7 8 .3 7 % 8 0 .0 4 % 8 1 .6 5 % 8 3 .2 1 % 4 .0 7 % 4 .3 9 % 4 .7 0 % 5 .0 0 % 5 .2 8 % 5 .4 6 % 5 .6 3 % 5 .7 9 % 5 .9 5 % 6 .1 0 % 6 .2 5 % 6 .3 9 % 6 .5 3 % 6 .6 6 % 6 .7 9 %
2006 2007 2008 2009 2010 2011 2012 2013 2014 2015 2016 2017 2018 2019 2020
T o b e e le c tr if ie d h o u s e h o ld s Year
[image:4.595.45.562.65.276.2]Government target EDL target (On grid) Others (Of f grid)
Figure 4
Forecast of electrified households (2007-2020)
The goal will be achieved through on- and off-grid electrification. The former will be carried out in the form of grid expansion through the existing high, medium and low voltage grids. The latter requires the usage of hybrid renewable systems to produce electricity in rural, remote and isolated communities. The Électricité du Laos Company (EDL) is in charge of on-grid electrification, while off-grid electrification is the responsibility of the Rural Electrification Division. Both agencies are, however, under the supervison of the Department of Electricity, Ministry of Energy and Mines.
Electrification won’t be, however, equally distributed across all provinces and regions. For instance, the 100% village and household electrification rate by 2020 is targeted only to certain provinces e.g. Vientiane Capital, Sayaboury and Vientiane province. Other provinces in northern Laos like Phongsaly, Luangnamtha and Oudomxay won’t be 100 % electrified even by 2035, due to the very low penetration in their rural, remote and isolated areas that typically mark the provincial landscape [6].
2.2 Renewable Energy Sources
2.2.1 Photovoltaic Energy
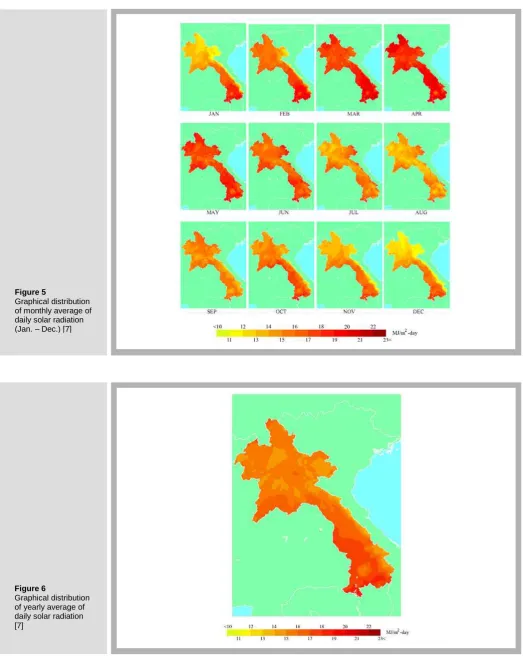
Geographically, Laos is situated between the latitudes of 13° to 22° north and 100° to 108° east, where the availability of sun is around 300 days per year. Research work in [7] used images of three satellites covering Laos, namely GMS 5, GOES 9 and MTSAT, taken during the period from 1995 to 2005 to calculate a monthly and yearly average daily global sun radiation throughout the country. The monthly and yearly
average of daily solar radiation is found to be respectively 16.06 and 15.8 MJ/m2-day
throughout the country. Figure 5 and Figure 6 summarize the geographical distribution of the monthly (January to December) and yearly average daily solar radiation.
We can see that radiation fluctuates seasonally. It is relatively low in the northern and eastern parts of the country during January. The entire country is exposed to the highest radiation during February to June, with April being the highest exposed period. The radiation decreases gradually for the rest of the year. November and December have the lowest radiation. The yearly highest average daily solar radiation of 18-19
MJ/m2-day is recorded in the south of the country. The western part is exposed to
www.ej.eng.chula.ac.th ENGINEERING JOURNAL : VOLUME 14 ISSUE 3 ISSN 0125-8281 : ACCEPTANCE DATE, JUL. 2010
19
[image:5.595.38.562.61.727.2]Picture , Capture, Image, Table
Figure 6
Graphical distribution of yearly average of daily solar radiation [7]
Figure 5
Graphical distribution of monthly average of daily solar radiation (Jan. – Dec.) [7]
[image:5.595.109.561.72.408.2]20 ENGINEERING JOURNAL : VOLUME 14 ISSUE 3 ISSN 0125-8281 : ACCEPTANCE DATE, JUL. 2010 www.ej.eng.chula.ac.th
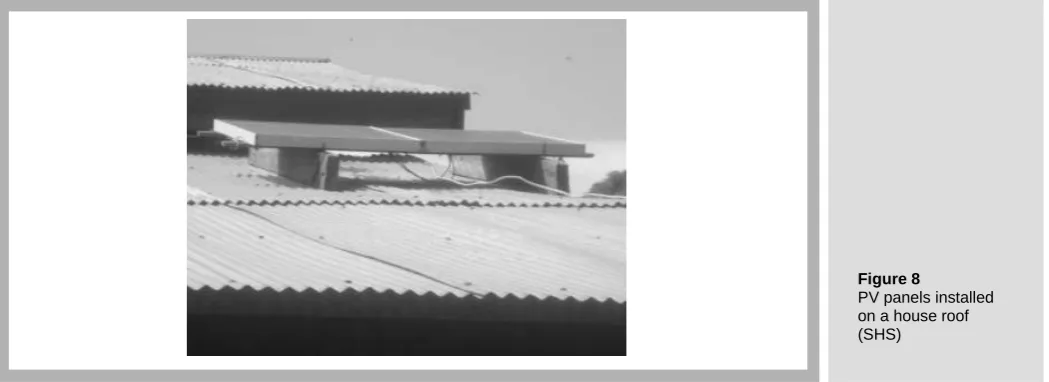
In summary, the average solar radiation in Laos is relatively high. This would give a relatively good possibility and opportunity to engage the photovoltaic (PV) technique and technology as a component of a hybrid renewable energy system, in order to produce clean energy for villages and communities in remote, rural and isolated areas. In fact, PV solar home systems (SHS) as shown in Figure 8 were introduced in Laos in the late 1980s. By now there are more than 14,000, with a total installed capacity of about 300 kW (as of 2006) [4, 5, 8], throughout the country, with a tendency towards increase. These have been implemented in line with the promotion of the use of renewable energy encouraged by the government policy.
2.2.2 Hydroelectric Resources
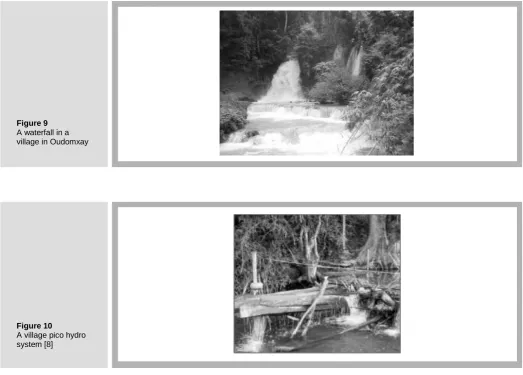
[image:6.595.42.559.41.216.2]As a relatively mountainous country, Laos benefits from massive water resources with different sizes and capacity (Figure 9). Villages and communities in remote areas where an access to a grid is not possible could then benefit from these natural renewable resources, in the forms of mini, micro and pico hydroelectric solutions. The latter is sometimes referred to as village hydro systems, as shown in Figure 10, according to the installed capacity of < 1 MW, < 100 kW and < 1 kW respectively. The first two types are connected to the national utility grid, while the latter has the objective, as the name suggests, to satisfy the needs of individual households, villages or communities. Up to now, their development and implementation in Laos has been merely on the household scale with a unit installed capacity of 100 - 300 W [8], mostly in the hilly areas of the Northern provinces. This is due to the fact that large units require large budgets which unfortunately poor villagers cannot afford.
Figure 7
Statistical distribution of solar radiation over the country area [7]
Figure 8
[image:6.595.37.562.343.534.2]www.ej.eng.chula.ac.th ENGINEERING JOURNAL : VOLUME 14 ISSUE 3 ISSN 0125-8281 : ACCEPTANCE DATE, JUL. 2010
21
Figure 9A waterfall in a village in Oudomxay
It is worth noting that with the help and support from financial institution a village-or community-scale pico hydro could be one of the essential tools for rural electrification in Laos, using renewable energy resources available locally.
2.2.3 Other Natural Resources
Wind speed is relatively weak throughout the country even in Northern Laos along the border with Vietnam. With an average of 1.9 to 2.8 m/s throughout the year (http://eosweb.larc.nasa.gov/), unfortunately, it is too low to be used to produce electrical energy cheaply.
It is estimated that about 92 % of households use wood fuel for cooking. However, the huge quantity of wood used in the long term perspective will lead to deforestation if it is not properly managed. Though being a rice predominant country, Laos has not been by far making use of rice husks as a source of energy. The dispersed distribution and the size of rice mills are one of the limiting factors for the use of husks. Animal and human waste are generally available within rural areas and there would appear to be potential for a larger biogas digester program for cooking, lighting and other purposes within the country. In recent years, driven by the oil price crisis, bio-fuel has become one of the development issues in Laos. Many projects were granted by the government for the plantation of bio-fuel related crops. The main plantation crops include para rubber, eucalyptus, palm tree, kathinnalong, jatropha and sugar cane [8].
The availability and the variety of renewable sources is a great potential for the development and implementation of micro-grids for Lao rural electrification in the near future.
22 ENGINEERING JOURNAL : VOLUME 14 ISSUE 3 ISSN 0125-8281 : ACCEPTANCE DATE, JUL. 2010 www.ej.eng.chula.ac.th Figure 11
Micro-grid architecture [20]
Picture , Capture, Image, Table
III. Micro-Grid
3.1 Definition and Concept
There are several different definitions of micro-grid as many as there are research projects about it [12]-[27]. In summary, however, a micro-grid can be seen as a semi-independent grouping of generating sources and controllable end-use loads. The supply sources may consist of conventional generator sets, micro turbines, fuel cells, photovoltaic (PV), small scale renewable generators, heat recovery from thermal generation, and storage devices [18]. In fact, it is a small scale power supply grid that is designed to provide energy for a small community. The small community may be a house, an isolated rural community, a mixed suburban environment, a commercial area, an industrial site or a municipal region. The key concept that differentiates a micro-grid from a conventional power utility grid is that the power generators are small (often referred to as micro or distributed generators, of a similar size to the loads within the micro-grid), they are usually geographically distributed, and they are located in close proximity to the energy users. The generators and loads are controlled to meet the consumer’s energy demand while achieving a local energy and power balance [19].
Figure 11 represents a micro-grid architecture consisting of a group of radial feeders, which may be part of a distribution system. There is a single point of connection to the utility, called the point of common coupling (PCC). Feeders A, B and C have sensitive loads, which require local generation. The non-critical load feeders do not have any local generation. Feeders A-C can be isolated from the grid using the static switch in less than a cycle.
3.2 Micro-Grid Configurations
Different micro-grid configurations have been presented in several research works [1], [28] - [39]. They are generally, however, grouped into 3 types: DC coupled, AC coupled and AC and DC coupled configurations.
www.ej.eng.chula.ac.th ENGINEERING JOURNAL : VOLUME 14 ISSUE 3 ISSN 0125-8281 : ACCEPTANCE DATE, JUL. 2010
23
Figure 14 [image:9.595.39.558.322.515.2]A modular AC coupled configuration [36] Figure 13 DC coupled configuration [35]
[image:9.595.42.565.611.797.2]Picture , Capture, Image, Table
Figure 12 Solar home system [34]
Picture , Capture, Image, Table
However, if higher power or energy is demanded and cannot be met in a cost-effective manner by the SHS, several generators must be inserted into the system. Additional generators are typically wind, hydro, conventional or bio-diesel generators. In such a system, represented here by Figure 13, all the AC energy sources, such as wind generators and gensets, are converted to DC and coupled to the battery. The power range for a DC coupled configuration is extremely broad and can be used cost-effectively for various off-grid applications.
In general, when systems increase in size, they are implemented as AC coupled hybrid
systems. Using the concept of “modular system technology” [31], DC coupling is
24 ENGINEERING JOURNAL : VOLUME 14 ISSUE 3 ISSN 0125-8281 : ACCEPTANCE DATE, JUL. 2010 www.ej.eng.chula.ac.th Figure 15
An expanded modular AC coupled
configuration [34]
Picture , Capture, Image, Table
Figure 16
AC and DC coupled configuration [31]
Picture , Capture, Image, Table
Depending on the application type and available energy resources, different conventional and renewable energy generators could be added to the system to form a hybrid energy system. Furthermore, this configuration can easily be expanded by integrating further components or generators in order to cover the rising energy demand. Such systems are used to supply all electrical consumers, especially rural villages or communities in developing and threshold countries where electricity, water pumping and water disinfection are basic needs [34]. Various applications are also implemented in Europe e.g. on the isolated island of Kythnos, Greece [37], [39]. Nowadays, the AC coupled technology is commonly used in the power range above several kWs and can be realized in both single and three phase structures.
As mentioned earlier, DC coupling is the natural solution in small systems, but in large systems, AC coupling is advantageous. In the wide range in between, it is also possible to combine AC and DC coupled in one system, namely, an AC and DC coupled configuration. This technology has emerged due to the need to supply (medium power) AC loads by DC
[image:10.595.35.560.611.793.2]www.ej.eng.chula.ac.th ENGINEERING JOURNAL : VOLUME 14 ISSUE 3 ISSN 0125-8281 : ACCEPTANCE DATE, JUL. 2010
25
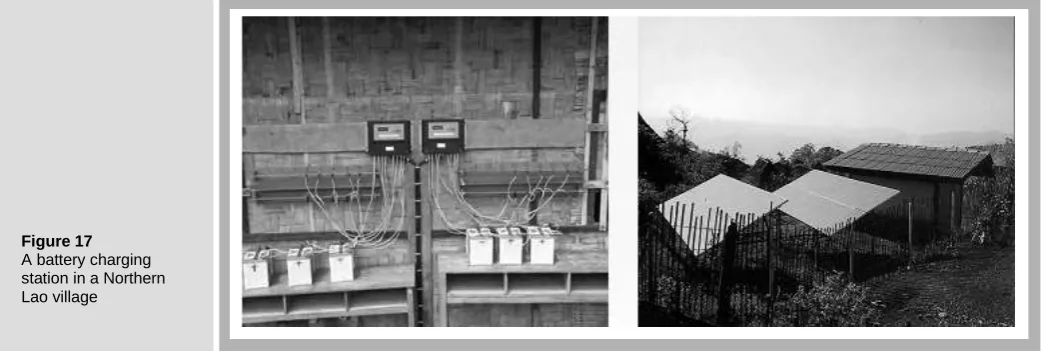
Figure 17A battery charging station in a Northern Lao village
The AC and DC coupled configuration is developed and implemented in the form of a hybrid PV-genset DC/AC bus configuration, mainly in North America [33], [38]. The research in [38] reveals that when compared to the AC and DC bus configuration, it can satisfy AC loads directly (compared to DC system) and has a smaller genset runtime and hence reduced annual energy consumption than the AC system.
In Laos, up to now, the DC coupled configuration in the form of a solar home system, a PV battery charging station (BCS) as shown in Figure 17, a PV water pumping system and an AC coupled micro-grid, have been implemented for the off-grid villages and/or communities [9], [10], [11]. The latter is, however, a very rare case and accounted only for only a fraction of the former. The reason for the few usages of the AC configuration is due to small available budgets supporting technology development and implementation in the country.
Whatever the application, the selection of the micro-grid configuration and the design of all the components are handled by the use of simulation tools. In fact, the complexity of the hybrid system requires a system-level approach, appropriate models and an efficient optimization algorithm.
IV. Review of Software Tools
In order to optimize the use of several available natural resources with the least cost, simulation and optimization software tools are needed. Up to this time, several software tools have been deployed for the sizing and simulation of hybrid systems.
Based on the form and purpose and taking PV hybrid systems as a case study, research work in [40] has classified these tools into pre-feasibility, sizing, simulation and open architecture research tools. A pre-feasibility tool assists engineers in determining whether a PV system can be used in view of the energy provided and the life-cycle cost of energy. Among the tools, RETScreen is a renewable energy awareness, decision support, and capacity building tool building tool developed by the CANMET Energy Diversification Research Laboratory (CEDRL) in Canada. Sizing tools carry out the optimal sizing of different components making up a hybrid system when an energy requirement is given. Developed by NREL (National Renewable Energy Laboratory, USA), HOMER is the most-used sizing software for hybrid systems. Unlike sizing tools, simulation tools provide a detail analysis of the performance of the system with pre-specified data, such as nature and size of each component, provided by the user. Hybrid2, also developed by NREL, is among this kind of software. As the name suggests, open architecture research tools provide a selection of routines describing components and platforms for linking the routines together. As a result, a high degree of flexibility is available to the user to choose or modify the algorithms determining the behaviors and interactions of the individual components. The most used software for this category is the famous Matlab/Simulink developed by Mathworks.
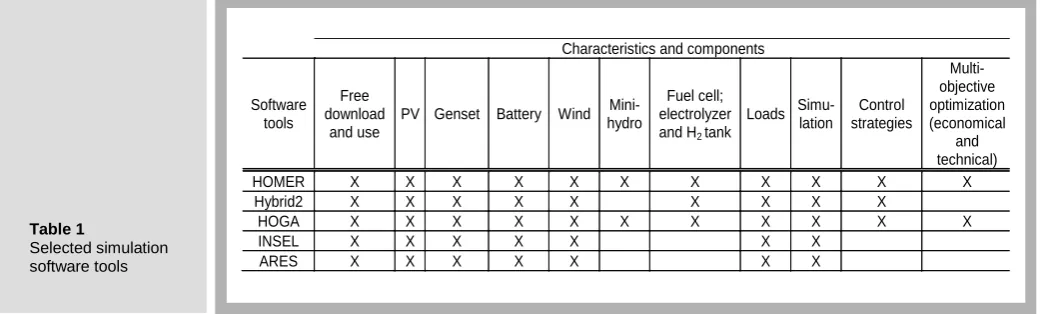
26 ENGINEERING JOURNAL : VOLUME 14 ISSUE 3 ISSN 0125-8281 : ACCEPTANCE DATE, JUL. 2010 www.ej.eng.chula.ac.th Table 1
Selected simulation software tools
As can be seen from Table 1, in addition to the basic components such as PV, wind turbines and generators, only HOMER and HOGA propose mini-hydro turbines as sources. Apart from the simulation capability commonly used by all tools, some offer control strategies, but only two of them also integrate an economic aspect in the multi-objective optimization apart from the technical one.
V. Target Location and Proposed Hybrid System
Remote villages without access to the national grid in the northern part of Laos are targets of the case study and research activities. Site surveys and studies will be carried out later on selected villages in various Northern provinces. These regions are less developed and less electrified as mentioned in 2.1 [5, 6] than those of the central and southern parts, due to their geographical locations, which are rather mountainous with scattered villages. In addition,according to the work in [7], Northern provinces have a relatively high sun radiation.
A standalone renewable hybrid system, composed of PV panels and a hydroelectric turbine as renewable energy sources, a diesel AC generator as a backup for a peak load and batteries as an electrical energy storage device, is considered. For the time being, the load profile is based on an average energy demand per household reported in [6] (75 to 600 kWh/year without and with road access respectively) in typical rural villages in Northern Laos.
5.1 Suitable Software Tools
Since a hydroelectric turbine is used as a source component and a multi-objective optimization is needed for the proposed hybrid system, among various sizing or simulation software tools presented in Table 1 only HOMER [42] and HOGA [43] are suitable.
5.1.1 HOMER
HOMER is a simulation and optimization program developed by the National Renewable Energy Laboratory (NREL). It consists of libraries including photovoltaic generators, batteries, wind turbines, hydraulic turbines, AC generators, fuel cells, electrolyzers, hydrogen tanks, AC–DC bidirectional converters, and boilers (Figure 18). The loads can be AC, DC, and/or hydrogen loads, as well as thermal loads. The user must select the components of the model to represent the architecture of his network. For optimization purposes, technical and financial data for each selected component must be entered.
Characteristics and components
Software tools
Free download
and use
PV Genset Battery Wind Mini-hydro
Fuel cell; electrolyzer and H2 tank
Loads Simu-lation
Control strategies
Multi-objective optimization (economical
and technical)
HOMER X X X X X X X X X X X
Hybrid2 X X X X X X X X X
HOGA X X X X X X X X X X X
INSEL X X X X X X X
www.ej.eng.chula.ac.th ENGINEERING JOURNAL : VOLUME 14 ISSUE 3 ISSN 0125-8281 : ACCEPTANCE DATE, JUL. 2010
27
[image:13.595.131.557.44.273.2]Picture , Capture, Image, Table
Figure 18 Main configuration panel of HOMER
Figure 19 Main configuration panel of HOGA
HOMER simulates the operation of a system by making energy balance calculations for each of the 8,760 hours in a year. For each hour, it compares the electric demand in the hour to the energy that the system can supply in that hour, and calculates the flows of energy to and from each component of the system. The tool also decides for each hour how to operate the generators and whether to charge or discharge the batteries (dispatch strategies: cycle charging and load following). When sensitivity variables are selected as inputs, HOMER repeats the optimization process for each sensitivity variable specified. At the end of the simulation, the different system configurations are classified by their total NPCs.
5.1.2 HOGA
HOGA (Hybrid Optimization by Genetic Algorithms) is a simulation and optimization program developed in C++ by José L. Bernal-Agustín and Rodolfo Dufo-López, University of Zaragoza, Spain, for hybrid renewable systems for generation of electrical energy and/or hydrogen.
[image:13.595.40.558.554.803.2]28 ENGINEERING JOURNAL : VOLUME 14 ISSUE 3 ISSN 0125-8281 : ACCEPTANCE DATE, JUL. 2010 www.ej.eng.chula.ac.th Figure 20
Daily solar radiation (HOMER)
Picture , Capture, Image, Table
The program allows for selling surplus unused AC electricity to the grid, or surplus hydrogen, produced in the electrolyzer and stored in the tank. Optimization is achieved by minimizing total system costs throughout the whole of its useful lifespan, when those costs are referred to or updated for the initial investment (Net Present Cost). Optimization is therefore financial (mono-objective). However, the program allows
multi-objective optimization, where additional variables may also be minimized: CO2
emissions or unmet load (energy not served), as selected by the user. Since the cost, emissions, or unmet load are mutually counterproductive in many cases, more than one solution is offered by the program, when multi-objective optimization is sought.
HOGA uses of Genetic Algorithms (GA) for optimization, both for the system components (main GA), and for the control strategy (secondary GA). They may produce adequate solutions when applied to highly complex problems [43].
5.2 Case Study and Simulation
As mentioned before, PV panels, a hydroelectric turbine, a backup AC generator and batteries as an electrical energy storing device are used. A location in Northern Laos with the latitude of 20.5° north and 102.5° east is selected. HOMER and HOGA are used as test tools for optimizing a hybrid system in this case study. The corresponding daily solar radiation is depicted in Figure 20. A load profile of about 8,000 kWh/year representing 20 households with 2 x 18 W fluorescent light bulbs (8 h/day), a 25 W entertainment set (10 h/day) and a 40 W electric fan (12 h/day) is assumed.
In both software tools, there is, however, no possibility for choosing the AC/DC connections via power electronic devices among components making up the hybrid system and from components to the loads. Moreover, in HOMER, there is also no possibility to input a voltage value and hence a maximal number of PV panels to be connected, while it exists in HOGA.
As fixed parameters, a lifespan of 25 years, a replacement and an O&M cost of €120/year and €2.95/year per PV panel respectively are considered. An acquisition cost of €229 and 450/panel for a power of 0.054 and 0.125 per panel respectively are
considered as variable parameters for HOGA, while an acquisition cost of €3600/kW
and a power range from 1 to 3 kW with a step of 0.5 are entered in HOMER.
www.ej.eng.chula.ac.th ENGINEERING JOURNAL : VOLUME 14 ISSUE 3 ISSN 0125-8281 : ACCEPTANCE DATE, JUL. 2010
29
Table 2Energy balance (NPC-CO2 emission)
Software Tools Unmet Load
(kWh/year)
Excess Energy (kWh/year)
CO2 Emission
(kg/year)
NPC (€)
HOMER 86.0 1,278 1,255 35,005
HOGA 93.8 730 1,507 35,735
Picture , Capture, Image, Table
Picture , Capture, Image, Table
Figure 21 Graphical
representation of NPC-CO2 optimization results (using HOGA results)
while HOGA uses the 17 and 18 l/s flow rates and an acquisition cost of €4,500 and
5,500 respectively as variable parameters.
HOGA and HOMER use a lifetime of 7,000 hrs (operating throughout the week), a 30% minimal power and an O&M cost of €0.15/hr as fixed parameters. For calculating the
CO2 emission, a CO2 emission factor of 4.75 KgCO2/l is used by HOGA, whilst
HOMER makes use of a 5.5 gCO/l CO emission factor instead. As for the acquisition, HOGA uses a range of costs, i.e. €400, 650, 850, and 1,215, for the unit power of 0.8,
1, 1.5, and 2 respectively, as variable parameters whereas only a €650/kW cost is
used for all powers in HOMER.
Only one type of battery can be selected by HOMER at a time whilst HOGA can consider many of them. A voltage of 12 V, a float life of 10 years, an 80% efficiency, a 40% minimum State of Charge (SOC), a replacement cost of €138 and an O&M cost of €5/year are common as fixed parameters for both simulation tools. Furthermore, HOMER considers an acquisition cost of €138 and a 200 Ah capacity as fixed parameters, while in HOGA, acquisition costs of €125 and 138 are taken as variable parameters for a capacity of 144 and 200 Ah respectively.
5.3 Results
1st optimization criterion: NPC and CO2 emission
The maximal flow rate of 18 l/s selected by HOGA is considered as the case to be discussed. As a result, both simulation tools could optimize the NPC well by providing
a list of different components sorted by cost and the CO2 emission (Table 2).
Since in HOMER, the PV generators considered are not made up of individual panels but taken as a one, the size of PV panels is not output, while the battery sizing is presented in Table 3. The third and fourth row of this table (HOGA1-1 and HOGA1-2) shows the increasing in size of PV panels when a lower unmet load was sought.
We can see from Figure 21 that the unmet load did not change too much since it was
not optimized alongside the NPC and CO2 emission. The CO2 emission decreased
[image:15.595.186.551.501.558.2]while the energy excess increased.
Table 3
PV and battery sizes (series and parallel)
Software Tools PV (Series x Parallel) Batteries (Series x Parallel)
HOMER N/A 4 x 2
HOGA1-1* 4 x 2 4 x 2
HOGA1-2* 4 x 4 4 x 2
* HOGAi-j; i is the criteria number (1 or 2) and j represents the selected result of the optimization process
[image:15.595.41.558.635.801.2]30 ENGINEERING JOURNAL : VOLUME 14 ISSUE 3 ISSN 0125-8281 : ACCEPTANCE DATE, JUL. 2010 www.ej.eng.chula.ac.th Table 4
Energy balance (triple optimization) Unmet Load
(kWh/year)
Excess Energy (kWh/year)
CO2 Emission
(kg/year)
NPC (€)
HOGA1-1 93.8 730 1,507 35,735
HOGA1-2 59.9 1,142 1,055 36,623
HOGA2-1 58.5 1,179 1,055 36,540
HOGA2-2 9.8 936 1,414 36,822
Picture , Capture, Image, Table
[image:16.595.35.563.336.542.2]Picture , Capture, Image, Table
Figure 22 Graphical
representation of the triple optimization
2nd optimization criterion: NPC, CO2 emission and unmet load (HOGA only)
The effect of the triple optimization can be seen in Table 4 (HOGA1-1 & HOGA2-1).
The unmet load decreased (from 93.8 to 58.5 kWh/year) at the expense of the NPC
and the excess energy, while the CO2 emission was lower.
In keeping the unmet load from further decreasing (to 9.8 kWh/year), the excess
energy reduced from 1,179 to 936 kWh/year. However, the CO2 emission and the NPC
kept increasing (Table 3 – HOGA2-1 & HOGA2-2).
Figure 22 graphically summarizes all the changes in the total unmet load, the total excess energy, the CO2 emission and the total NPC as a result of the triple optimization.
VI. Conclusions and Discussions
Although the unmet load could be reduced from 93.8 to 59.9 kWh/year through the NPC-CO2
optimization, this value is still much higher than 9.8 kWh/year obtained by the triple optimization (Figure 21). It is also observed that the CO2 emission is reduced, in contrast to the NPC and the excess energy. Through the triple optimization, the unmet load could be heavily reduced from 93.8 to 9.8 kWh/year at the expense of the NPC. The CO2 emission first reduced and then increased to a value relatively smaller than that of the NPC-CO2 optimization. In contrast, the total excess energy first increased and then reduced to a value relatively greater than that of the NPC-CO2 optimization (Figure 22).
Since the cost of energy (COE) is defined as the ratio of the annualized cost and the system load served, increasing the load served and/or the decreasing the cost would reduce the COE. The excess energy could be even reduced to zero by being sold to the grid. Selling the excess energy to the grid is only possible, however, if the hybrid system is connected to the grid. In HOGA, the user has the possibility of selling the excess energy to the grid, while in HOMER he does not. Nevertheless, if an isolated hybrid system is desired, this excess energy will be left unused or dissipate.
www.ej.eng.chula.ac.th ENGINEERING JOURNAL : VOLUME 14 ISSUE 3 ISSN 0125-8281 : ACCEPTANCE DATE, JUL. 2010
31
Figure 24HOGA Micro-grid configuration
[image:17.595.40.559.86.465.2]Picture , Capture, Image, Table
Picture , Capture, Image, Table
Figure 23 HOMER Micro-grid configuration
configuration. This flexible configuration could, however, make significant effects on the safety, adequacy, energy efficiency and expansion of the standalone renewable energy hybrid system.
The research work in [44] suggested that a system is safe if it presents no greater hazard to the public than standard urban grid-based systems. It is adequate when it delivers sufficient power when and where needed, with the required degree of efficiency and service quality. System expandability implies the use of designs that minimize life-cycle costs by making provisions for a certain degree of expansion, preventing the need to replace or rewire portions of the system as the load increases. An efficient system is one that provides an acceptable electric service at a minimum cost over the expected life of the installation.
Excess energy
The research work in [45] has shown that the excess energy could be reduced by increasing the load served while keeping the total NPC constant. However, the same objective, namely reducing the excess energy, the energy produced and thus the energy excess could be also better managed by allocating only the amount of energy required to the time when it is mostly needed by consumers.
Micro-grid configuration and multi objective optimization
32 ENGINEERING JOURNAL : VOLUME 14 ISSUE 3 ISSN 0125-8281 : ACCEPTANCE DATE, JUL. 2010 www.ej.eng.chula.ac.th
www.ej.eng.chula.ac.th ENGINEERING JOURNAL : VOLUME 14 ISSUE 3 ISSN 0125-8281 : ACCEPTANCE DATE, JUL. 2010
33
REFERENCES
[1] Alliance for Rural Electrification, Shining a Light for Progress “Hybrid power systems based on renewable energies: a suitable and cost-competitive for rural electrification,” pp. 1-7, 2007. [Online]. Available: http://www.eubia.org
[2] J. L. Bernal-Agustín, R. Dufo-López, and D. M. Rivas-Ascaso, “Design of isolated hybrid systemsminimizing costs and pollutant emissions,” Renewable Energy, vol. 31, no. 14, pp. 2227–2244, 2006.
[3] S. Voladet, “Sustainable development in the plantation industry in Laos: An examination of the role of the ministry of planning and investment,” International Institute for Sustainable Development (IISD) pp.10-11, 2009. [Online]. Available: http://www.issd.org [4] Department of Electricity, Ministry of Energy and Mines, Electricity Statistics Year Book 2006. Lao PDR,” Laos: pp. 13-17, 29-46,
2006.
[5] Ministry of Energy and Mines,“Power development plan 2007-2020,” Électricité du Laos, Laos, March pp. 36 and Appendix 3, 2008. [6] Maunsell Ltd., “Preparing the great mekong subregion northern power transmission project,” Asian Development Bank Final Report,
vol. 1, pp. 64-66, 2008.
[7] S. Janjai, “Assessment of solar energy potentials for Lao’s people democratic republic,” Solar EnergyResearch Laboratory, Department of Physics, Faculty of Science, Silapakorn University, Thailand, pp.52-69, 2006.
[8] Greengrowth, “Promotion of renewable energy, energy efficiency and green house gas (PREGA) Lao PDR,” Draft Final Report, Country and Policy Report, May 2006, pp. 8-9, 27-31, 49 and 78, 2006.
[9] Maunsell Ltd.,“Rural electrification frameworks study,” Final Report, Ministry of Industry andHandicrafts, Lao PDR, pp. 51-52, 2004. [10] Renewable energy technology in Asia, A regional research and dissemination program “A Summary of Activities and Achievements
in Lao People’s Democratic Republic,” pp. 3-4,10-11, 2002.
[Online].Available:http://www.retsasia.ait.ac.th/booklets/Dissemination%20Booklets- Phase%20I/Full%20document-Lao.pdf) [11] K. Nanthavong, “Solar PV plants in Lao PDR,” Final Report of the Asia Pro Eco Project - Diagnostic Study on Renewable Energy
Potential and Feasibility in South East Asia, pp. 2-22, 2005.
[12] I. Mitra, T. Degner, and M. Braun, “Distributed generation and microgrids for small island electrification in developing countries: A review,” SESI Journal, Solar Energy Society of India, vol. 18, no. 1, pp. 6-20, 2008.
[13] A. A. Salam, A. Mohamed, and M. A. Hannan, “Technical challenges on microgrids,” ARPN Journal of Engineering and Applied Sciences, vol. 3, no. 6, pp. 64-69, 2008.
[14] R. Lasseter, “Microgrids,” In IEEE Power Engineering Society Winter Meeting, vol. 1, pp. 305-308 2002.
[15] K. A. Nigim and W. J. Lee, “Micro grid integration opportunities and challenges,” IEEE Power Engineering Society General Meeting, pp. 1-6, 2007.
[16] Y. Zoka, H. Sasaki, N. Yorino, K. Kawahara, and C. C. Liu, “An interaction problem of distributed generators installed in a microgrid,” In Proceedings of the 2004 IEEE International Conference onElectric Utility Deregulation, Restructuring and Power Technologies,
vol. 2, pp. 795–799, 2004.
[17] E. F. El-Saadani, H. H. Zeineldin, and M. M. A. Salama, “Micro-grid operation of distributed generation: benefits and challenges,”
International Conference on Communication, Computer & Power, ICCCP’07, pp. 259-264, 2007.
[18] C. Marnay and R. Firestone, “Microgrids: An emerging paradigm for meeting building electricity and heat requirements efficiently and with appropriate energy quality,” Ernest Orlando Lawrence Berkeley National Laboratory, pp. 1-13, 2007.
[19] T. Markvart, “Microgrids: power systems for the 21st century?,”
Refocus, vol. 4, no. 7, pp. 44-48, 2006. [20] P. Piagi and R. H. Lasseter, “Autonomous control of microgrids,” IEEE PES Meeting, Montreal, pp. 1-8, 2006.
[21] M. A. Faisal, “Microgrid modelling and online management,” PhD dissertation, Helsinki University of Technology, pp. 1-5, 2008. [22] A. P. S. Meliopoulos, “Challenges in simulation and design of µgrids,” In Proceeding of the 2002IEEE/PES Winter Meeting, pp.
309-314, 2002.
[23] B. Lasseter, “Microgrids [distributed power generation],” In Proceedings of the IEEE Power Engineering Society Winter Meeting,
2001, vol. 1, pp. 146–149, 2001.
[24] N. Hatziargyriou, “MICROGRIDS-large scale integration of micro-generation to low voltage grids,” EU Contract ENK5-CT-2002-00610, Technical Final Version, Deliverable_DC1, Part 1, pp. 1-8, 2004.
[25] R. H. Lasseter, “Microgrids and distributed generation,” Journal of Energy Engineering, American Society of Civil Engineers, pp. 1-7, 2007.
[26] K. De Brabandere, K. Vanthournout, J. Driesen, G. Deconinck, and R. Belmans, “Control of Microgrids,” IEEE Power Engineering Society General Meeting, pp. 1-7, 2007.
[27] S. Abu-Sharkh, et al., “Microgrids: Distributed on site generation,” Technical Report 22, Tyndall Centre for Climate Change
Research, pp. 7-12, 2005.
[28] O. Omari, E. Ortjohann, R. Saiju, and D. Morton, “A Simulation model for expandable hybrid power systems,” Proceedings available: 2nd European PV-Hybrid and Mini-Grid Conference, pp. 1-4, 2003.
[29] O. Omari, E. Ortjohann, A. Mohd, and D. Morton, “An optimal control strategy for DC coupled hybrid power systems,” IEEE International Symposium on Industrial Electronics, ISIE 2007, pp. 2589-2594, 2007.
[30] O. Omari, E. Ortjohann, A. Mohd, and D. Morton, “An online control strategy for DC coupled hybrid power systems,” IEEE Power Engineering Society General Meeting, pp. 1-8, 2007.
[31] K. Moutawakkil and S. Elster “RE hybrid systems - coupling of renewable energy sources on the AC and DC side of the inverter,”
Refocus, vol. 7, no. 5, pp. 46-48, 2006.
[32] E. Ortjohann, A. Mohd, A. Schmelter, N. Hamsic, and M. Lingemann, “Simulation and Implementation of an expandable hybrid power system,” IEEE International Symposium on Industrial Electronics, ISIE 2007, pp. 377-382, 2007.
[33] M. Ross and D. Turcotte, “Hybridinfo – Configuration de bus dans les systèmes hybrides,” Le journalsemestriel des systèmes
photovoltaïques hybrides au Canada, Canmet Energy Technology Centre-Varennes, no. 7, pp. 1-6, 2004.
[34] G. Cramer, G. Kleinkauf, and M. Ibrahim,“PV system technologies: State-of-the-art and trends in decentralised electrification,”
Refocus, pp. 38-42, 2004.
[35] G. Cramer, J. Reekers, M. Rothert, and M. Wollny, “The future of village electrification - More than two years of experiences with AC-coupled hybrid systems,” 2nd European PV-Hybrid and Mini-Grid Conference, Kassel, Germany, September 25-26, pp. 1-6, 2003.
[36] M. Meinhardt, M. Rothert, M. Wollny, and A. Engler, “Pure ac-coupling – the concept for simplified design of scalable pv-hybrid systems using voltage/frequency statics controlled battery inverters,” PVSEC-14, pp. 1-4, 2004.
[37] M. Vandenbergh, S. Beverungen, and B. Buchholz, “Expandable hybrid systems for multi-user mini-grids,” 17th European
Photovoltaic Solar Energy Conference Proceedings, Munich, Germany, vol. 2, -pp. 1-6, 2001.
[38] M. M. D. Ross, D. Turcotte, and S. Roussin, “Comparison of ac, dc, ac-dc bus configuration for pv hybrid systems,” SESCI 2005 Conference, British Columbia, Canada, August 20-24, pp. 1-15, 2005.
[39] Ph. Strauss and A. Engler, “AC coupled PV hybrid systems and micro grids - state of the art and future trends,” 3rd World Conference on Photovoltaic Energy Conversion, Osaka Japan, 11-18 Maypp. 1-6, 2003.
[40] D. Turcotte, M. Ross, and F. Sheriff, “Photovoltaic hybrid system sizing and simulation tools: Status and needs, PV horizon,”
Workshop on Photovoltaic Hybrid Systems, Montreal, September 10, pp. 1- 10, 2001.
34 ENGINEERING JOURNAL : VOLUME 14 ISSUE 3 ISSN 0125-8281 : ACCEPTANCE DATE, JUL. 2010 www.ej.eng.chula.ac.th [42] HOMER (The Hybrid Optimization Model for Electric Renewables). [Online]. Available: http://www.homerenergy.com
[43] HOGA (Hybrid Optimization by Genetic Algorithms). [Online]. Available http://www.unizar.es/rdufo.hoga- eng.htm [44] A. R. Inversin, “Mini-grid design manual,” National Rural Electric Cooperative Association, pp. 12-17, 2000. [45] J. Ab. Razak, K. Sopian, and Y. Ali, “Optimization of renewable energy hybrid system by minimizing
excess capacity,” International Journal of Energy, vol. 1, no. 3, pp. 77-81, 2007.
![Figure 11 Micro-grid architecture [20]](https://thumb-us.123doks.com/thumbv2/123dok_us/8110664.236254/8.595.37.563.345.588/figure-micro-grid-architecture.webp)
![Figure 14 A modular AC coupled configuration [36]](https://thumb-us.123doks.com/thumbv2/123dok_us/8110664.236254/9.595.46.562.42.227/figure-modular-ac-coupled-configuration.webp)
![Figure 16 AC and DC coupled configuration [31]](https://thumb-us.123doks.com/thumbv2/123dok_us/8110664.236254/10.595.41.559.171.467/figure-ac-dc-coupled-configuration.webp)