Grain size and topographical differences between
static and mobile armour layers
Luca Mao,1* James R. Cooper2
and Lynne E. Frostick3
1Faculty of Science and Technology, Free University of Bozen‐Bolzano, Bozen‐Bolzano, Italy 2Department of Geography, University of Sheffield, Sheffield, UK
3Centre for Adaptive Science and Sustainability and Department of Geography, University of Hull, Hull, UK
Received 9 June 2010; Revised 14 February 2011; Accepted 15 February 2011
*Correspondence to: Luca Mao, Faculty of Science and Technology, Free University of Bozen‐Bolzano, Piazza Università 1, 39100, Bozen‐Bolzano, Italy. E‐mail: [email protected]
ABSTRACT: A series of laboratory flume experiments under conditions of sediment starvation (zero sediment feeding) and recirculation were conducted in order to identify the temporal evolution and surface properties of static and mobile armour layers. The experiments were carried out in an 8 m long flume using a bimodal grain‐size mixture (D50= 6·2 mm) and a range of shear stresses ranging from 4·0 to 8·6 N m–2. The results confirm that a static armour layer is coarser than a mobile one, and that the grain size of a mobile armour layer is rather insensitive to changes in the imposed flow strength. An analysis of laser scan bed surveys revealed the highly structured and imbricated nature of the static armour layer. Under these conditions the vertical roughness length scale of the bed diminished and it became topographically less complex at higher forming discharges. The topography of mobile armour layers created by rising discharges differed. They exhibited a greater roughness length scale and were less organized, despite the fact that the grain size of the surface material maintained an approximately constant value during recirculation. Also, the mobile armour tended to create larger cluster structures than static armour layers when formed by higher discharges. These differences were mainly due to the transport of the coarser fraction of bed sediments, which diminished to zero over the static armour because of being hidden within the bed, whereas in the mobile armour the coarser particles protruded into the flow and were actively transported, increasing the vertical roughness length scale. Overall, the results show that an examination of the grain size characteristics of armour layers cannot be used to infer sediment mobility and bed roughness. Detailed elevation models of exposed surfaces of gravel‐bed rivers are required to provide critical insight on the sediment availability and sedimentation processes. Copyright © 2011 John Wiley & Sons, Ltd.
KEYWORDS: armouring; laser scanner; sediment surface structures; gravel‐bed rivers
Introduction
Gravel‐bed rivers, with both seasonal and perennial regimes, typically have armoured surfaces over an underlying, finer subsurface mix of sediments. The coarser surface has implica-tions for bedload transport estimation (Barry et al., 2004; Bathurst, 2007), hyporheic flow exchange (Packman et al., 2006) and macro‐invertebrates and fish habitats (Waters, 1995). These coarser surface layers can be differentiated into static and mobile armours. A static armour layer is created by a flow that selectively entrains only the finer elements when there is a lack of upstream sediment supply (Proffitt and Sutherland, 1983; Parker and Sutherland, 1990; Chin et al., 1994; Church et al., 1998). This is typical of river reaches located downstream of lakes or dams.
Conversely, a mobile armour decreases the inherent difference in mobility between large and small grains by over‐representing the percentage of larger grains exposed to the flow (Parker and Klingeman, 1982; Parkeret al., 1982). A mobile armour layer can coexist with the transport of all available grain sizes, including the coarsest. The development
of a mobile armour has been explained using the concept of equal mobility of all grain sizes of a heterogeneous gravel bed (Parker and Toro‐Escobar, 2002). This states that, even if the coarse grains are intrinsically less mobile than the finer ones, all size fractions are transported at the same rate. Mobile armours have been developed in sediment recirculating flumes (Marion and Fraccarollo, 1997; Wilcocket al., 2001). Under these conditions the bed surface coarsening is mainly caused by a kinematic sorting process (Wilcock, 2001), in which finer grains tend to occupy the spaces left by entrained, larger grains, and gradually infiltrate into the subsurface layer. The degree and rate of vertical infiltration depend on the availability of voids, the size of both gravel framework and finer grains, and flood history (Frostick et al., 2006; Wooster et al., 2008; Gibson et al., 2009). It has also been suggested that mobile armours persist throughout floods (Wilcock and DeTemple, 2005) and some evidence of this has been also observed directly in the field (Andrews and Erman, 1986; Clayton and Pitlick, 2008).
Hassan and Church (2000) explored the development of surface bed structures on gravel beds created under both
Earth Surf. Process. Landforms36, 1321–1334 (2011)
Copyright © 2011 John Wiley & Sons, Ltd.
sediment starved and sediment feed conditions, finding notable differences in the degree of organization of stone cells. Surface microform structures, and in particular grain clusters, have long been studied, particularly for their impact on sediment transport and flow resistance (e.g. Papanicolaou and Schuyler, 2003; Stromet al., 2004). However, they can also provide important insight into the flow and sediment supply conditions of their formation (Papanicolaouet al., 2003; Wittenberg and Newson, 2005; Strom and Papanicolaou, 2009). Hendrick et al. (2010) reported on the evolution and conditions for formation and destruction of clusters under different hydraulic conditions.
Recently the grain size, degree of imbrication, cluster types and degree of stability have been studied on armoured surface layers, especially using detailed, laser scan bed surveys. Marion et al. (2003) described the degree of particle organization and bed stability using the probability density distribution of the bed surface elevations and a second‐order structure function, which is able to provide details of the roughness length scales (Nikoraet al., 1998). Differences in surface organization, imbrication and complexity between manually screeded and water‐worked beds have been demonstrated in flume studies (Cooper and Tait, 2009). The same grain surface properties have been used to assess differences between successive development of stable armour layers (Aberle and Nikora, 2006). High‐order structure functions have also been applied to explore differences at the particle scale on water‐worked gravel surfaces in the field, trying to determine the orientation and direction of the flow that formed the bed surfaces (Nikora and Walsh, 2004). In a detailed analysis of various terrestrial laser scanning surveys on two rivers in the UK, Hodgeet al.(2009) demonstrated the potential of this technique for quantifying the topography of fluvial sediment surfaces and assessing their differences in terms of the distribution of surface elevations, semivariograms, surface slopes and aspects, and grain orientation. Entwistle et al.(2007) also documented the evolution and distribution of micro‐scale bedforms after several flood events using the same technology.
Despite the range of studies on armour layer develop-ment, differences between static and mobile armour layers have not previously been quantified in terms of bed surface topography. Because the type and development of an armour layer is sensitive to changes in sediment supply and flow regime, high resolution quantitative topographic surveys may be used to assess changes in armour size and structure, and hence infer sediment supply and flow regime. Since a static armour layer is developed under limited sediment supply conditions and is very stable, it should be structured with little grain exposure and with grains predominately oriented down stream. In contrast a mobile armour layer should have structures with higher grain exposure and poor orientation. The aim of the present paper is to use a series of laboratory studies to quantify the differences in the organization of surface particles, at both grain and cluster scales, between armour layers created under conditions of sediment starvation and recirculation. Successive stages of static and mobile armour development are analysed and compared in terms of both grain size distribution, basic descriptors of the probability density function of bed elevations, surface slopes and aspects, and two‐dimensional second‐order structure functions derived from laser scan measurements. The objective is to quantify and evaluate the relationships between bed surface topog-raphy and sediment availability. The implications of these observations in terms of sediment transport and bed roughness characterization are discussed.
Materials and Methods
Experimental conditions
The experiments were carried out in an 8 m long, 0·3 m wide tilting laboratory flume. To facilitate the development of fully developed flow and to reduce backwater effects, 1 m long, artificially roughened, bed sections were placed at both the upstream and downstream end of the flume. A 0·3 m long, full‐ width, trap was used to collect sediments at the downstream end of the flume. The metal net on the sediment trap was fine enough to retain the smallest sand fraction of the mixture (0·5 mm). The capture efficiency of the bedload trap was better than 95% even with the highest bedload rate. At the beginning of each experiment, the sediments were thoroughly mixed and then screeded flat to a thickness of 0·13 m along the working length of the flume. The mixture had a bimodal grain‐size distribution (20% sand to 80% gravel) with D16= 1·7 mm; D50= 6·2 mm;D84= 9·8 mm.
Experiments were carried out under conditions of both sediment starvation and sediment recirculation. In the first set of experiments, no additional sediments were fed at the upstream end of the flume, thus forcing the bed to degrade until a static armour layer formed. The experiments were terminated when this had occurred, i.e. when bedload transport rate diminished to less than 1% of the initial rate. Under sediment recirculation conditions, all of the transported sediments were collected at the downstream end of the flume, weighed and manually re‐entered over the fixed, roughened bed at the upstream end of the flume. The sediments captured by the trap were recirculated within 40 seconds at intervals ranging from one to 10 minutes depending on the bedload rate. The recirculation experiments allowed the formation of a mobile armour layer, which was achieved when sediment transport rate no longer fluctuated significantly (usually after 15 hours).
Five runs were carried out for each condition, with discharges ranging from 13·2 to 25·6 l s–1 (shear stresses ranging from 5·9 to 8·6 N m–2, respectively). In addition, three runs with lower discharges (7·1, 9·4 and 11·4 l s–1, corresponding to 4·0, 4·6 and 5·4 N m–2) were carried out under sediment recirculation conditions (Table I). The flow was controlled by a signal inverter connected to the pump. The discharge was measured with a portable ultrasonic flow meter (GE Panametrics PT878) within the inlet pipe. Water and bed surface elevations were measured approximately every 30 minutes with a point gauge at 11 positions along the flume. Bed shear stress was calculated from measured slope and hydraulic radius, and corrected for sidewall effects. Long low‐ amplitude sand sheets were observed only during runs with higher flow rates and during sediment recirculation, and thus the contribution of bedform drag to shear stress could be reasonably neglected. The channel slope was held constant at 0·01 m m–1and the downstream adjustable weir was laid flat to allow the flow depth to adjust naturally.
Measurements of the bed surface conditions
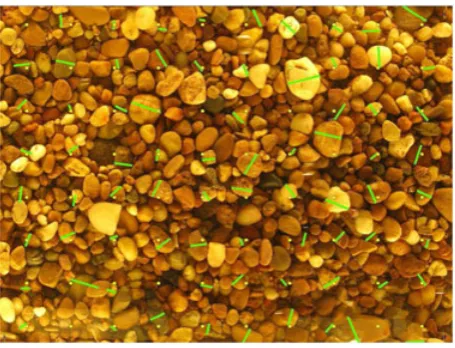
derived using a point count technique, by digitizing theb‐axes of 80 particles located at the intersection of a grid super-imposed on each of the photographs (i.e. point spacing of 20 mm; Figure 1). The presence of fine and coarse sand (clearly distinguishable on the photographs) was counted but their diameter was not measured. The overall grain size distribution of the bed was obtained from an aggregate analysis of the eight photographs, thus counting at least 600 clasts. Although this method is potentially biased by grain imbrication and partial hiding of some particles, the derived grain size distributions has been shown to be comparable to area‐by‐weight samples collected using a standard clay sampling technique converted to bulk sample equivalents (Bunte and Abt, 2001). An attempt to use automated methods for extracting grain size dimension from images (e.g. Sime and Ferguson, 2003; Graham et al., 2005) proved unsuccessful due to the bimodality of the grain size distribution and the speckled nature of the coarsest particles, which led to overfragmentation during the automatic photograph analysis.
After the photographs were taken, the bed was surveyed with a close range laser scanner (Scantron LMS6035S) at a 1 mm spatial resolution. By being controlled by an automated traverse system, the laser allowed the acquisition of elevation
points on an orthogonal grid. Using the same system, Rumsby et al.(2008) reported that there are several potential sources of error associated with laser scanning in a flume, ranging from the height error related to laser accuracy and deviation from the level of the traverse system, position error related to the traverse system, and reflectivity error associated with surface colour contrasts. Rumsby et al. (2008) developed a detailed stepwise methodology for quantifying and managing errors, and demonstrated the high elevation accuracy (about 1 mm standard deviation) associated with the application of laser altimetry in the same context.
The scans covered an area of 1·5 m × 0·2 m located in the downstream half of the flume. Repeat scans were taken each time, and these were superimposed in order to eliminate missing data points, which were always less than 5% of the total in a single scan. Where data points were still missing, values were interpolated using kriging in ArcGIS, without altering the original measured data. The frame on which the positioning system was located was parallel to the original bed slope, but as the surfaces developed this was no longer the case and the data had to be detrended in the stream‐wise and lateral direction using a linear interpolation to remove any spatial bias arising from this divergence. The mean elevation was used as a false zero and all elevations are expressed relative to this value.
Results
Bed surface grain size distribution
[image:3.595.49.550.67.237.2]There is a significant increase in the grain size of static armour layer with flow strength (Figure 2). TheD50coarsens from 6·8 to 7·4 mm (D84increase from 10·6 to 11·5 mm) as shear stress increases from 5·9 to 8 N m–2. This is most evident in theD84 mainly because of the bimodality of the mixture. However, the relationships between shear stress and both grain size percentiles are significant (for D50 R2= 0·859; standard error 0·406; and for D84 R2= 0·806; standard error 0·476 at p< 0·05). As a result, the coarsening trend is not as marked as some of those previously reported (Churchet al., 1998) but is consistent with other observations (Proffitt, 1980; Gomez, 1994). Bed coarsening is due to selective transport of fine sediments at flows below the threshold for entrainment of larger grain sizes, such that the bed surface is winnowed of the most easily moved fine sediment (Dietrichet al., 1989). This
Table I. Summary of tests conditions Liquid discharge
(l s–1)
Feeding conditions
Bed slope (m m–1)
Flow depth (m)
Shear stress (N m–2)
Dimensionless shear stress
Solid discharge (g m–1s–1)
Duration (minutes)
13·2 S 0·01 0·066 6·0 0·051 0·12 900
14·8 S 0·01 0·069 6·2 0·052 0·15 900
16·2 S 0·01 0·078 7·0 0·058 0·10 900
19·1 S 0·01 0·083 7·3 0·06 0·24 900
25·6 S 0·01 0·100 8·6 0·07 0·75 900
7·1 R 0·01 0·044 4·0 0·037 0·05 720
9·4 R 0·01 0·051 4·6 0·042 0·30 720
11·4 R 0·01 0·060 5·4 0·046 0·79 720
13·2 R 0·01 0·066 5·9 0·05 2·08 720
14·8 R 0·01 0·069 6·1 0·051 2·80 660
16·2 R 0·01 0·078 7·0 0·06 4·96 660
19·1 R 0·01 0·083 7·3 0·061 20·87 600
25·6 R 0·01 0·100 8·6 0·077 52·57 480
Note: S, sediment starvation conditions; R, sediment recirculation conditions. Dimensionless shear stress is calculated as τ* =τ/(s–1)ρgD50, whereτis the shear stress,sis the ratio of sediment densityρsto water densityρ,gis the acceleration due
to gravity.
[image:3.595.55.283.566.740.2]process continues until a static coarse surface layer develops, preventing further sediment transport (Chin et al., 1994; Church et al., 1998; Wilcock, 2001). During these experi-ments, bedload transport decreased rapidly over the first two hours, becoming negligible by the end of each run (Table I).
As expected, the experiments involving the recirculation of sediments produce different results. The bedload transport increases from 0·05 to 52·57 g m–1 s–1 for imposed shear stresses ranging from 4 to 8·6 N m–2(7·1 to 25·6 l s–1). This increase in transport rate is consistent with what has been previously found in sediment‐recirculation experiments of Wilcock et al. (2001). The grain size distribution of the bed surface coarsens under rising moderate shear stresses (Figure 2). This effect is attributed to a kinematic sorting process (Parker and Klingeman, 1982; Wilcock, 2001). The coarsening trend seems to reverse (for both D50 and D84) for higher flow strengths, creating a slightly finer armour layer. The weakening of the coarse surface at highest discharges has been observed before (Wilcock and Southard, 1989; Wilcock, 2001), and has been related to the passages of small migrating bedforms (sand sheets), which can play a role both in localized break up of the surface layer and in introducing uncertainty in the estimation of the surface grain size distribution. Overall, the grain size of the
mobile armour layer is almost invariant with flow strength, confirming the observations of Wilcock and Southard (1989) and Wilcock (2001). The regressions between the shear stress and the percentiles are in fact not significant for both D50 (R2= 0·148; standard error 1·484) andD
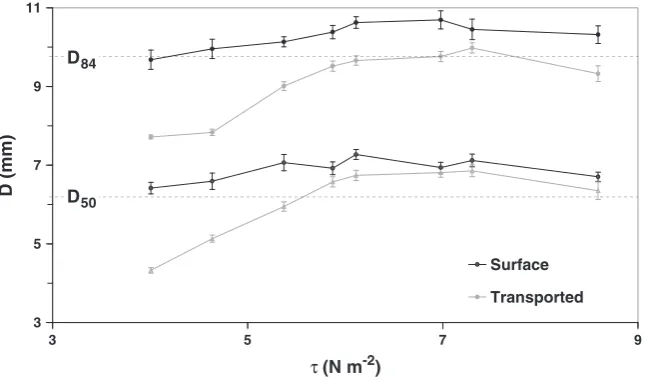
84(R2= 0·397; standard error 1·156) at p< 0·05. The grain size distribution of the sediments transported during the recirculation experiments (D50 andD84calculated as a mean value of all samples collected during the recirculation processes), appear to coarsen at higher shear stresses (Figure 3), a trend consistent with previous observations (Wilcock and McArdell, 1993; Wilcock, 2001). The slight reduction of bedload size at the highest discharge is probably due to the local and rapid break up and re‐ establishment of the coarse surface which makes subsurface sand available and causes the formation of small relief sand sheets (Reckinget al., 2009).
Probability density function of the bed elevations
The examination of the surface texture of the bed reveals differences in the organization of the grains. Visual inspection of the bed suggests that the static armour layer becomes
4 6 8 10 12 14
2 4 6 8 10
τ
(N m
-2)
D (
m
m)
Mobile armour
Static armour
[image:4.595.137.458.47.239.2]D50 D84
Figure 2. Surface grain size distribution measured at the end of each experiment using eight photographs taken along the flume length. The plotted error bars represent the standard error computed from percentile values calculated on single photographs. Dashed lines represent values ofD50and D84of the bulk sediment mixture.
3 5 7 9 11
3 5 7 9
τ (N m-2)
D (mm)
Surface
Transported
D50 D84
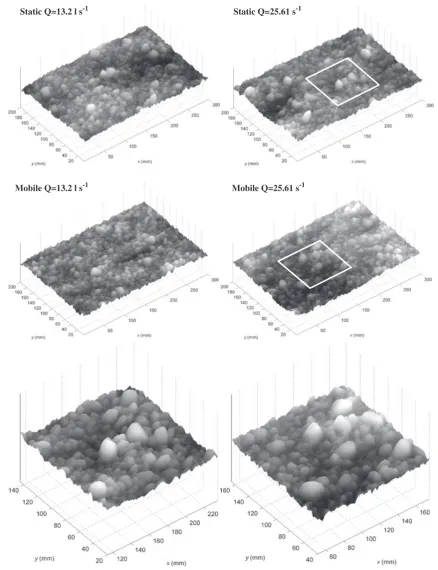
[image:4.595.136.459.569.759.2]coarser and the grains more tightly packed at higher discharges, and clusters of coarse particles tend to be aligned in the direction of the flow (Figure 4). In contrast, mobile armour beds created by similar flows appear finer with more pore spaces between grains, and a lack of clusters amongst the coarsest particles.
The probability density function (PDF) of the bed elevations discloses interesting properties of the bed. The PDFs of the static armoured bed at the end of each sediment‐starvation run are almost identical in shape and distribution (Figure 5). A Kolmogorov–Smirnov test shows that all curves can be described with a normal distribution (d ranging between 0·0257 and 0·0273). This suggests that there is a good deal of similarity in the surface distribution of elevations and organization of the bed surface despite the differences in imposed bed shear stress and grain size distribution of the armour layer. In, contrast the PDF curves for the mobile armour beds are all bell‐shaped but exhibit marked differences in their distribution. All curves can be confidently described with a normal distribution, butdranges from 0·0205 to 0·0321. The PDF curves of the bed surfaces created by the lower flow strengths (7·1 l s–1; 4 N m–2) are relatively high and narrow, with a large number of data points very close to the mean value. Conversely, the beds created under higher discharges produce broader curves with greater deviation of the values away from the zero central value.
Statistical properties of the bed
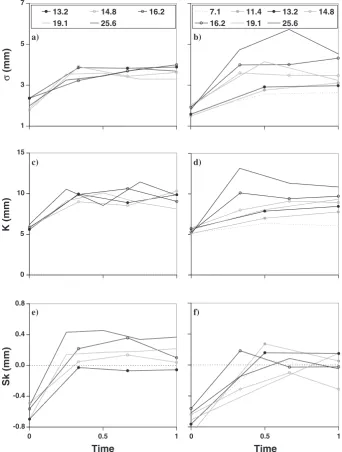
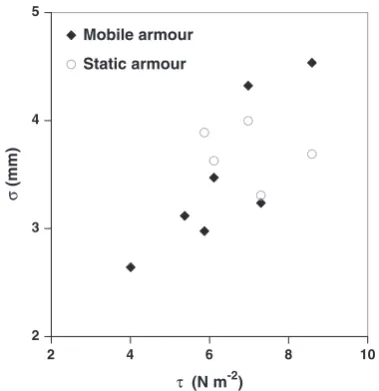
Figure 6 compares the main characteristics of the bed derived from the analysis of the PDF curves of the bed elevation measured during and at the end of each run. The standard deviation of the bed surface elevations (σ), which can be interpreted as the characteristic vertical roughness length scale of water‐worked gravel beds (Nikoraet al., 1998; Aberle and Smart, 2003; Aberle and Nikora, 2006) is very low (1·90 mm ± 0·23) at time 0 (Figure 6) suggesting consistency in the bed preparation between runs. During the non‐recirculating experiments, the standard deviation of the bed increases rapidly until reaching a steady value during the second half of the runs (Figure 6a). The final σ attained by the beds ranges around 3·74 mm, with relatively little difference between the beds created by the range of discharges (± 0·27, Figure 7). The regression between the shear stress and the standard deviation of the bed elevations is not significant (R2= 0·063; standard error 1·209) atp< 0·05. Because the standard deviation of the bed surface is a measure of the vertical roughness length, it is surprising that static armour layers created by different flow strengths have similar levels of bed roughness, especially as the surface grain size tends to increase with flow discharge (Figure 2).
Interestingly, mobile armours created by the sediment recirculation experiments have different standard deviations ranging from 2·64 to 5·73 mm for the lower and higher discharges, respectively (Figure 6b). Furthermore, the bed appears to become significantly rougher when created by higher shear stresses (R2= 0·644; standard error 0·879 at p< 0·05; Figure 7). In addition the highest formative discharges produce rougher mobile armour layers than static ones even though mobile armours have finer median grain sizes.
The range of the bed surface elevations K, which is a measure of geometrical roughness and is calculated from the fifth to the 95th percentiles of the distribution curves, shows similar trends and differences between static and mobile armour layers to those for σ (Figures 6c and 6d). In fact, the regression between the shear stress and the range of the bed elevations is not significant (R2= 0·087; standard error 1·194)
for the static armour beds but is for the mobile armour beds (R2= 0·951; standard error 0·324) at p< 0·05. The more marked temporal variability of the range of values for the mobile layers further reveals that coarser particles are mobile and also more exposed to the flow.
The skewness of the bed elevation distributions is strongly negative (around −0·66) for the manually created screeded beds (at time 0 in Figures 6e and 6f), confirming the findings of Nikora et al. (1998) and Cooper and Tait (2009). Positive skewness has been previously associated with water‐worked and well armoured bed surfaces (Nikoraet al., 1998; Marion et al., 2003; Smart et al., 2004; Aberle and Nikora, 2006; Cooper and Tait, 2009). The distributions for the surfaces created during the non‐recirculating experiments are general-ly positivegeneral-ly skewed, reflecting the effects of armouring (Figure 6e). Skewness rapidly becomes positive, and then maintains a near steady value during the evolution of the armour layer, in spite of some minor adjustments. This reflects temporal changes in surface organization and is a function of the rapid decline in bedload transport rate during the early stages of surface development. The final value of skewness is also significantly higher for the static armour layers created with higher flow strength (R2= 0·944; standard error 0·255 at p< 0·05). In contrast, mobile armour layers are characterized by a lower values of skewness and a lack of correlation with the forming flow strength.
Overall analysis of the basic statistical properties of PDFs seems to suggest that higher discharges create coarser static armour layers but maintain a relatively constant roughness. In contrast mobile armour layers are characterized by relatively constant grain size distributions, a wide range ofσand lower skewness.
Second
‐
order structure functions
A two‐dimensional second‐order structure function (or semivar-iogram) of the bed surface elevations is now used to better assess the degree of surface particle organization. Structure functions are used to assess the correlation between elevations at various spatial scales and in different directions. They have been successfully used to analyse gravel bed surfaces in previous studies (Goring et al., 1999 Butleret al., 2001; Marionet al., 2003; Smartet al., 2004; Aberle and Nikora, 2006; Cooper and Tait, 2009). The structure function Db(lx,ly) of bed surface elevation zb(x,y) is
defined as:
Db lx;ly¼
1 N−n
ð ÞðM−mÞ ∑
N−n
i¼1 ∑
M−m
j¼1
z xiþnδx;yjþmδy
−z xi;yj
2
(1)
wherelx= nδxandly= mδyare spatial lags,nandmare multiplying
coefficients for the spatial lags,δxandδyare the sampling intervals,
andNandMare the total number of measured bed elevations in the stream‐wisexand cross‐streamydirections, respectively. For a globally homogeneous random field, the second‐order structure function has the following relationship with the correlation functionR(lx,ly):
Db(lx,ly) = 2[σ2−R(lx,ly)] (2)
This shows that at large spatial lags when R(lx,ly)→0 and
Db→2σ2the data are spatially uncorrelated and the lags at
whichDb→2σ2can be used to derive characteristic stream‐
wise and cross‐stream length scales (Nikoraet al., 1998; Aberle and Nikora, 2006).
for static and mobile armour layers obtained for two different discharges (13·2 and 25·6 l s–1). These surfaces relate to those illustrated in Figure 4. The structure functions are plotted in terms ofDb/2σ2versus the spatial lags in the stream‐wise (lx) and
cross‐stream directions (ly). Low values ofDb/2σ2correspond to
high levels of correlation between elevations in a given direction, whereas at higher values of Db/2σ2the degree of
correlation decreases. Approaching unity, the bed elevations have no correlation at the range of the spatial lag and the bed surface topography can be considered random in organization
with respect to the reference point (xi,yj). Generally, the curves
in Figure 8 follow similar patterns to those previously observed (Butler et al., 2001; Nikora and Walsh, 2004; Aberle and Nikora, 2006; Cooper and Tait, 2009). At small spatial lags the curves can be described with a power function between Db(lx,ly= 0)/2σ2andlx2Hxand a function betweenD(lx= 0,ly)/
2σ2andly2Hy(Nikoraet al., 1998; Aberle and Nikora, 2006). At
this limited spatial scale the scaling region is identified andHis called the scaling or Hurst exponent. At larger spatial lags the structure functions are curved in the so‐called transition region,
Static Q=13.2 l s-1 Static Q=25.61 s-1
[image:6.595.75.514.46.617.2]Mobile Q=13.2 l s-1 Mobile Q=25.61 s-1
Figure 4. Digital elevation models of the bed surface for the static bed and mobile armour beds (above and below, respectively) created by a low flow (13·2 l s–1, on the left) and by a high flow (25·6 l s–1, on the right) obtained using the laser scanner (1 mm spatial resolution). The direction of the
and eventually approach the saturation region where Db/2σ2
reach unity (Nikora et al., 1998; Nikora and Walsh, 2004; Aberle and Nikora, 2006). The saturation region is approached by all but a few cross‐stream structure functions, confirming that the scanned area is wide enough (0·2 m) Figure 8 reveals that
the structure function on the cross‐stream direction plots is higher and reaches a quasi‐steady value at larger lags than in the cross‐stream directions for both the static and mobile armours. Also, curves are lower for the static armour beds created at low discharges (13·2 l s–1) and higher for the static
0.00 0.03 0.06 0.09 0.12 0.15
-20 -10 0 10 20
Elevation above zero mean (mm)
Prob
abil
ity densi
ty
13.2
14.8
16.2
19.1
25.6
Q (l s-1)
0.00 0.03 0.06 0.09 0.12 0.15
-20 -10 0 10 20
Elevation above zero mean (mm)
Pro
b
ability densit
y
7.1
11.4 13.2 14.8 16.2 19.1 25.6
Q (l s-1)
[image:7.595.114.486.49.204.2]a)
b)
Figure 5. The probability density function of the bed elevations at the end of each run for the static (a) and the mobile armour layers (b).
1 3 5 7
σ
(mm)
13.2 14.8 16.2
19.1 25.6
7.1 11.4 13.2 14.8 16.2 19.1 25.6
0 5 10 15
K (mm)
-0.8 -0.4 0.0 0.4 0.8
Time
Sk (
m
m)
0 0.5 1 0 0.5 1
Time
a) b)
c) d)
e) f)
[image:7.595.127.470.237.690.2]armour bed created at higher discharges (25·6 l s–1). Interest-ingly, the opposite appears to be the case for the mobile armour layers (Figure 8). Differences among curves can be assessed by comparing the extent of the scaling region, expressed in terms of theH exponent (Figure 9). This is particularly convenient because it can be considered a measure of the complexity of bed elevations, with topographical complexity varying inversely withH(Bergeron, 1996). The scaling exponent increases with rising discharges in both stream‐wise and cross‐stream direc-tions for the static armour layer. This compares with the results of Aberle and Nikora (2006), who confirm that, at higher forming discharges, the static armour becomes less complex because the concentration of coarser particles create a smoother surface. The scaling exponent is bigger in the stream‐wise (Hx) than in the
cross‐stream (Hy) direction.
For the mobile armour layer, it is interesting to note that the scaling exponent is variable but does not increase consistently at higher forming discharges. This suggests that mobile armour layers maintain a similar topographical complexity which is not strongly dependent on discharge. If the cross‐stream direc-tion is considered, the mobile armour appears to be slightly more complex than the static one created by the same dis-charge (Figure 9). No consistent difference is found in the stream‐wise direction. This suggests that topographical differ-ences in complexity between static and mobile armour layer are predominantly in the cross‐stream direction.
The difference in the spatial lags at whichDb/2σ2approach
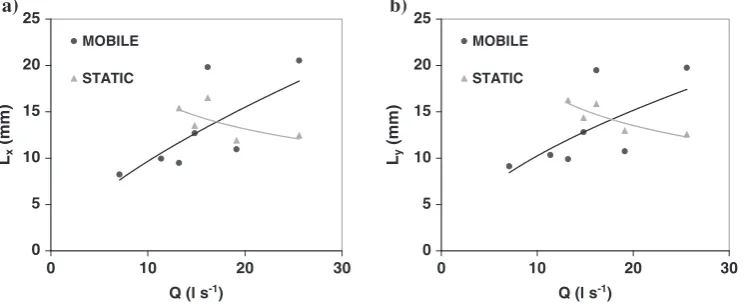
unity defines the lower limit of the saturation region (Nikora et al., 1998), and can be used to assess differences in the correlation length scales of the bed surface elevations. The stream‐wise and cross‐stream correlation lengths for the static and mobile armour surfaces are very similar (Figure 10). This suggests that the differences in cross‐stream surface complexity are not due to differences in this scaling but are caused by a difference in arrangement of the roughness elements. Interest-ingly, the correlation length scales are shorter for static armours created at higher discharges.
Figure 11 is designed to help visualize the differences in correlation between elevations (see Butleret al., 2001; Nikora and Walsh, 2004; Aberle and Nikora, 2006). They are isopleth maps of the two‐dimensional second‐order structure function D(lx,ly)/2σ2. The isopleths of the two‐dimensional
structure function for static armours (Figures , 11a, 11c and 11e) are mainly characterized by an elliptical shape elongated stream‐wise. This anisotropic shape is evident at lags comparable with both grain and larger scales, confirming the prevalent alignment of both individual particles and clusters/micro‐bedforms in the direction of the flow (Marion et al., 2003; Aberle and Nikora, 2006; Cooper and Tait, 2009). Similar shapes and orientations characterize all static armour beds, but clear differences in the degree of anisotropy are difficult to distinguish. Because similar anisotropic shapes are evident at the grain scale in Figure 11, it is probable that individual grains are aligned preferentially in the same direc-tion for both static and mobile armour layers. This contrasts with previous observations that, for mobile armour layers, grain long axes are preferentially aligned perpendicular to the flow (Nikoraet al., 1998; Nikora and Walsh, 2004). This may be explained by the finer grain size distribution used in the current experiments. However, it is evident that the anisotropy at cluster and bedform scale is stronger in the static than in the mobile armour layer for the same discharge (Figure 11). Furthermore, mobile armour layers have elliptical and diamond shape isopleths orientated in the cross‐stream direction which begin at scales of ~6D50. This indicates the presence of particle structures with their long axes oriented across the flume and could reveal the presence of complex, diamond‐shaped structures.
Surface slope and aspect
The slope and aspect of each cell (dimension 1 mm × 1 mm) in the detrended elevation model of the bed surfaces are cal-culated using the elevation of the adjacent cells (3 mm × 3 mm
2 3 4 5
2 4 6 8 10
τ (N m-2)
σ
(mm)
Mobile armour
[image:8.595.70.260.47.243.2]Static armour
Figure 7. Standard deviation of the bed elevations for static and mobile surface layers created by experimetns conducted imposing different shear stresses.
0.01 0.1 1 10
1 10 100 1000 10000
Lags lx, ly (mm) Lags lx, ly (mm) Db
/2
σσ
Db
/2
σσ
2
Static x
Static y
Mobile x
Mobile y
0.01 0.1 1 10
1 10 100 1000 10000
Static x
Static y
Mobile x
Mobile y b) Q=13.2 l s-1 a) Q=25.6 l s-1
[image:8.595.112.483.611.749.2]2
Figure 8. Second‐order structure functions of the bed surface elevations for the static (grey lines) and mobile armour layers (black lines) created using (a) a low discharge (13·2 l s–1) and (b) a higher discharge (25·6 l s–1). Solid and dashed lines refer to structure functions calculated in the stream‐
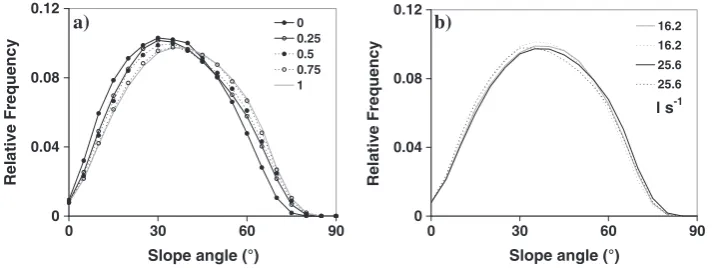
interrogation area). The aspect is the direction of the maxi-mum cell slope within the interrogation area. Figure 12a shows the distribution of cell slopes on bed surfaces scanned during one static armouring run (25·6 l s–1), revealing that there is a progressive increase in the proportion of cells with steep slopes. Static and mobile beds do not appear to differ substantially in terms of slope angles, but the static armour layers has a higher proportion of cells with steep slopes (Figure 12b). Higher discharges tend to increase the number of cells with steep slopes for both static and mobile beds. This reflects the positive skewness of the bed elevation distributions. The combined analysis of cell slope and aspect does not reveal a distinct difference between static and mobile armour beds in terms of preferential grain orientation. This further supports the results discussed earlier and shown in Figure 11.
Discussion
Bed surface grain size distribution and statistical
properties of the bed
The results show that the grain size of static armour layers coarsens with shear stress due to a process of selective transport and confirm the evidence of Wilcock (2001). The dimensionless shear stresses calculated for theD50of the static armour layers (τ*
50=τ/(ρs–ρ)gD50, whereτis the shear stress,
ρs and ρ are sediments and water densities, and g is the
acceleration due to gravity) range between 0·05 and 0·07. This range is larger than those typical for incipient motion (≈0·04) suggesting that the condition of negligible sediment transport is attained by both surface coarsening and by the development of surface structures of interlocked grains or clusters. This imparts additional strength to the bed surface, so increasing the threshold for sediment entrainment. A similar higher range of dimensionless shear stress (≈ 0·08) was reported by Church et al.(1998). In contrast, the grain size of the mobile armour layer is almost invariant with flow strength. Again, this is consistent with previous reports (Wilcock and Southard, 1989; Wilcock, 2001).
The analysis of the probability density functions of the bed elevations reveal consistent differences between static and mobile armour layers. The standard deviations of the static armour layers are all similar, even though the grain size of the bed tends to increase with flow strength. This suggests that sediments which form static armour layers are compacted, highly imbricated, and single, coarser clasts protrude little from the surrounding bed. This is reflected in similar σ values independent of grain size, suggesting that similar transport conditions (i.e. zero transport) are associated with similar levels of resistance. These findings contrast with those of Aberle and Nikora (2006) who highlight a strong correlation between σ andD50(or D84). This discrepancy may be ascribed to these authors reporting the development of static armour layers, created for the same bed by increasing flow discharges. This differs from the present study in which each armour bed had been created using a single, steady flow from a screeded, flat bed. A further difference is the grain size distribution of sediments used in the present study which is finer and more bimodal than those used by Aberle and Nikora (2006). This can mean that the use of median percentiles to describe grain size distributions becomes unreliable (Sambrook Smithet al., 1997) and may result in differences in the behaviour of sediments during entrainment (Kuhnle, 1993; Wathen et al., 1995; Allan and Frostick, 1999; Frosticket al., 2006).
For mobile armour layers, the relatively invariant grain sizes and increasing standard deviation with flow strength is surprising because static armour layers are more stable than mobile ones, and an increase in stability is often associated with an increase in roughness (Figure 6a). This would suggest that bed roughness may not be the most suitable parameter for assessing bed stability as other factors such as grain exposure and organization have a significant influence. In the case of the mobile armours, the bed may not coarsen as discharge increases, but roughness increases as the bed becomes more poorly organized and as coarse clasts are increasingly more
0.45 0.50 0.55 0.60
0 10 20 30
Q (l s-1)
H
(mm)
MOBILE
STATIC
Hx
[image:9.595.61.271.46.218.2]Hy
Figure 9. The scaling exponent derived for the stream‐wise (Hx) and
the cross‐stream (Hy) directions on both static and mobile armour beds.
0 5 10 15 20 25
Q (l s-1) Lx
(m
m)
MOBILE
STATIC
0 5 10 15 20 25
0 10 20 30 0 10 20 30
Q (l s-1) Ly
(mm
)
MOBILE
STATIC
a)
b)
Figure 10. Correlation length scales of the bed surface elevations in the stream‐wiseLx(a) and cross‐streamLy(b) directions for both static and
[image:9.595.115.487.606.759.2]exposed. This is because the coarse grains are actively transported. The difference in mobilization of larger size fractions could provide an explanation for the increase in bed roughness with imposed flow discharge. This is in agreement with the flume experiments of Wonget al. (2007) who, at mobile‐bed equilibrium, observed an increase in the standard deviation of bed elevation values with the applied shear stress.
Second
‐
order structure functions
Analysis of the scaling exponent of the structure functions as a proxy for the complexity of the bed surface suggests that static armours become less complex at higher discharges due to the fact that the surface is smoother. In contrast, mobile armour layers created by different shear stresses maintain similar levels of complexity. The correlation length scales of the bed
elevations are shorter for static armours created at higher discharges. This supports the suggestion that static armours formed by rising discharges are characterized by smaller structures. This is possibly due to the immobility of coarser particles and/or due to smaller grains filling the interstices and rendering the surface smoother (lower σ) and less complex (higherHx). In contrast, the correlation length scales of mobile
armour layers increase with discharge. This suggests that larger bed features and structures form at higher discharges probably due to the higher mobility of coarser grains. The vertical correlation length scale σ is less than half the horizontal roughness length scale for both the static and mobile armour layers, which supports similar observations for natural gravel‐ bed rivers (Nikoraet al., 1998).
Further evidence of differences between static and mobile armour layers are provided by isopleths of the two‐dimensional structure function. For static armoured beds these indicate the presence of clusters and micro‐bedforms structures oriented in
a)
b)
c)
d)
[image:10.595.97.496.47.544.2]e)
f)
the stream‐wise direction, whereas for mobile armour layers the particle structures are oriented with their longest axes across the flume. The differences in the statistical properties of the distributions of bed elevations between the two types of layer seem to reflect differences in the alignment of multi‐particle structures not the organization of individual grains. A precise classification of the shape of clusters in the bed has not been attempted because of the relatively limited number of scan measurements available and the use of one grain‐size distribu-tion. However, given that the clusters are particularly important for their influence on flow resistance and sediment transport, a detailed classification of their occurrence and dynamics under different hydraulic and sediment supply and grain size conditions could support field‐based studies trying to relate clusters with sediment transport dynamics in gravel‐bed rives (e.g. Strom and Papanicolaou, 2009; Hendricket al., 2010).
Differences between development of static and
mobile armour layers
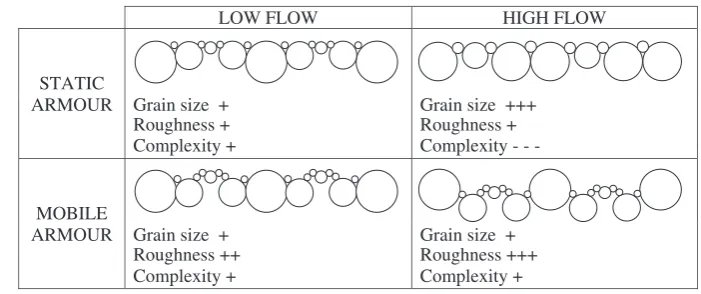
These experiments confirm that higher formative discharges result in coarser static armours due to selective entrainment of coarser particles from the bed surface. However, the results show that coarser static armours are characterized by similar vertical roughness and positively skewed PDFs, both of which indicate that during the armouring process the finer particles tend to fill the gaps between the coarse clasts, reducing the magnitude of bed elevations, especially those below the average bed level (Figure 13). The process of coarsening with flow strength produces surfaces characterized by lower complexity. This is due to the fact that smoother surfaces of coarse particles tend to create a less complex surface than a large number of finer elements (Aberle and Nikora, 2006). The analysis of cell slopes further indicate that during the static armouring process the grains tend to become packed and more imbricated. Furthermore, isopleths of the second‐order struc-ture functions reveal that coarser and smoother static armours created by higher discharges are characterized by lower horizontal correlation length scales. This correlation is evident at a scale comparable with multi‐grain structures, suggesting the presence of smaller surface structures oriented to the direction of the flow. The fact that the size of surface structures diminishes at higher discharges is consistent with the progressive smoothing of the bed as immobile, coarse clasts are progressively enclosed by smaller particles which reduces their protrusion (reducing vertical roughness length) creating small, elongated structures.
Mobile armour layers created under sediment recirculation conditions are fundamentally different from their corre-sponding static layers (Figure 13). Mobile armours differ in
the response of their surfaces to increases in flow discharge. Grain size remains constant while armours become progres-sively rougher, suggesting that clusters/multi‐grain structures grow. This is because at the higher discharges more coarse particles are transported, causing the formation of isolated and exposed coarse grains and larger scale clusters (Figure 13). However, the complexity of the surface of the mobile armour layers changes very little. Unlike static armours, mobile beds are characterized by the presence of particle structures oriented preferentially cross‐stream. This contrast in the way in which the two types of armour layer respond to rising discharge reveals that they form in completely different ways. Overall, the main reason for the difference between properties of static and mobile armours is the transport of the coarser fraction of sediments. This reduces to zero during the final stages of static armour formation but is high, especially for the higher flow strengths, throughout the sediment recircula-tion experiments. The immobility of coarse particles on the static armours allows finer fractions to infiltrate the surface voids and thereby reduce both their exposure and the shear stress acting on them. Conversely, on the mobile armour the coarse fractions are actively transported and remain protruding into the flow, increasing the vertical roughness scale relative to a static armour (Figure 13). Further investigations focused on the geometry of exposure of the coarsest grains (either isolated and organized in clusters) and their spatial distribution could provide further insight into the stability of the bed particles and feedback with the hydraulics.
Implications for field based
‐
studies
Numerous recent studies have used terrestrial laser scanning to analyse the geometrical characteristics of exposed surfaces in gravel‐bed rivers (Nikora and Walsh, 2004; Heritage and Hetherington, 2007; Entwistleet al., 2007; Hodgeet al., 2009). Most of these studies report a consistent correlation between grain size (D50andD84) and the standard deviation of surface elevations (Nikora et al., 1998; Aberle and Nikora, 2006). Recent work of Heritage and Milan (2009) also show the same strong relationship for different patches on a gravel bar. However they found that the slope and intercept values of the fitted linear regression lines varied between the patches, suggesting that there is no one, unique relationship due to variations in the degree of burial, packing and imbrication. The variation was suggested to be caused by differences in bed geometry. Also there was noticeable departure in the data from these lines at higher values of standard deviation and grain size. Also, analysing the gravel bars of two rivers in the UK, Hodge et al. (2009) found a direct relationship between laser‐scan derived roughness and D50, but with consistent 0
0.04 0.08 0.12
0 30 60 90
Slope angle (°)
Re
la
ti
v
e
Fr
e
quency
0 0.25 0.5 0.75 1
0 0.04 0.08 0.12
0 30 60 90
Slope angle (°)
R
e
la
ti
ve
Fre
qu
enc
y
16.2 16.2 25.6 25.6
l s-1
[image:11.595.122.479.50.184.2]a)
b)
Figure 12. Slope distribution of cells on a surface progressively armoured by a discharge of 25·6 l s–1(a) and slope distribution of static (solid lines)
discrepancies between different fluvial systems. In the present study the variation of standard deviation of bed surfaces are consistent with the ongoing processes (static/mobile armour), but not with the derived grain‐size. Overall, it seems that the grain size is an inappropriate descriptor for bed roughness (see also Nikoraet al., 1998; Aberle and Smart, 2003).
Lane (2005) stressed the need to consider roughness as a complex expression of topographical variability of bed surface at multiple scales rather than being simply related to grain size. In fact, roughness can only be characterized by considering grain shape, orientation, bed arrangement, as well as concentration and geometry of features on the bed surface, alongside grain‐size distribution (Nikoraet al., 1998). Cooper et al.(2008) examined some of these issues by investigating how the surface organization of gravel beds influenced flow resistance and spatial heterogeneity in the near‐bed flow. They achieved this by first forming a static armour layer in which the prevalent orientation of the grains and microtopographic structures were in the direction of the flow and then rotated this same bed by 90º. This effectively formed a mobile armour layer with preferential alignment in the cross‐stream direction, but the same statistical and grain‐size properties as the static armour. Their results showed that there was a greater near‐bed flow retardation and flow spatial variability [evaluated through spatially‐averaged stream‐wise velocity profiles and distribu-tions of form‐induced stress obtained from particle image velocimetry (PIV) measurements] over the rotated bed. The results indicate that some representative surface grain‐size and bed surface roughness height cannot accurately account for the resistance imposed by a water‐worked gravel bed on the flow. In fact, the results show that the pattern of grain orientation has a measurable influence on the flow roughness. This provides some indication of how our observed differences in two types of armour layers may influence the near‐bed flow. Because the surface‐grain size is a well used and convenient parameter often adopted to calculate sediment incipient motion and transport, further investigations are needed into the grain‐size/roughness relationship in fluvial systems. The results in the present paper suggest that this needs to be carried out under different sediment supply conditions, as well as for sediments with different shapes, sizes, sorting and organiza-tion. However it seems even more important to focus future research on field‐based assessment of bed stability, sediment transport conditions and flow resistance related to the three‐ dimensional properties of gravel bed surfaces.
The present study reveals that differences between static and mobile armour layers could be detected by analysing simple statistical moments [e.g. standard deviation (σ), skewness (Sk)] and second‐order structure functions. This outcome needs to be further explored in flume studies using both coarser and more poorly‐sorted sediment grain‐size mixtures. However, it
reveals the potential of and need for using relatively rapid terrestrial laser scanning to unveil dominant sediment transport processes and for modelling flow resistance in gravel‐bed rivers. This requires verification in the field to establish whether substantial differences in roughness, imbrication and orienta-tion at the grain‐ and cluster‐scales (as seen by Hodgeet al., 2009) correspond to significant differences in sediment transport dynamics, supply conditions, transport rate, and armour ratio. Laser scanners suitable for use in the field can capture up to 10 000 points per m2with high accuracy (three‐ dimensional location errors < 0·02 m; Heritage and Milan, 2009) and can characterize roughness elements at the grain‐ scale (Hodgeet al., 2009). They have the potential to identify differences between static and mobile armour beds at the scale established in this study.
Conclusions
Flume experiments conducted under contrasting conditions of sediment starvation (zero feeding) and sediment recirculation confirm that static armour layers are coarser than mobile ones formed under similar flow conditions. Increasing flow strengths create coarser static armours, whereas the coarsening of the mobile armour layer is rather insensitive to the imposed flow. Analyses of detailed laser scans of the bed reveal that static armours created by rising discharges display only limited variations in vertical roughness length scale, despite the greater surface grain size. This is likely to be due to the highly structured and imbricated nature of static armour layers. In contrast, mobile layers created under higher discharge condi-tions exhibit larger vertical roughness due to greater particle exposure and poorer organization and imbrication. This is despite the fact that the surface grain size remains fairly constant regardless of discharge. A two‐dimensional second‐ order structure function analysis of the bed surface elevations shows that the static armoured bed becomes less complex and features smaller cluster structures at higher discharges because coarser particles create a smoother surface. In contrast, mobile armours formed by higher discharges are more topographically complex. Given the relatively fine grain‐size distribution of the sediment mixture used in the study, the analyses show sig-nificant differences in the organization and orientation of micro‐bedform structures, but not at the grain‐scale. In both static and mobile armours single clasts are oriented preferen-tially in the direction of the flow. Overall, the results suggest that detailed elevation models of surfaces of gravel‐bed rivers could provide important insight into changes in surface texture and structure, allowing inferences to be made relating to the sediment supply and transport conditions, and flow regimes in gravel‐bed rivers.
W O L F H G I H W
O L F W O L
STATIC
ARMOUR Grain size + Roughness + Complexity +
Grain size +++ Roughness + Complexity - - -
MOBILE
ARMOUR Grain size + Roughness ++ Complexity +
[image:12.595.117.468.47.194.2]Grain size + Roughness +++ Complexity +
Acknowledgements—This research was supported by a Marie Curie Intra European Fellowship (no. 219294, FLOODSETS) within the 7th European Community Framework Programme. The authors thank the associate editor and two anonymous referees for providing critical comments which improved the clarity and accuracy of the text.
References
Aberle J, Nikora V. 2006. Statistical properties of armored gravel bed surfaces.Water Resources Research42(11): W11414. DOI. 10.1029/ 2005WR004674
Aberle J, Smart GM. 2003. The influence of roughness structure on flow resistance on steep slopes.Journal of Hydraulic Research41: 259–269.
Allan A, Frostick LE. 1999. Framework dilation, winnowing, and matrix particle size: the behaviour of some sand‐gravel mixtures in a laboratory flume.Journal of Sedimentary Research69(1): 21–26. Andrews ED, Erman DC. 1986. Persistence in the size distribution of
surficial bed material during an extreme snowmelt flood. Water
Resources Research22: 191–197.
Barry JJ, Buffington JM, King JG. 2004. A general power equation for predicting bed‐load transport rates in gravel bed rivers. Water
Resources Research40: W10401.
Bathurst JC. 2007. Effect of coarse surface layer on bedload transport.
Journal of Hydraulic Engineering133(11): 1192–1205.
Bergeron NE. 1996. Scale‐space analysis of stream‐bed roughness in coarse gravel bed streams.Mathematical Geology28: 537–561. Bunte K, Abt SR. 2001.Sampling Surface and Subsurface Particle‐size
Distributions in Wadable Gravel‐ and Cobble‐Bed Streams for
Analyses in Sediment Transport, Hydraulics, and Stream‐bed
Monitoring, USDA Forest Service Rocky Mountain Research Station,
General Technical Report RMRS‐GTR‐74. Rocky Mountain Research Station: Fort Collins, CO.
Butler JB, Lane SN, Chandler JH. 2001. Characterization of the structure of river‐bed gravels using two dimensional fractal analysis.
Mathematical Geology33: 301–330.
Chin CO, Melville BW, Raudkivi AJ. 1994. Streambed armouring.
Journal of Hydraulic Engineering120(8): 899–918.
Church M, Hassan MA, Wolcott JF. 1998. Stabilizing self organized structures in gravel‐bed stream channels: field and experimental observations.Water Resources Research34: 3169–3179.
Clayton JA, Pitlick J. 2008. Persistence of the surface texture of a gravel‐ bed river during a large flood.Earth Surface Processes and Landforms
33: 661–673. DOI. 10.1002/esp.1567
Cooper JR, Aberle J, Koll Ka, McLelland SJ, Murphy BM, Tait SJ, Marion A. 2008. Observation of the near‐bed flow field over gravel bed surfaces with different roughness length scales. InProc. Int. Conf.
on Fluvial Hydraulics River Flow 2008, 3–5 September 2008, Cesme,
Turkey, Altinakar M, Kokpinar MA, Aydin I, Cokgor S, Kirkgoz S (eds).
1: 739–746.
Cooper JR, Tait SJ. 2009. Water‐worked gravel beds in laboratory flumes–a natural analogue?Earth Surface Processes and Landforms
34: 384–397 DOI. 10.1002/esp.1743
Dietrich WE, Kirchner JW, Ikeda H, Iseya F. 1989. Sediment supply and the development of the coarse surface layer in gravel‐bed rivers.
Nature340: 215–217.
Entwistle NS, Heritage GL, Johnson J, Hetherington D. 2007. Repeat terrestrial laser scanner survey of pebble cluster creation and formation in response to flow change.Proceedings RSPSoc 2007, University of Newcastle upon Tyne, September.
Frostick L, Middleton R, Murphy B. 2006. Unraveling flood history using matrices in fluvial gravel deposits. InSediment Dynamics and
Hydromorphology of Fluvial Systems, Rowan JS, Duck RW, Werritty A (eds),
IAHS 306. IAHS Press: Wallingford; 425–433.
Gibson S, Abraham D, Heath R, Schoellhame RD. 2009. Vertical gradational variability of fines deposited in a gravel framework.
Sedimentology56: 661–676.
Gomez B. 1994. Effects of particle shape and mobility on stable armor development.Water Resources Research30: 2229–2239.
Goring D, Nikora V, McEwan IK. 1999. Analysis of the texture of gravel beds using 2‐D structure functions. InRiver, Coastal, and Estuarine
Morphodynamics, Seminara G, Blondeaux P (eds). Springer: New
York; vol. 2, 111–120.
Graham DJ, Rice SP, Reid I. 2005. A transferable method for the automated grain sizing of river gravels.Water Resources Research41: W07020. Hassan MA, Church M. 2000. Experiments on surface structure and
partial sediment transport on a gravel bed.Water Resources Research
36(7): 1885–1985.
Hendrick RR, Ely LL, Papanicolaou AN. 2010. The role of hydrologic processes and geomorphology on the morphology and evolution of sediment clusters in gravel‐bed rivers.Geomorphology114: 483–496. Heritage GL, Hetherington D. 2007. Towards a protocol for laser scanning in fluvial geomorphology. Earth Surface Processes and
Landforms32: 66–74.
Heritage GL, Milan DJ. 2009. Terrestrial laser scanning of grain roughness in a gravel‐bed river.Geomorphology113(1–2): 4–11. Hodge R, Brasington J, Richards K. 2009. Analysing laser‐scanned digital
terrain models of gravel bed surfaces: linking morphology to sediment transport processes and hydraulics.Sedimentology56(7): 2024–2043. Kuhnle RA. 1993. Incipient motion of sand‐gravel sediment mixtures.
Journal of Hydraulic Engineering119: 1400–1415.
Lane SN. 2005. Roughness–time for a re‐evaluation?Earth Surface
Processes and Landforms30(2): 251–253.
Marion A, Fraccarollo L. 1997. Experimental investigation of mobile armouring development.Water Resources Research33(6): 1447–1453. Marion A, Tait SJ, McEwan IK. 2003. Analysis of small‐scale gravel bed topography during armouring.Water Resources Research39(12): 1334. DOI. 10.1029/2003WR002367
Nikora VI, Goring DG, Biggs BJF. 1998. On gravel‐bed roughness characterization.Water Resources Research34: 517–527.
Nikora VI, Walsh, J. 2004. Water‐worked gravel surfaces: high‐order structure functions at the particle scale.Water Resources Research
40: W12601.
Packman AI, Marion A, Zaramella M, Chen C, Gaillard JF, Keane DT. 2006. Development of layered sediment structure and its effects on pore water transport and hyporheic exchange. Water, Air, & Soil
Pollution: Focus6(5–6): 433–442.
Papanicolaou AN, Schuyler A. 2003. Cluster evolution and flow frictional characteristics under different sediment availabilities and specific gravity.Journal of Engineering Mechanics129(10): 1206–1219. Papanicolaou AN, Strom K, Schuyler A, Talebbeydokhti N. 2003. The
role of sediment specific gravity and availability on cluster evolution.
Earth Surface Processes and Landforms28: 69–86.
Parker G, Klingeman PC. 1982. On why gravel bed streams are paved.
Water Resources Research18: 1409–1423.
Parker G, Toro‐Escobar CM. 2002. Equal mobility of gravel in streams: the remains of the day. Water Resources Research 38(11): 1264. DOI.10.1029/2001WR000669
Parker G., Dhamotharan S, Stefan H. 1982. Model experiments on mobile, paved gravel bed streams.Water Resources Research18(5): 1395–1408.
Parker G, Sutherland AJ. 1990. Fluvial armour.Journal of Hydraulic
Research28: 529–544.
Proffitt GT, Sutherland AJ. 1983. Transport of nonuniform sediments.
Journal of Hydraulic Research21(1): 33–43.
Proffitt GT. 1980. Selective Transport and Armoring of Nonuniform
Alluvial Sediments, Report No. 80/22. Department of Civil
Engi-neering, University of Canterbury: Christchurch; 203.
Recking A, Frey P, Paquier A, Belleudy P. 2009. An experimental investigation of mechanisms involved in bed load sheet production and migration.Journal of Geophysical Research114: F03010. Rumsby BT, Brasington J, Langham JA, McLelland SJ, Middleton R,
Rollinson G. 2008. Monitoring and modelling particle and reach‐ scale morphological change in gravel‐bed rivers: applications and challenges.Geomorphology93: 40–54.
Sambrook Smith GH, Nicholas AP, Ferguson RI. 1997. Measuring and defining bimodal sediments: problems and implications. Water
Resources Research33: 1179–1185.
Sime LC, Ferguson RI. 2003. Information on grain sizes in gravel bed rivers by automated image analysis.Journal of Sedimentary Research
73: 630–636.
Smart G, Aberle J, Duncan M, Walsh J. 2004. Measurement and analysis of alluvial bed roughness.Journal of Hydraulic Research42: 227–237. Strom K, Papanicolaou AN, Evangelopoulos N, Odeh M. 2004.
Strom KB, Papanicolaou AN. 2009. Occurrence of cluster microforms in mountain rivers. Earth Surface Processes and Landforms 34: 88–98.
Waters TF. 1995.Sediment in Streams: Sources, Biological Effects, and
Control, American Fisheries Society Monograph 7. American
Fisheries Society: Bethesda, MD.
Wathen SJ, Ferguson RI, Hoey TB, Werritty A. 1995. Unequal mobility of sand and gravel in weakly bimodal river sediments. Water
Resources Research31: 2087–2096.
Wilcock PR, DeTemple BT. 2005. Persistence of armor layers in gravel‐ bed streams.Geophysical Research Letters32: L08402. DOI. 10.1029/ 2004GL021772
Wilcock PR, Kenworthy ST, Crowe JC. 2001. Experimental study of the transport of mixed sand and gravel.Water Resources Research37(12): 3349–3358.
Wilcock PR, McArdell BW. 1993. Surface‐based fractional transport rates: mobilization thresholds and partial transport of a sand‐gravel sediment.Water Resources Research29(4): 1297–1312.
Wilcock PR, Southard JB. 1989. Bed‐load transport of mixed‐size sedi-ment: fractional transport rates, bed forms, and the development of a coarse bed‐surface layer.Water Resources Research25: 1629–1641. Wilcock PR. 2001. The flow, the bed, and the transport: interaction in
flume and field. In Gravel‐bed Rivers V, Mosley M (ed.). NZ Hydrological Society: Wellington; 183–219.
Wittenberg L, Newson MD. 2005. Particle clusters in gravel‐bed rivers: an experimental morphological approach to bed material transport and stability concepts.Earth Surface Processes and Landforms30: 1351–1368.
Wong M, Parker G, DeVries P, Brown TM, Burges SJ. 2007. Experiments on dispersion of tracer stones under lower‐regime plane‐bed equilibrium bed load transport.Water Resources Research
43: W03440.
Wooster JW, Dusterhoff SR, Cui Y, Sklar LS. Dietrich WE, Malko M. 2008. Sediment supply and relative size distribution effects on fine sediment infiltration into immobile gravels. Water Resources
![Figure 11.Examples of isopleths maps of the two‐dimensional structure functions for the static (on the left) and mobile (on the right) armour bedscreated with rising armoring discharges [13·2 l s–1, (a and b); 16·2 l s–1, (c and d); 25·6 l s–1, (e and f)].](https://thumb-us.123doks.com/thumbv2/123dok_us/8059110.225514/10.595.97.496.47.544/examples-isopleths-dimensional-structure-functions-bedscreated-armoring-discharges.webp)