White Rose Research Online URL for this paper:
http://eprints.whiterose.ac.uk/215/
Article:
Dwyer-Joyce, R.S., Reddyhoff, T. and Drinkwater, B. (2004) Operating Limits for Acoustic
Measurement of Rolling Bearing Oil Film Thickness. Tribology Transactions, 47 (3). pp.
366-375. ISSN 1547-397X
https://doi.org/10.1080/05698190490455410
eprints@whiterose.ac.uk
https://eprints.whiterose.ac.uk/
Reuse
Unless indicated otherwise, fulltext items are protected by copyright with all rights reserved. The copyright
exception in section 29 of the Copyright, Designs and Patents Act 1988 allows the making of a single copy
solely for the purpose of non-commercial research or private study within the limits of fair dealing. The
publisher or other rights-holder may allow further reproduction and re-use of this version - refer to the White
Rose Research Online record for this item. Where records identify the publisher as the copyright holder,
users can verify any specific terms of use on the publisher’s website.
Takedown
If you consider content in White Rose Research Online to be in breach of UK law, please notify us by
Tribology Transactions, 47:366-375, 2004
CopyrightCSociety of Tribologists and Lubrication Engineers
ISSN: 0569-8197 print / 1547-397X online DOI: 10.1080/05698190490455410
Operating Limits for Acoustic Measurement
of Rolling Bearing Oil Film Thickness
R. S. DWYER-JOYCE and T. REDDYHOFF Department of Mechanical Engineering
University of Sheffield Sheffield S1 3JD, U.K.
and
B. W. DRINKWATER Department of Mechanical Engineering
University of Bristol Bristol BS8 1TR, U.K.
An ultrasonic pulse striking a thin layer of liquid trapped between solid bodies will be partially reflected. The proportion reflected is a function of the layer stiffness, which in turn depends on the film thickness and its bulk modulus. In this work, measu-rements of reflection have been used to determine the thickness of oil films in elastohydrodynamic lubricated (EHL) contacts. A very thin liquid layer behaves like a spring when struck by an ultrasonic pulse. A simple quasi-static spring model can be used to determine the proportion of the ultrasonic waves reflected.
Experiments have been performed on a model EHL contact between a ball and a flat surface. A transducer is mounted above the contact such that the ultrasonic wave is focused onto the oil film. The reflected signals are captured and passed to a PC for processing. Fourier analysis gives the reflection spectrum that is then used to determine the stiffness of the liquid layer and hence its thickness. In further testing, an ultrasonic transducer has been mounted in the housing of a deep-groove ball bearing to measure the film generated at the outer raceway as each ball passes. Results from both the ball-flat and ball bearing measure-ments agree well with steady-state theoretical EHL predictions. The limits of the measuring technique, in terms of the measur-able rolling bearing size and operating parameters, have been investigated.
KEY WORDS
Rolling Bearings; Oil-Film Measurement; Elastohydrody-namic Lubrication; Ultrasound
Presented at the 59th STLE Annual Meeting in Toronto, Ontario, Canada May 17-20, 2004 Final manuscript approved February 20, 2004 Review led by Tibor Tallian
INTRODUCTION
The durability of a rolling element bearing depends crucially on the formation of a film of lubricant between the rolling elements and the raceways. If this film fails to form, for example, by lubri-cant starvation or supply interruption, the surfaces of the bearing components will come into contact; surface damage, wear, or, in extreme cases, seizure can result. In normal operation, elastohy-drodynamic oil films are formed between the opposing surfaces. The counter-formal nature of the contact results in high pressure, elastic deformation at the contact, and an increase in the viscosity of the lubricant. The films formed are usually thin (submicron) but are thick enough to separate the asperities on opposing smooth bearing surfaces.
The theoretical prediction of the formation of elastohydrody-namic lubricated (EHL) films is well advanced. The regression equations of Hamrock and Dowson(3)provide a suitable method for the determination of film thickness in steady-state Newtonian EHL smooth surface contacts. In recent years there have been many numerical studies to determine the effects of transient con-ditions, surface roughness, and non-Newtonian lubricant behavior. The most flexible methods for EHL film thickness measurements have been by optical means. In the work of Cameron and Gohar
(1)optical interferometry was used to determine film thickness as well as spatial film variation. The use of lasers to fluoresce a lubricant film has also been employed to determine film thickness (Richardson and Borman(11)). However, the requirement for transparency (i.e., the need for an optical window in the machine element) has meant that these methods are rarely used outside the laboratory.
In this work a method based on the transmission of sound through the machine element and its reflection at the oil film is proposed as a method for measuring oil-film thickness. The method offers noninvasive film measurement and does not require the electrical isolation of the surfaces or an optical window.
BACKGROUND
Ultrasonic Reflection from a Thin Liquid Layer
When ultrasound is incident on a boundary between two differ-ent media, some of the energy is reflected and some is transmitted. The proportion of any incident signal reflected (known as the re-flection coefficient,R) is given by
R=z1−z2 z1+z2
[1]
wherezis the acoustic impedance of the media (given by the product of density and speed of sound) and the subscripts refer to the two media.
If ultrasound is incident on a layered system then some of the wave will be reflected at the front face of the layer and some at the back face. There will be a series of reflections as the wave bounces inside the layer (shown schematically in Fig. 1). If the lu-bricant layer is sufficiently thick (or the ultrasonic frequency high enough) then these reflections are discrete in time. So if the speed of sound in the lubricant is known, the thickness of the lubricant film can be determined by measuring the time-of-flight between the two reflections. For thin layers, the reflected pulses overlap, and it becomes impossible to distinguish the discrete reflections.
In this work an alternative method is used. If the lubricant film is very thin, the layer behaves like a spring and the reflection of the wave depends on the spring stiffness.
By considering the equilibrium of forces and compatibility at the boundaries of the layer during the passage of the wave, it is possible to show the dependence of the reflection on interface stiffness (Kendal and Tabor(6)). In the same way, Tattersall(13)
demonstrated that the reflection coefficient of a layer was given by the expression
R=z1−z2+iω(z1z2/K) z1+z2+iω(z1z2/K)
[2]
whereKis the stiffness of the layer andωis the angular frequency (ω=2πf) of the incident wave. For identical materials either side of the lubricant film (z1=z2=z) this reduces to
R= 1
1+(K/πf z)2 [3]
[image:3.612.106.239.594.724.2]This relationship has been used to determine the stiffness of dry contacts (Kendall and Tabor(6); Krolikowski and Szczepek(8); Drinkwater, et al.(2)). In this case the interface between two rough
Fig. 1—Schematic illustration of the reflection of an ultrasonic wave from a layer between two media.
surfaces, composed of air gaps and regions of asperity contact, acts like a layer of reduced stiffness. Measurement of the reflection co-efficient and hence interface stiffness can give information about the degree of conformity of the contacting surfaces. The approach is equally applicable to a homogenous layer of reduced stiffness, such as a thin oil film.
Stiffness of a Lubricant Film
The stiffness of a layer, expressed per unit area, is defined by
K= −dp
dh [4]
wherepis the applied pressure andhis the approach of the sur-faces (in other words, the film thickness). For a liquid, the bulk modulus is defined by
B= − dp
dV/V [5]
If the sound wave length is large compared to the layer thickness, then a liquid layer is constrained to deform across its thickness only (i.e., the fluid area remains constant). Then dV/V=dh/h, and
B= −hdp
dh [6]
Combining Eqs. [4] and [6] gives
K= B
h [7]
The speed of sound through a liquid depends on the bulk modulus and density,ρ(see, for example, Povey(10)):
c=
B
ρ [8]
The layer stiffness is also sometimes written as (Hosten(4))
K=ρc 2
h [9]
Combining Eqs. [3] and [7] and rearranging gives the film thick-ness in terms of the reflection coefficient and properties of oil and surrounding media:
h= B
πf z
R2
1−R2 [10]
The film thickness is thus a function of the stiffness of the oil (the density is not a contributing factor) and the acoustic impedance of the surrounding material. The reflection coefficient varies with the wave frequency, f, but clearly the film thickness measured must not. It is important to note that it is the bulk modulus of the oil in the contact that must be used here. In elastohydrodynamic contacts this can be significantly different to that in the bulk.
ULTRASONIC REFLECTION APPARATUS
An ultrasonic pulser receiver (UPR) generates a voltage signal that causes a piezoelectric transducer to be excited. The pulse characteristics are specified in a control signal sent from the PC at the start of the measurement series. The transducer emits a broadband frequency pulse that is reflected from the interface and received by the same transducer.
368 R. S. DWYER-JOYCE, T. REDDYHOFF ANDB. W. DRINKWATER
Fig. 2—Schematic representation of ultrasonic pulsing and receiving system.
were used, with central frequencies of 50 and 25 MHz. The former provides a higher resolution and so was used for smaller contact patch sizes. The transducer is immersed in a water bath and posi-tioned so that the wave is focused on the lubricant layer.
The reflected pulse is amplified and stored on a digital oscillo-scope. The stored reflected signals are passed to the PC for pro-cessing. Figure 2 shows a schematic diagram of the apparatus and data signals. Software (written in the LabView software environ-ment) was written to control the UPR, receive reflection signals from the oscilloscope, perform the required signal processing, and display appropriate results.
The procedure starts with the recording of a reflected signal when the surfaces are out of contact (i.e., at a steel/oil interface). A Fourier transform is performed to give an amplitude frequency spectrum. This steel/oil reflection spectrum is then divided by the reflection coefficient for a steel/oil interface (R=0.95 as obtained from Eq. [1]) to give the steel/air reflection (i.e., the incident sig-nal). Then a given lubrication condition is created and reflected signals are recorded. Each reflected signal is Fourier transformed and then divided by the reference spectrum. This gives a reflection coefficient spectrum, which is then processed using Eq. [10] to give film thickness directly.
MEASUREMENTS FROM A MODEL EHL CONTACT
Initial experiments were performed on a simple ball on flat contact. A conventional optical EHL apparatus was modified to hold a transducer as shown in Fig. 3.
[image:4.612.55.296.75.170.2]A steel ball is supported on rollers and hydraulically loaded onto the underside of a steel disk. The ball is rotated at constant speed by an electric motor through a gear box and quill shaft. The
Fig. 3—Schematic diagram of the experimental apparatus used to gener-ate an elastohydrodynamic film for a ball sliding on a flat.
steel disk is held stationary so that the ball is completely sliding against the disk underside. The ball is flooded with a mineral oil (Shell Turbo T68), which is entrained into the contact to form a film. A 50 MHz focusing transducer is mounted above the contact in a water bath (the water is required to couple the transducer to the steel disk). The transducer is positioned directly above the contact region and at a distance such that the wave is focused on the ball/disk interface.
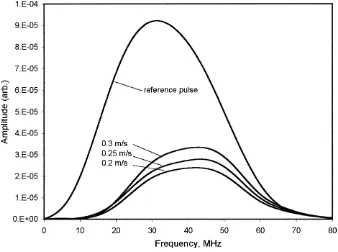
Figure 4 shows a series of pulses (as amplitude against fre-quency spectra) reflected from this contact. The reference spec-trum is that which is reflected back when the ball is not in contact (and subsequently divided by the reflection coefficient for steel-oil to give the incident pulse). The next three spectra are recorded when the ball is in contact and an oil film is formed as the sliding speed is increased.
Each of the spectra recorded at an oil film is divided by the reference spectrum to give the reflection coefficient spectrum; this is plotted in Fig. 5. A single reflected spectrum (normalized by the maximum amplitude) is also included to indicate the bandwidth of the transducer. Within the frequency range 25 to 55 MHz there is a clear frequency dependence of the reflection coefficient. Outside of this range the signal energy is low, so the reflection coefficient is subject to noise.
Equation [3] is then used to determine the stiffness of the film measured at each of these frequencies from the reflection coeffi-cient (as shown in Fig. 6). It can be seen that the frequency de-pendence is now almost all removed. The calculated film stiffness should be independent of the measuring frequency.
To obtain the film thickness from the stiffness, the bulk modulus of the oil in the contact is needed (Eq. [7]). It is simple to obtain the modulus of the oil in the bulk by measuring the speed of sound (by timing a pulse traveling over a known distance). For T68 at room temperature, the speed of sound turns out to be 1450 m/s and from Eq. [8], given that the density is 876 kg/m3, the bulk modulus is 1.84 GPa. However, the oil in the contact is under high pressure and its modulus changes significantly.
Jacobson and Vinet(5)provide a model to determine the influ-ence of pressure on the compression and bulk modulus of liquid lubricants. Their results are based on the use of a high-pressure chamber to measure the compression of several liquid lubricants up to pressures of 2.2 GPa. For mineral oils the bulk modulus increased from around 1.5-1.7 GPa at atmospheric pressure to 20-30 GPa at EHD pressures, while the density increased by about 20 to 30%. The modulus determined from a pressure cell will be the isothermal bulk modulus, whereas the acoustic velocity is a func-tion of the adiabatic bulk modulus. In this work the wave power is very small (and the wave is passing through a liquid), so little heating is expected. For this work it is a reasonable approximation to compare the two values.
Unfortunately, there are no test data available specifically for the lubricant used in these studies (Shell Turbo T68). Instead, a different approach has been used. The theoretical solution for the film thickness in a point elastohydrodynamic contact given by Hamrock and Dowson(3)is used. The central film thickness,hcis expressed in terms of five nondimensional parameters:
[image:4.612.63.289.613.724.2]Fig. 4—Four reflected pulses in the frequency domain. The reference pulse is reflected from a steel-oil interface (with no ball in contact). The three other pulses are recorded as the ball sliding speed is increased.
where
Hc =
hc
Rx
, W= P
2E∗R2 x
, U= ηou
2E∗R x
,
k=1.03
Ry
Rx
0.64
, G=2αE∗
where E∗ is the reduced modulus, R
x and Ry are the re-duced radii in the parallel and transverse directions, u is the
mean surface speed, P is the applied contact load, η0 is the viscosity of oil in the inlet, and α is its pressure viscosity coefficient.
The bulk modulus of the oil in the contact is then chosen so as to minimize the least-square error between the experimen-tally measured film thickness and that determined from Eq. [11]. A value of B =25.8 GPa gives the best fit to the data (with a correlation coefficient of R2 = 0.88). This value of the bulk
[image:5.612.137.473.481.722.2]370 R. S. DWYER-JOYCE, T. REDDYHOFF ANDB. W. DRINKWATER
Fig. 6—Layer stiffness against frequency calculated using the spring model (Eq. [3]) from reflection data for three ball rotational speeds.
modulus is in keeping with the data of Jacobson and Vinet for a mineral oil under pressure. Figure 7 shows the correlation be-tween the measured and theoretical data using this single value ofB.
The variation of measured film thickness with speed for two different-sized contacts is shown in Fig. 8 (the bulk modulus again is set to 25.8 GPa).
MEASUREMENTS FROM A ROLLING ELEMENT BEARING
[image:6.612.135.480.480.722.2]Figure 9 shows a diagram of an apparatus developed to measure the film thickness in a rolling element bearing. The bearing is a 6410 deep-groove ball bearing, loaded hydraulically and rotated by an electric motor. A 25 MHz transducer is positioned in a small water bath through machined in the bearing bush. The outer race
Fig. 8—Measured film thickness against speed for two contacts at different loads. Results are compared with the theoretical solution (Eq. [11]).
is in contact with the water but not modified in any way. The transducer is spherically focusing and positioned in the water bath such that the wave is focused on the interface between the ball and the outer raceway. The transducer is carefully positioned so that the focused spot falls within the ball/raceway contact region. The bearing cavity is flooded with a mineral oil (Shell Turbo T68).
A reflected pulse is recorded when the bearing is stationary and there is no ball located over the measurement region (although the cavity is still filled with oil). This signal (when corrected by the steel-oil reflection coefficient) is then used as the reference signal. The bearing is then rotated and the transducer set to continuously pulse at a repetition rate of 10 kHz.
When a pulse strikes the outer raceway bore and there is no ball at that location, the pulse is largely reflected (R=0.95). How-ever, when a ball is over the measurement zone, a much greater proportion of the wave is transmitted and reflection coefficients are significantly reduced. A gate is set on the digital oscilloscope to
Fig. 9—Schematic of apparatus used for ultrasonic measurements of film thickness in rolling element bearings.
capture and store only these reduced-amplitude reflected pulses (typically set atR<0.7). The pulse with the minimum amplitude as the ball passes over is used. This ensures that a signal is not pro-cessed when the contact is half positioned over the measurement zone. This would give a signal back from a film of varying thick-ness, and the assumptions of the spring model stiffness (Eq. [7]) would no longer be valid. It would perhaps be a better, but more involved, solution to trigger the pulse such that it is received only when a ball is directly overhead.
A variety of bearing loads and speeds were tested. However, since the temperature of the lubricant varies throughout these tests it is not possible to present the data as film thickness against speed (or load) curves, because the viscosity is different at each point. Instead, the data are presented as the measured film thick-ness plotted against a prediction of the film thickthick-ness from the solution of Hamrock and Dowson(3)(see Fig. 10). The viscosity of the oil used in the prediction is determined at the appropriate temperature (as measured by a thermocouple in the oil close to the contact region). The bulk modulus is that determined from the experiments on the ball on the flat apparatus above. Strictly speaking, a different value of the bulk modulus should be used at each bearing load; further work is needed in this area.
The results show reasonable agreement. The spread along the x-axis shows the variation in film for nominally the same bear-ing operatbear-ing conditions (load, speed, and oil temperature). The measured film thickness varies by around±20%.
LIMITS OF APPLICABILITY
The successful operation of this method relies on the following:
(a) The spring model is an appropriate method for interpreting the reflected signal.
[image:7.612.53.293.567.725.2]372 R. S. DWYER-JOYCE, T. REDDYHOFF ANDB. W. DRINKWATER
Fig. 10—Comparison of rolling element bearing film thickness measured by an ultrasonic means with EHD theoretical solution (the dashed line shows the locus of exact agreement).
(c) The focused spot size must be smaller than the contact patch dimensions.
(d) The contact must be in position long enough for a pulse to be reflected.
Each of these requirements will be investigated in turn, in order to determine what limits they put on the type of bearing films that can be measured.
Spring Model Validity
The spring model that describes the reflection of ultrasound at a thin layer relies on two assumptions: that the layer is thin and may be considered as a spring of negligible mass and damping, and that the opposing surfaces are smooth and parallel.
If the layer is thick compared with the ultrasonic wavelength, then mass effects become important. At higher frequencies and thicker films there is the appearance of resonances in the reflection spectrum and the mass of the layer is important. The frequency at which a resonance occurs is given by (Pialucha and Cawley(9)):
fres=cm
2h [12]
wheremis the mode number. The speed of sound is a function of both stiffness and density; so clearly the resonance depends on both stiffness and mass. From Eq. [12], the first resonance (m=1) will occur at 2.25 GHz, 225 MHz, and 22.5 MHz for films of thick-ness 1, 10, and 100µm, respectively. For thin EHL film, therefore, the measurement frequencies would have to be very high before any mass effects are observable.
The effects of surface roughness are harder to quantify. The stiffness (Eq. [7]) is calculated on the basis of a smooth parallel-sided oil film. Surface roughness can have two effects: there may be asperity contact, and the gap width will vary. If rough surface
contact occurs, then the reflection will depend on the combined stiffness of both the liquid and the solid parts. The scale of the roughness is so small in a bearing component compared to the sound wavelength that individual asperities will not scatter ultra-sound. The stiffness of the liquid part will therefore be controlled by the mean gap thickness (i.e., the spacing between the two rough surface mean lines).
Attenuation in the Bearing Raceway
Some of the ultrasonic wave will be attenuated as it passes through the raceway material. If the attenuation is excessive, the reflected signal cannot be distinguished from background noise. Typically, porous materials and those with high hysteresis attenu-ate significantly. The amount a mattenu-aterial attenuattenu-ates ultrasound is defined by an attenuation coefficient,α, where
Ax=A0e−αx [13]
whereAxis the amplitude of a wave, initially of amplitudeA0, after it has passed through a thickness of material ofx(Krautkr ¨amer and Krautkr ¨amer(7)).
Fig. 11—The maximum bearing steel raceway thickness that can be penetrated by an ultrasonic wave and still retain less than a 90% signal loss. Raceway dimensions from some of the 60XX series of ball bearings are overplotted.
If we allow a conservative reduction of the incident signal of say, 90%, Eq. [13] can be used to determine the thickness of bearing steel that can be successfully penetrated. Figure 11 shows the maximum bearing raceway thickness that can be penetrated by a given ultrasonic frequency.
At a frequency of 25 MHz, it would be possible to test through 10 mm of bearing steel. But, if the measurement frequency is 50 MHz, then only 3 mm is possible. The approximate thick-ness of the outer raceway for a selection of deep-groove bear-ings is plotted in Fig. 11. This indicates that for the larger size bearings, the measurement frequency will be limited to the lower ranges.
Spatial Resolution
In this work, focused transducers are used where a spherical lens bonded to the piezo element focuses the emitted wave. The spot size of a focused transducer is given by (Silk(12))
df(−6 dB)= 1.028Fc
f D [14]
whereFis the transducer focal length,cis the speed of sound in the focusing medium, andDis the diameter of the piezo element. This expression is plotted in Fig. 12 for a typical transducer of crystal size 7.5 mm and focal length 25 mm. This plot shows what
[image:9.612.149.459.526.729.2]374 R. S. DWYER-JOYCE, T. REDDYHOFF ANDB. W. DRINKWATER
frequency would be required to achieve a given spot size. This spot should fall entirely within the central film thickness region of the contact. As a first approximation therefore, a measurement could be achieved if this spot size is less than the minor semi-axis of the ball raceway elliptical point contact (df ≤a). It is not pos-sible to focus the wave to less than the wavelength in the focusing medium,λ(wherec= fλ). This represents a physical minimum to the spatial resolution and is also shown on Fig. 12 for a wave traveling in steel.
Overplotted in Fig. 12 are the minor semi-contact widths cal-culated for some of the 60XX series of ball bearings (loaded to their maximum dynamic load rating,C). It is evident that for the larger bearing sizes most frequencies will be suitable, while for the smaller instrument bearings higher frequencies are required.
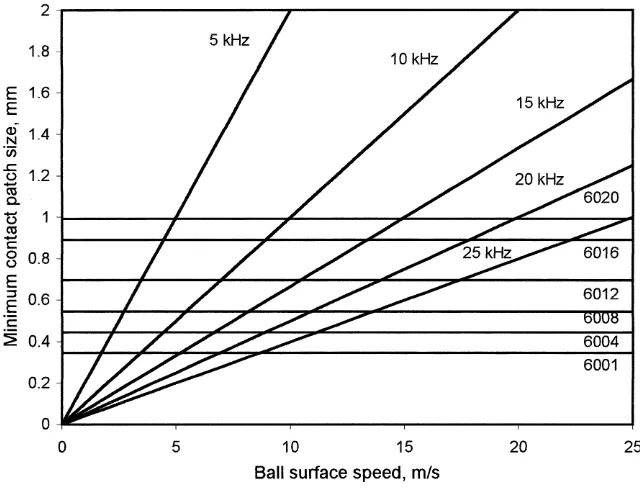
Speed Limit
In these experiments a pulse repetition rate of 10 kHz was used. There is thus a limiting ball speed such that two successive pulses should fall within a contact patch as the ball moves over the measurement zone. The relationship between the limiting ball speed and the size of a measurable contact patch is plotted in Fig. 13 for several pulse repetition rates. Again, contact patch sizes from bearings in the 60XX series are over plotted.
The maximum possible repetition rate is determined by the requirement that the second incident pulse should not interfere with the first reflected pulse. How close these two pulses can be will be governed by the thickness of the bearing raceway.
[image:10.612.146.466.480.724.2]An alternative approach would be to trigger the pulsing system so that pulses are received only when the ball is directly over the transducer. The width of a single pulse is typically twice its wave-length (the pulses are designed to be as short as possible). If that pulse is to be completely reflected from a contact, then the contact
Fig. 13—The minimum measurable contact patch width (2a) for a given ball surface speed. As the pulse repetition rate is increased, smaller, higher speed contacts can be measured.
width must be larger (i.e., approximatelya≤λ). For frequencies in the range 10 to 50 MHz traveling in steel, the wavelengths and thus theoretically minimum measurable contact width would be from 590 to 118µm. Essentially, this is similar to the spatial reso-lution limit; it is not possible to focus a pulse to a size less than its wavelength.
Practical Implementation
There are a number of practical problems associated with this approach. First, a transducer must be held at a fixed location in space, normal to the contact, and coupled to the outer raceway. Positioning the transducer takes some care, so that the wave can be focused directly on the contact location. A water bath has been built to couple the transducer to the bearing outer race. This is somewhat awkward to set up and maintain during testing.
There is also a requirement for a reference signal (to deduce the incident ultrasonic wave amplitude). This means that a measure-ment must be recorded when a ball is not above the measuremeasure-ment location. In this work, this was done when the bearing was station-ary. In principle it would be possible to do this as part of a running test. Signals reflected back from a ball contact are divided by those recorded when no ball is present.
The output of a piezoelectric crystal varies with temperature. If during a test the transducer heats up, then the signal amplitude, and hence reflection coefficient, reduce, thereby underpredicting film thickness. Typically, signal reductions of about 10% were ob-served as the temperature varied during these tests. The transduc-ers are pre-calibrated in an oven, so that temperature response is known before testing and can be accommodated.
for oil under high pressure it is not so straightforward. Here, the high-pressure modulus has been determined by fitting a theoreti-cal model to experimental data from the ball on flat contact. This has then been used for later interpretation of ball bearing reflected signals. This approach is a useful way to determine the bulk mod-ulus of lubricants under pressure. The contact essentially acts as a small high-pressure cell, and if the film thickness is assumed then the bulk modulus is obtained. For better accuracy of ball bearing film measurements, the relationship between bulk modulus and pressure could be determined by this method and an appropriate value used in each ball bearing test case.
CONCLUSIONS
1. Ultrasound reflects from the lubricant film between bearing surfaces. It is possible to deduce the thickness of the lubricant film by comparing the frequency spectrum of the reflected pulse with that of the incident pulse.
2. The response of the lubricant layer to an ultrasonic pulse has been modeled using a spring model approach. The reflection is then a function of the stiffness of the lubricant layer (i.e., its bulk modulus and thickness), the frequency of the ultrasonic wave, and the acoustic impedance of the surrounding solid bodies. 3. The elastohydrodynamic lubricant film that forms between a
ball sliding on a flat surface has been measured by this means. Films down to 50 nm were recorded. By comparing the mea-sured film thickness with theoretical predictions the bulk mod-ulus of the oil in the contact was deduced to be 25.8 GPa. 4. The approach has also been used to measure film thickness in
a rolling element bearing. The transducer is mounted on the bearing raceway and the pulse reflected back as the ball passes over is recorded. Measurements agree reasonably well with theoretical predictions, although there is significant scatter in the data.
5. Limitations of the method depend on ultrasonic attenuation in the raceway, spatial resolution of the wave, and the speed of the contact patch. In principle, the approach will work for most ball bearing sizes, although larger, heavily loaded bearings, with a large contact patch, will be easier to measure.
REFERENCES
(1)Cameron, A. and Gohar, R. (1966), “Theoretical and Experimental Studies of the Oil Film in Lubricated Point Contact,”Proc. R. Soc. Lond. A,291, pp 520-536.
(2)Drinkwater, B. W., Dwyer-Joyce, R. S. and Cawley, P. (1996), “A Study of the Interaction between Ultrasound and a Partially Contacting Solid-Solid Interface,”Proc. R. Soc. Lond. A,452, pp 2613-2628.
(3)Hamrock, B. J. and Dowson, D. (1981),Ball Bearing Lubrication, the Elas-tohydrodynamics of Elliptical Contacts, John Wiley & Sons, London.
(4)Hosten, B. (1991), “Bulk Heterogeneous Plane-Wave Propagation through Viscoelastic Plates and Stratified Media with Large Values of Frequency-Domain,”Ultrasonics,29, pp 445-450.
(5)Jacobson, B. O. and Vinet, P. (1987), “A Model for the Influence of Pressure on the Bulk Modulus and the Influence of Temperature on the Solidification Pressure for Liquid Lubricants,”J. Tribol.,109, pp 709-714.
(6)Kendall, K. and Tabor, D. (1971), “An Ultrasonic Study of the Area of Contact between Stationary and Sliding Surfaces,”Proc. R. Soc. Lond. A,
323, pp 321-340.
(7)Krautkr ¨amer, J. and Krautkr ¨amer, H. (1975),Ultrasonic Testing of Materi-als, Springer-Verlag, New York.
(8)Krolikowski, J. and Szczepek, J. (1991), “Prediction of Contact Parameters Using Ultrasonic Method,”Wear,148, pp 181-195.
(9)Pialucha, T. and Cawley, P. (1994), “The Detection of Thin Embedded Layers Using Normal Incidence Ultrasound,”Ultrasonics,32, pp 431-440.
(10)Povey, M. J. W. (1997),Ultrasonic Techniques for Fluids Characterisation, Academic Press, San Diego.
(11)Richardson, D. A. and Borman, G. L. (1991), “Using Fibre Optics and Laser Fluorescence for Measuring Thin Oil Films with Applications to En-gines,” SAE Paper912388, Society of Automotive Engineers, Warrendale, PA.
(12)Silk, M. G. (1984),Ultrasonic Transducers for Nondestructive Testing, Hilger, Bristol.


![Fig. 6—Layer stiffness against frequency calculated using the spring model (Eq. [3]) from reflection data for three ball rotational speeds.](https://thumb-us.123doks.com/thumbv2/123dok_us/8090024.231234/6.612.124.494.74.323/layer-stiffness-frequency-calculated-spring-reection-rotational-speeds.webp)