Novel Biomarkers for the Diagnosis
of Pancreatic Ductal Adenocarcinoma:
The Proteomic Approach
J.M.F.TANG
i
Novel Biomarkers for the Diagnosis
of Pancreatic Ductal Adenocarcinoma:
The Proteomic Approach
Thesis submitted in accordance with the requirements of the
University of Liverpool for the degree of Master in Philosophy
by Joseph Man Fung Tang
ii
Preface
I hereby certify that this thesis is the result of work undertaken by myself with supervision and guidance as acknowledged. The material contained within the thesis has not been presented wholly or in part for any other degree or qualification.
The research was undertaken in the Division of Surgery and Oncology, University of Liverpool, 5th Floor UCD Building, Daulby Street, Liverpool, L69 3GA.
Cell culture, Western Blot analysis, ELISA, and all statistical analyses were undertaken by myself. Quantification of serum cytokines, chemokines, and growth factors was performed with the aid and under the direct supervision of Dr Victoria Shaw in accordance with the Good Clinical Laboratory Practice regulations.
Figure 1.1 was used (unmodified) with the kind permission from Encyclopaedia Britannica, Inc., copyright 2003.
………
Joseph Man Fung Tang
August 2010
iii
Table of Contents
ACKNOWLEDGEMENTS ... VIII
ABBREVIATIONS ... IX
CHAPTER 1- GENERAL INTRODUCTION: PANCREAS AND PANCREATIC
CANCER ... 1
1.1ANATOMY OF THE PANCREAS ... 2
1.2INTRODUCTION TO PANCREATIC CANCER ... 3
1.2.1 Epidemiology of Pancreatic Cancer ... 3
1.2.2 Pathogenesis of Pancreatic Cancer ... 5
1.2.3 Molecular Hallmarks of Pancreatic Cancer ... 7
1.2.3.1 K-Ras signalling pathway ... 7
1.2.3.2 Tumour suppressor genes and pathways ... 8
1.2.3.3 Embryonic Signalling pathways ... 8
1.2.4 Symptoms and Signs of Pancreatic Cancer ... 9
1.2.5 Diagnosis and Staging of Pancreatic Cancer ...10
1.2.6 Management and prognosis of pancreatic cancer ...11
1.2.6.1 Advanced pancreatic cancer ... 11
1.2.6.2 Resectable pancreatic cancer ... 12
1.3BIOMARKERS FOR PANCREATIC CANCER ...13
1.3.1 Introduction to biomarkers ...13
1.3.1.1 The need for diagnostic biomarkers of pancreatic cancer ... 13
1.3.2 Current biomarker of pancreatic cancer: CA19-9 ...14
1.3.2.1 CA19-9 in screening and diagnosis of pancreatic cancer ... 14
1.3.2.2 CA19-9 in prognosis, surveillance, and assessment of chemotherapy ... 15
1.3.3 Other markers of pancreatic cancer ...15
1.3.4 Techniques for biomarker discovery ...16
1.3.4.1 2D-PAGE ... 16
1.3.4.2 Mass Spectrometry and iTRAQ... 17
1.3.4.3 Western blotting ... 18
1.3.4.4 Enzyme-Linked Immunosorbent Assay (ELISA) ... 20
1.3.4.5 Multiplex Assays (LUMINEX) ... 21
1.4ROLE OF CCGFS IN INFLAMMATION AND CANCER ...23
1.4.1 The relationship between inflammation and cancer ...23
1.4.2 Pathways linking inflammation and cancer...24
1.4.2.1 NF- ... 24
iv
1.4.2.3 HIF 1-alpha ... 25
1.4.3 Tumour microenvironment, cytokines and cancer ...26
1.4.3.1 Immune cells, cytokines, and cancer... 27
1.4.3.2 Pancreatic stellate cells, CCGFs, pancreatic fibrosis, and cancer ... 27
1.5STATISTICAL MODELLING METHODS ...29
1.5.1 Background ...29
1.5.1.1 The Stepwise Regression (SR) Model ... 29
1.5.1.2 The Multinomial Logistic Regression Model ... 30
1.5.1.3 Artificial Neural Network Model ... 31
1.6RESEARCH PROJECT DESIGN ...32
CHAPTER 2- THE DIAGNOSTIC POTENTIAL OF VDBP, RBP-4, AND FINC FOR PANCREATIC CANCER ...33
2.1BACKGROUND AND INTRODUCTION ...34
2.1.1 Vitamin D binding protein ...35
2.1.2 Retinol-binding protein ...36
2.1.3 Fibronectin ...36
2.2STUDY AIMS ...37
2.3MATERIALS AND METHODS ...37
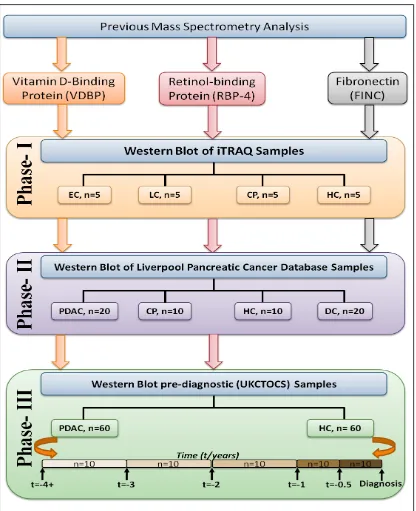
2.3.1 Study design ...37
2.3.2 Patients and samples ...39
2.3.2.1 Phase I and II Liverpool pancreatic cancer database (LPCD) ... 39
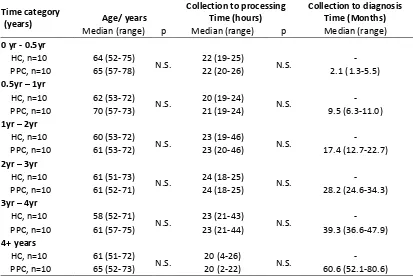
2.3.2.2 Pre-diagnostic serum samples- UKCTOCS... 41
2.3.3 Cancer cell lines, cell culture and lysate preparation ...42
2.3.3.1 Cell lines and cell culture ... 42
2.3.3.2 Lysate preparation ... 43
2.3.3.3 Measuring lysate protein concentration- Bradford Assay ... 43
2.3.4 Western Blot Analysis...43
2.3.4.1 SDS-polyacrylamide gel preparation ... 43
2.3.4.2 Sample preparation ... 44
2.3.4.3 SDS-polyacrylamide gel electrophoresis (SDS-PAGE) ... 44
2.3.5 Relative quantification of western blots ...45
2.3.6 Statistical Analysis ...46
2.3.6.1 General statistics, univariate, and multivariate analyses ... 46
2.3.6.2 Correlation analysis ... 46
2.3.6.3 Diagnostic potential of biomarkers for PDAC... 47
2.3.6.4 Software for statistical analyses... 47
2.4RESULTS ...48
v
2.4.2 Phase II- Further Validation by Western Blot (Liverpool samples) ...50
2.4.2.1 Patient demographics and clinical characteristics ... 50
2.4.2.2 Western Blot images for VDBP, RBP-4, and FINC ... 51
2.4.2.3 The serum level of VDBP in PDAC and Controls ... 52
2.4.2.4 The serum levels of RBP-4 in PDAC and Controls ... 53
2.4.2.5 The serum level of FINC in PDAC and Controls ... 54
2.4.2.6 Accuracy of candidate markers for the diagnosis of PDAC versus HC ... 55
2.4.2.7 Accuracy of candidate markers for the diagnosis of PDAC against CP ... 56
2.4.2.8 Accuracy of candidate markers for the diagnosis of PDAC against DC ... 57
2.4.2.9 Diagnostic accuracy of PDAC against all controls ... 58
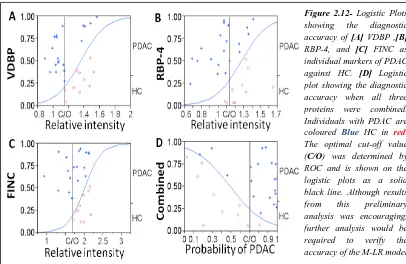
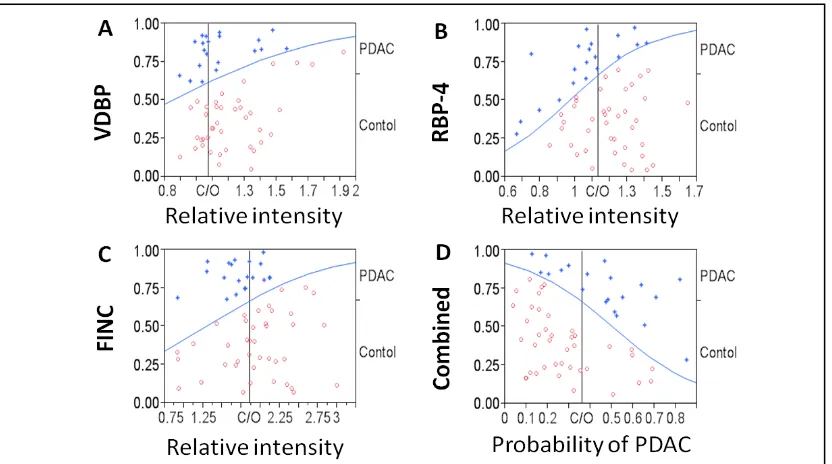
2.4.2.10 Accuracy of candidate markers for the diagnosis of PDAC against HC and CP combined ... 59
2.4.2.11 Correlation between age and candidate protein markers ... 61
2.4.3 Phase III- Validation with pre-diagnostic samples (UKCTOCS) ...62
2.4.3.1 Characteristics of the UKCTOCS samples ... 62
2.4.3.2 Example of Western Blot images for VDBP and RBP-4 ... 63
2.4.3.3 Selection of markers for validation in Phase III ... 64
2.4.3.4 The level of VDBP in pre-diagnosis samples compared to Controls ... 64
2.4.3.5 Change in the relative serum level of VDBP through time ... 65
2.4.3.6 The level of RBP-4 in pre-diagnosis samples compared to Controls ... 66
2.4.3.7 Change in the relative serum level of RBP-4 through time ... 67
2.4.4 Expression of VDBP, RBP-4, and FINC in cell lines ...68
2.4.4.1 Quantification of cell lysate ... 68
2.4.4.2 Expression of VDBP, RBP-4 and FINC in cancer cell lines ... 69
2.5DISCUSSION...70
2.5.1 VDBP, RBP-4, and FINC for the diagnosis of pancreatic cancer ...70
2.5.2 VDBP and RBP-4 as screening modalities for pancreatic cancer ...71
2.5.3 The roles of VDBP, RPB-4, and FINC in pancreatic cancer ...72
2.5.3.1 Vitamin D-Binding protein and cancer ... 72
2.5.3.2 Retinol-Binding protein and cancer ... 73
2.5.3.3 Fibronectin and cancer ... 73
CHAPTER 3- THE DIAGNOSTIC POTENTIAL OF CCGFS FOR PANCREATIC CANCER ...75
3.1INTRODUCTION ...76
3.2STUDY AIMS ...77
3.3MATERIALS AND METHODS ...77
3.3.1 Patients and Samples- The Liverpool Pancreatic Cancer Database ...77
vi
3.3.1.2 Validation Phase patient demographics and sample characteristics ... 80
3.3.2 Study design ...81
3.3.3 Quantification of Cytokines, Chemokines, and Growth Factors ...83
3.3.3.1 Sample and Standard Preparation ... 83
3.3.3.2 Coupled magnetic beads, detection antibody, and Streptavidin-PE preparation ... 84
3.3.3.3 Assay Procedure ... 84
3.3.4 Quantification of serum CA19-9 by ELISA ...85
3.3.5 Statistical Analysis ...86
3.3.5.1 General statistics, univariate, and multivariate analyses ... 86
3.3.5.2 Correlation analysis ... 86
3.3.5.3 Diagnostic accuracies of CCGFs for PDAC ... 87
3.3.5.4 Selection of candidate markers ... 87
3.3.5.5 Generating disease-predicting mathematical algorithms: M-LR and NN... 87
3.3.5.6 Diagnostic accuracies of the models ... 88
3.3.5.7 Software for statistical analyses... 88
3.4RESULTS ...89
3.4.1 Basic analysis- CCGFs as individual markers of PDAC ...89
3.4.1.1 Diagnostic accuracy of individual CCGFs for PDAC against HC ... 89
3.4.1.2 Diagnostic accuracy of individual CCGFs for PDAC against CP ... 91
3.4.1.3 Diagnostic accuracy of individual CCGFs for PDAC against biliary obstruction (DC) ... 93
3.4.1.4 Diagnostic accuracy of individual CCGFs for PDAC against all Controls ... 95
3.4.1.5 Correlation studies to determine the relationship between CCGFs ... 97
3.4.2 Discovery Phase- Diagnostic potential of CCGFs in combination ...99
3.4.2.1 Selection of CCGFs for combination ... 99
3.4.2.2 Diagnostic accuracy of the combined CCGF marker ... 102
3.4.3 Validation Phase- Validation of the disease-predicting algorithms ... 104
3.4.3.1 The diagnostic accuracy of the prediction models in the Validation Phase ... 104
3.4.4 The diagnostic accuracy of CA19-9 compared to CCGFs ... 106
3.4.4.1 Quantification of CA19-9... 106
3.4.4.2 The diagnostic accuracy of CA19-9 compared to the NN-CCGF algorithm ... 107
3.4.5 CA19-9 in combination with CCGFs ... 108
3.4.5.1 Discovery Phase- accuracy of the combined CCGF-CA19-9 marker ... 109
3.4.5.2 Validation Phase- validation of the CCGF-CA19-9 algorithms ... 111
3.4.6 The impact of each biomarker on the M-LR diagnostic algorithm ... 113
3.5IMPACT OF CLINICAL-DEMOGRAPHICAL FACTORS ON THE ACCURACY OF THE DISEASE -PREDICTING MODELS ... 114
3.5.1 Impact of Patient Age on the serum levels of candidate CCGFs ... 114
vii
3.5.3 Impact of smoking on the serum levels of candidate CCGFs ... 117
3.6DISCUSSION... 118
3.6.1 CCGFs for the diagnosis of pancreatic cancer ... 119
3.6.2 The roles of Il-4, IL-17, G-CSF, and IP-10 in PDAC and pancreatic inflammatory diseases ... 120
3.6.2.1 Interleukin 4 ... 120
3.6.2.2 Interleukin 17 ... 120
3.6.2.3 G-CSF ... 121
3.6.2.4 IP-10 ... 122
CHAPTER 4- FINAL DISCUSSION, LIMITATIONS, AND FUTURE DIRECTIONS ... 123
4.1FINAL DISCUSSION AND CONCLUSIONS... 124
4.1.1 Conclusions from the current study ... 126
4.1.1.1 Validation of iTRAQ results ... 126
4.1.1.2 Discovery and validation of CCGF markers ... 127
4.1.2 General Limitations ... 129
4.1.2.1 Limitation of sample size ... 130
4.2FUTURE DIRECTIONS ... 131
CHAPTER 5- REFERENCES ... 132
viii
Acknowledgements
The current research project was made possible by the patience and guidance from all members of the biomarker research team at the Division of Surgery and Oncology, University of Liverpool. I would like to thank all who helped with the planning and implementation of this work.
I wish to thank Dr Eithne Costello, my primary supervisor, for offering me the opportunity to undertake this research project and for her guidance throughout this year. Furthermore, I am grateful to Dr William Greenhalf, my secondary supervisor, and Brain Lane, the departmental bioinformatician, for their help with the statistical analyses performed in this study.
I would especially like to thank Dr Victoria Shaw and Dr Claire Jenkinson for teaching and supervising me in the various techniques used in this study as well as for their help and support in the preparation of this thesis. I am very grateful for Seonaid Murray (PhD student) for sharing her iTRAQ/MS data with me, which formed the foundations of my research study in chapter 2.
ix
Abbreviations
2 Dimension polyacrylamide gel electrophoresis 2D PAGE
5-Fluorouracil 5-FU
Artificial Neural Network NN
Basic Fibroblast Growth Factor FGF-b
Carbohydrate Antigen 19-9 CA19-9
Central Office of Research Ethics Committee COREC
Chronica Pancreatitis CP
Contrast-Enhanced Computed Tomography CE-CT
Control group CP, DC, and HC
Cytokines, Chemokines, and Growth Factors CCGFs
Cytotoxic T lymphocyte CTL
Difference Gel Electrophoresis DIGE
Disease Control/ Biliary Obstruction DC
Dithiothreitol DTT
Electro-spray Ionisation Tandem Mass Spectrometry ESI-MS
Enchanced Chemiluminescence ECL
Endoscopic Ultrasonography EUS
Enzyme Immunoassay EIA
Enzyme-Linked Immunosorbent Assay ELISA
Epidermal Growth Factor Receptor EGFR
European Study Group for Pancreatic Cancer ESPAC
Extracellular Matrix ECM
Fibronectin FINC
Fine needle biopsy FNB
Granulocyte Colony-Stimulating Factor G-CSF
Granulocyte-Macrophage Colony-Stimulating Factor GM-CSF
Guanosine triphosphate GTP
Healthy Control HC
Horseradish Peroxidase HRP
Human Embryonic Kideney HEK
x
Immobilized pH gradients IPGs
Inteferon Gamma Inducible Protein-10 IP-10
Inter Cellular Adhesion Molecule ICAM
Inter-alpha-trypsin-inhibitor heavy chain 4 ITIH4
Interferon Gamma IFN-
Interleukin IL
Inter-Quartile Range IQR
Intro-ductal papillary mucinous neoplasm IPMN
Isobaric Tag for Relative and Absolute Quantification iTRAQ
Isoelectric Focusing IEF
Janus Kinase JAK
KF-kB inhibitors IkB
Kruskal Wallis K-W
Liverpool Pancreatic Cancer Database LPCD
Macrophage Inflammatory Protein-1 MCP-1
Macrophage inhibitory cytokine 1 MIC-1
Matrix Metallopeptidase 9 MMP-9
Monocyte Chemotatic Protein-1 MCP-1
Mucin 1 MUC-1
Mucinous cystic neoplasm MCN
Multicentre Research Ethics Committee MREC
Multinomail Logistic Regression M-LR
National Academy of Clinical Biochemistry NACB
Nuclear Factor Kappa light chain enhancer of activated B Cells NF-B
Pancreatic Ductal Adenocarcinoma PDAC
Pancreatic intraepithelial neoplasm PanIN
Pancreatic stellate cells PSC
Phosphate Buffer Solution- Tween 20 PBST
Platelet Derived Growth Facotr Receptor PDGFR
Polyacrylamide Gel Elecrophoresis PAGE
Pre-Pancreatic Cancer PPC
Pylorus-preserving partial pancreaticoduodenectomy PP-PPD
xi
Receiver Operator Characteristics Area Under Curve ROC-AUC Regulated Upon Activation Normal T-Cell Expressed and
Secreted RANTES
Retinol-Binding Protein RBP
Signal Transducer and Activator of Transcription STAT
Smooth muscle actin SMA
Sodium Dodecyl Sulphate SDS
Stepwise Regression SR
T-Helper cells Th
Tissue inhibitors of metalloproteinases TIMPs
Transabdominal ultrasound scan USS
Transforming Growth Factor TGF
Tumour Necrosis Factor TNF
Tumour, Node, and Metastasis TNM
Tumour-associated macrophages TAMs
UK Collaborative Trial of Ovarian Cancer Screening UKCTOCS
Vitamin D-Binding Protein VDBP/DBP
xii
Abstract
Novel Markers for the Diagnosis of Pancreatic Ductal Adenocarcinoma: The Proteomic Approach. Joseph Man Fung Tang
Background: Pancreatic ductal adenocarcinoma (PDAC) is a disease of late presentation where the majority of patients present with non-specific symptoms and advanced disease. Current guidelines recommend that patients presenting with symptoms of suggestive of PDAC should be investigated by Contrast-Enhanced Computed Tomography (CE-CT). However, the radiographic features are often similar to benign diseases such as chronic pancreatitis (CP). Evidently, there is a need for a novel diagnostic biomarker, which can accurately identify patients with PDAC thereby reducing the number of otherwise unnecessary invasive procedures. Aim: The current thesis aimed to determine the potential of a number of serum proteins as diagnostic markers of PDAC.
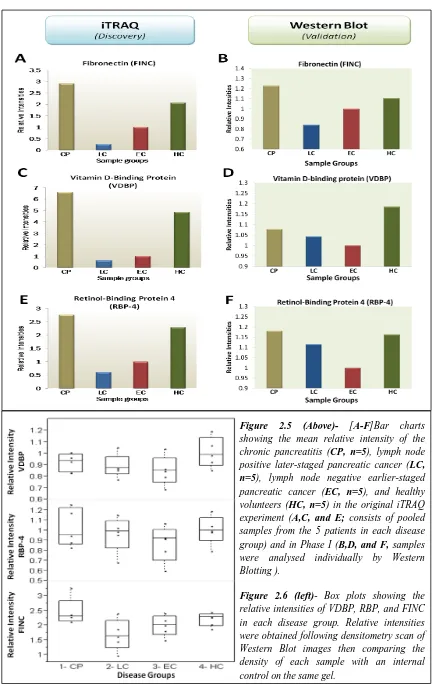
Method: Two approaches for the discovery and validation of diagnostic markers of PDAC were employed. In Chapter 2, the serum expression of three iTRAQ- Mass Spectrometry identified proteins (vitamin d-binding protein [VDBP], retinol-binding protein 4 [RBP-4], and fibronectin [FINC]) were validated by western blotting in a three-phased study consisting of 20, 60, and 120 serum samples. Their diagnostic potentials as individual and combined markers were assessed statistically. In Chapter 3, the serum concentrations of 27 cytokines, chemokines, and growth factors (CCGFs) in 90 PDAC and 90 controls were quantified using the multiplex cytokines assay and the potential of individual CCGFs for the diagnosis of PDACs were assessed. One-hundred and twenty serum samples were randomly allocated to discovery where stepwise regression was used to select independent CCGF markers of PDAC. These were then combined into a single marker and the diagnostic accuracy for PDAC assessed. Finally, validation utilised the remaining sixty samples to investigate the accuracy of the combined CCGF marker for the diagnosis of PDAC. Results: Results from Chapter 2 showed that the serum concentrations of VDBP, RBP-4, and FINC were significant decreased in PDAC with ROC-AUCs of >0.74 against CP and healthy volunteers (HC). However, their diagnostic accuracies were decreased (ROC-AUC <0.63) in the presence of individuals with biliary obstruction (disease controls, DC). Combining all three markers increase the diagnostic accuracy for PDAC against HC and CP (ROC-AUC, 0.91) but not against DC (ROC-AUC, 0.74). Further validation using pre-diagnostic serum samples showed that a small subset of patients exhibited a gradual decline in the serum concentration of VDBP and RBP-4 closer to diagnosis.
Results from Chapter 3 showed that fourteen CCGFs were differentially expressed in PDAC compared to controls, of which, IFN-was the most significant individual marker of PDAC with comparable accuracy to CA19-9. Discovery analysis identified four independent markers of PDAC: IL-4, IL-17, G-CSF, and IP-10. When combined, an ROC-AUC of 0.99 was achieved. Validation of the combined CCGF marker in yielded encouraging results of ROC-AUC >0.95.
1
Chapter 1
General Introduction:
2
1.1 Anatomy of the pancreas
The pancreas is a retroperitoneal organ, which can be anatomically divided into the head, neck, body, and tail (Figure 1.11)2-4. The head of the pancreas lies within the curvature of the duodenum and overlies the body of the second lumbar vertebra and the aorta3. The neck represents a constriction, which connects the head to the body of the pancreas3. It can be identified by the superior mesenteric vessels, which pass over the uncinate process and then posteriorly behind the neck of the pancreas4. The tail of the pancreas extends towards the spleen and connects with the splenic flexure of the colon4. The pancreas receives its blood supply from the lineal and the pancreaticoduodenal branches of the hepatic and superior mesenteric arteries and it is drained by the lineal and superior mesenteric veins2-4.
Figure 1.1-Anatomy of the pancreas1. By courtesy of Encyclopaedia Britannica, Inc.,
copyright 2003; used with permission. The pancreas is a retroperitoneal organ that is situated in front of the third lumbar vertebrae and is in close proximity to a number of important organs and vessels including the liver, stomach, small intestines, spleen, bile duct, aorta, vena cava, and superior mesenteric artery and vein.
This text box is where the unabridged thesis included the following third party copyrighted material:
Encyclopaedia Britannica. Anatomy of the Pancreas. [Image] [2nd July, 2010].
3
Structurally, the pancreas is composed of lobules connected by areola tissue3-4. Each lobule consists of multiple acini each receiving one of the ultimate ramifications of the main pancreatic duct (Figure 1.11). Histologically, two broad types of cells can be found in the pancreas parenchyma: exocrine and endocrine cells. Pancreatic exocrine cells are responsible for secreting digestive enzymes into the lumen of the acini, which in turn drains into the main pancreatic duct and ultimately into the duodenum2-4. Endocrine cells of the pancreas form clusters (islets of langerhans), which are embedded within the exocrine tissue and are responsible for secreting hormones such as insulin and glucagon into the systemic circulation2-4.
1.2 Introduction to Pancreatic Cancer
1.2.1 Epidemiology of Pancreatic Cancer
Pancreatic cancer is the eleventh most commonly diagnosed cancer in the United Kingdom and it has an incidence rate of over 7,500 new cases per annum5. Furthermore, it is the sixth leading cause of cancer mortality in 2007 with a reported 5-year overall survival rate of less than 5%6. The lifetime risk of developing pancreatic cancer for both men and women is 1/86 with the majority of cases occurring in patients over 65 years of age. Interestingly, studies have observed that pancreatic cancer is more frequent in the black population compared to the Caucasian and Asian populations7. Whilst the reasons for this difference remain unclear, studies have identified a higher prevalence of risk factors such as smoking, diabetes, obesity, and vitamin D insufficiency in the black population, which may explain this observation7-8.
4
Another frequently identified disease-related risk factor is obesity. Despite various studies reporting an increased risk of pancreatic cancer in obese individuals, the exact role of obesity in the development of pancreatic cancer remains unclear13-15. However, some studies have suggested that obesity may be indirectly linked to cancer via inflammatory responses16.
The role of diabetes mellitus in pancreatic cancer is somewhat difficult to evaluate because although some studies demonstrated that patients with >10-year history of type 2 diabetes are 1.5 times more likely to develop pancreatic cancer17-19, other studies indicated that new onset diabetes is an early symptom in up to a third of all pancreatic cancer patients20.
Genetic predisposition plays an important role in the development of pancreatic cancer. Studies have reported that the relative risk of pancreatic cancer is increased by as much as 57-fold in families with four or more affected members21. Furthermore, a number of studies have reported that various germline diseases such as familial Peutz-Jeghers syndrome and hereditary pancreatitis are associated with a very high risk of pancreatic cancer development7, 22. Indeed, Giardiello et al. reported that individuals with familial Peutz-Jeghers syndrome are 132 times more likely to develop pancreatic cancer23.
5
Box 1.1- Summary of Factors Associated with Pancreatic Cancer7 Pancreatic cancer typically occur in patients >65 years of age.
The black population has an increased risk of pancreatic cancer compared to Caucasians and Asians.
20-25% of pancreatic cancers are attributable to cigarette smoking, which is the most frequent but also the most preventable risk factor for pancreatic cancer.
Benign pancreatic diseases such as chronic pancreatitis and type II diabetes mellitus are independent risk factors for developing pancreatic cancer
5-10% of pancreatic cancers are associated with a germline disease
Non-O blood type has been associated with an increased risk of pancreatic cancer25.
Several hallmark genetic mutations have been identified in pancreatic cancer including the KRAS2 oncogene, which is present in 90-95% of all pancreatic cancers26.
1.2.2 Pathogenesis of Pancreatic Cancer
The majority of pancreatic cancers are ductal adenocarcinomas (PDACs)27. Microscopically, this type of cancer is characterised by a glandular structure with a ductal appearance and varying degrees of cellular atypia and differentiation27. Whilst the development of PDAC is generally regarded as sporadic, some studies have proposed that PDAC may arise from precursor lesions, which are cells with an atypical but non-cancerous cellular morphology that are frequently observed in association with PDAC27-28. Three types of PDAC precursor lesions have been proposed: pancreatic intraepithelial neoplasm (PanIN), mucinous cystic neoplasm (MCN), and intra-ductal papillary mucinous neoplasm (IPMN) 28-30.
6
Box 1.2- Grading of Pancreatic Intraepithelial Neoplasms32-33
PanIN Grade Description
PanIN-1A Flat mucinous epithelium without cellular atypia PanIN-1B Papillary mucinous epithelium without cellular atypia
PanIN-2 increasing signs of cellular atypia and a prevalence of papillary architecture PanIN-3 Carcinoma in situ/ intra-ductal carcinoma
MCNs are large mucin-producing epithelial cystic lesions that have a distinctive ovarian-type stroma with a variable degree of epithelial dysplasia and focal regions of invasion27, 30, 34-39. The majority of MCNs arise from the body and tail of the pancreas and do not communicate with the pancreatic ductal system except in the presence of erosions or fistulous tracts27, 30, 34. The association between MCN and PDAC is based on observational studies demonstrating the presence of invasive tubular/ductal adenocarcinoma in approximately one-third of all resected MCNs and on studies showing several common genetic mutations between MCN and PDAC (including the KRAS-2 oncogene, TP53, and SMAD4)28. However, it should be noted that there are some controversies regarding the role of MCNs as precursors of pancreatic cancer due to the lack of direct evidence demonstrating the progression of MCNs to PDAC. This together with the fact that individuals with invasive ductal adenocarcinoma from resected MCNs have a much better prognosis (5-year survival, ~60%) compared to the reported prognosis for sporadic PDACs (5-year survival, <25%), suggest that pancreatic cancer associated with MCNs should be regarded as a separate entity compared to sporadic PDAC35.
IPMNs account for 3-5% of all pancreatic masses and are the most common type of pancreatic cystic lesions 27, 40 and they are defined by the presence of mucin-filled cystic lesions ≥1cm in the main pancreatic duct and/or its secondary branches27
7
non-IPMN associated PDACs, the adenocarcinomas associated with the mucinous type IPMN is characterised by neoplastic epithelial cells “suspended” in large pools of extracellular mucin and is associated with a better prognosis42-44. Similar to PanINs, the association between IPMNs and PDAC is only based on histological observational studies and studies indicating that IPMNs and PDACs share a number of genetic mutations (e.g. KRAS2, p16, TP53, and SMAD4)28. Therefore, in absence of evidence directly demonstrating the progression of IPMNs to PDAC, the role of IPMN in the development of PDAC will remain a controversial topic.
1.2.3 Molecular Hallmarks of Pancreatic Cancer
Pancreatic carcinogenesis is a complex process involving dynamic changes in the genome and molecular pathways, which together drive the progression from precursor lesions to invasive cancer45. Although the exact mechanism underlying pancreatic cancer formation is yet to be fully understood, research efforts in the past decade has significant improved our understanding of this disease. Recent studies have identified several key genetic mutations and signalling pathways, which have been found to be essential in pancreatic cancer tumourigenesis26-27.
1.2.3.1 K-Ras signalling pathway
8
pathway alone is insufficient to cause malignant transformation of pancreatic cells
26-27, 47
. It has been proposed, therefore, that co-existing aberrations such as epigenetic silencing of tumour-suppressors or activation of other oncogenic pathways must also be present26-27, 47.
1.2.3.2 Tumour suppressor genes and pathways
The deletion of the p16 INK4A gene locus in up to 95% of cases and the alteration or deletion of the p53 gene locus in 50-75% of cases are the most frequently reported mutations observed in pancreatic cancer27. Tumour suppression by both of these genes is made possible through the inactivation of CDK4/6 and CDK2 thereby inhibiting the phosphorylation of the retinoblastoma protein and subsequently preventing cell cycle progression through the G1-S checkpoint26-27. Furthermore, TP53 also contributes to tumour suppression by regulating cell cycle and promoting apoptosis in cells when DNA damage is sustained.
Another common mutation is the deletion of the Smad4 gene, which is found in 55% of pancreatic cancers26-27. Smad4 is an important downstream mediator for the Transforming Growth Factor (TGF- signal pathway (an inhibitory pathway for PDAC) and is responsible for the transmission of TGF- signals into the nucleus thereby regulating the expression of cancer-associated genes26-27. In addition, studies have demonstrated that the disruption of TGF- signalling pathway facilitates cancer cell growth, differentiation, and migration26-27.
1.2.3.3
Embryonic Signalling pathwaysA number of studies have reported that embryonic signalling pathways such as Hedgehog and Notch are reactivated in pancreatic cancer. In particular, over-expression of the Indian and/or sonic Hedgehog ligands have been associated with enhanced tumour progression26-27, 49. Moreover, recent studies have demonstrated that the expression of the sonic Hedgehog ligand in transgenic mice results in the formation of PanIN-like lesions50.
9
invasive pancreatic cancer52. In addition, Notch signalling has been shown to promote neo-vascularisation of tumours51, 53.
1.2.4 Symptoms and Signs of Pancreatic Cancer
For the majority of patients, pancreatic cancer remain undiagnosed until it is at an advanced stage and at initial presentation, symptoms are often non-specific (Box 1.3)21. Unlike other cancers, for example prostate and breast cancer, the anatomical location of the pancreas means that pancreatic tumours cannot usually be felt on physical examination3. Therefore, the suspicion of pancreatic malignancy relies heavily on systemic symptoms and signs, which are often indications of disparate disease54-55.
The majority of symptoms can be explained in terms of compression of anatomical structures within or adjacent to the pancreas. In particular, tumours arising from the head of the pancreas (approximately 70%) can cause obstruction of the duodenum, pancreatic duct, and common bile duct54-55. When the main pancreatic duct is obstructed, activation of digestive enzymes secreted by the pancreas may lead to auto-digestion of the pancreatic parenchyma and subsequently pancreatitis whereas bile duct obstruction is likely to result in cholestasis and jaundice54-55. Furthermore, pancreatic cancer may cause the dysfunction of pancreatic endocrine cells leading to dysglycaemia20, 54-55. It is therefore important for clinicians to consider pancreatic cancer as a differential diagnosis in patients presenting with acute pancreatitis or new onset diabetes20.
10
Box 1.321, 54- Signs and symptoms of pancreatic cancer and confounding diseases
Symptom in PDAC Examples of confounding diseases exhibiting the same symptom
Anorexia Bacterial/ viral infections; most cancers, Chronic Pancreatitis; gallstone related biliary obstruction
Weight Loss Most cancers; acute infections; diabetes; Chronic Pancreatitis Jaundice Biliary obstruction, acute and chronic pancreatitis; liver failure Hepatomegaly Hepatitis, heart failure; liver cirrhosis
Peripheral lymphadenopathy Heart failure, renal failure; other cancers; medications; malnutrition
Abdominal Pain Chronic Pancreatitis; gallstone related Biliary obstruction; peptic ulcers; inflammatory bowel disorders; GI cancers
Anaemia Most cancers; autoimmune diseases; B12 deficiency; malabsorption; GI bleeding
Fatigue Most cancers; diabetes; obesity heart failure; anaemia; depression
Ascites Liver metastasis; most cancers; malnutrition; cirrhosis (liver or biliary); heat failure
Acute pancreatitis Alcoholic pancreatitis; acute exacerbation of chronic pancreatitis; cancer of biliary tree or duodenum; gallstone-related biliary obstruction
1.2.5 Diagnosis and Staging of Pancreatic Cancer
In patients with suspected pancreatic cancer, subsequent investigations are designed to provide information regarding the presence, location, staging, and resectability of the disease21, 26, 54, 56. A number of modalities have been developed for the diagnosis and staging of pancreatic cancer. The initial investigation may be a simple trans-abdominal ultrasound scan (USS), which may be able to identify signs of late pancreatic cancer such as biliary dilatation and liver metastasis57-58. However, USS is not useful in the diagnosis of early pancreatic cancer57 and therefore, the preferred diagnostic investigation is contrast enhanced multi-slice computed tomography (CE-CT) scan, which is able to assess the location, size and sometimes the type of lesion in addition to providing evidence for the staging and resectability of the tumour57, 59. In general, contrast-enhanced CT scans are 80-90% accurate in predicting surgical resectability59. Other investigations such as endoscopic ultrasonography (EUS), fine needle biopsy (FNB), and Laparoscopy may be useful in confirming the presence of smaller or equivocal lesions seen on CT scan60. Nevertheless, the final diagnosis of PDAC can only be made histologically21.
11
that patients with positive lymph node involvement (N1, staged 2B or above) have considerably poorer survival compared to patients with N0 status62-66.
1.2.6 Management and prognosis of pancreatic cancer
1.2.6.1 Advanced pancreatic cancer
Over 75% of pancreatic cancers are inoperable due to localised advanced disease, metastases, or performance status67-68. The treatment for this group of patients is therefore directed at symptom control57. Pain is one of the most commonly reported symptoms of inoperable pancreatic cancer and it is usually controlled by oral opiate preparations69. Recent studies have suggested that celiac plexus block may improve pain control in selected patients but it has an insignificant effect on the quality of life and survival70-72. Furthermore, patients with advanced pancreatic cancer invariably develop weight loss due to pancreatic exocrine insufficiency, obstruction of the common bile duct, or cancer-associated cachexia26. Whilst there is no treatment for the latter condition, the former two can be effectively treated by pancreatic enzyme supplements and stenting of the bile duct26, 73.
Chemotherapy plays an important role in improving the survival and quality of life of patients with advanced pancreatic cancer74-75. Unlike other cancers, PDACs are highly resistant to chemotherapy with a relatively low response rate of 10-25%74. However, studies have shown that treatment with chemotherapeutic agents such as 5-Fluorouracil (5-FU) and Gemcitabine can significantly improve the median survival of patients with advanced pancreatic cancer74. Evidence from a randomised Box 1.4- TNM classification system and staging for pancreatic cancer61
TNM Description Stage
with N0
Stage with N1 Tx Primary tumour cannot be assessed -
T0 No evidence of primary tumour -
Tis Carcinoma in situ -
T1 Tumour limited to pancreas, 2cm or less in greatest dimension 1A 2B T2 Tumour limited to pancreas, more than 2cm in greatest dimension 1B 2B T3 Tumour extends beyond pancreas, but without involvement of celiac axis or
superior mesenteric artery 2A 2B
T4 Tumour involves celiac axis or superior mesenteric artery 3 3 Nx Regional lymph nodes cannot be assessed
N0 No regional lymph node metastasis N1 Regional lymph node metastasis M0 No distant metastasis
12
controlled trial by Burris et al. 74 reported not only that treatment with Gemcitabine significantly improves the 1 year survival rate compared to 5-Fluorouracil (18% versus 2%, respectively), this trial also observed a milder toxicity and a better clinical response (24% versus 5%) with Gemcitabine. This subsequently saw the replacement of 5-FU with Gemcitabine as the preferred drug26. In addition, a number of randomised controlled trials have demonstrated that for patients with advanced pancreatic cancer, the combination of Gemcitabine with newer chemotherapeutic agents such as Capecitabine (a 5-Fluorouracil pro-drug) and Oxaliplatin is associated with a better prognosis75-80. In particular, a phase III randomised control trial by Cunnigham et al., reported a significant improvement in progression-free survival for patients with advanced PDAC treated with Gemcitabine -Capecitabine combined chemotherapy compared to Gemcitabine alone (hazard ratio 0.78, p=0.004)80.
1.2.6.2 Resectable pancreatic cancer
In the remaining 25% of pancreatic cancer patients, where surgical resection with intention-to-treat is deemed possible, the aim of surgery is to achieve complete clearance of the tumour both macroscopically and microscopically (R0 resection)81-82. However, in practice, a large proportion of patients have incomplete resection of the tumour (R1, microscopically; R2, macroscopically) 82. The most commonly employed surgical procedure for the removal of pancreatic tumours located in the head of the pancreas is pylorus-preserving partial pancreaticoduodenectomy (PP-PPD) whereas tumours located in the body or tail undergo distal pancreatectomy with resection of the spleen and hilar lymph nodes67.
13
this finding and, in addition, reported comparable survival rates in patients treated with adjuvant 5-FU compared to adjuvant Gemcitabine .
1.3 Biomarkers for pancreatic cancer
1.3.1 Introduction to biomarkers
A biomarker is defined by the National Institute of Health91 as “a characteristic that is objectively measured and evaluated as an indicator of normal biologic process, pathogenic process, or pharmacologic responses to a therapeutic intervention”. The abundance or scarcity of cancer biomarkers in cancer relative to non-cancer conditions (e.g. inflammatory diseases and in health) may be an indication of changes to cellular biology in carcinogenesis. Therefore, it is the aim of cancer biomarker studies to identify these differentially expressed molecules and to assess their clinical usefulness as a screening, diagnostic, and/or prognostic modality for cancer. There are many samples, which can be used for the discovery of biomarkers including blood derivatives, pancreatic juice, tissue, saliva, and urine92. Of these, blood plasma or serum is most widely used in biomarker studies because they are readily accessible, minimally invasive to collect, generally acceptable to patients, and are potentially rich sources for most types of biomarkers92.
1.3.1.1 The need for diagnostic biomarkers of pancreatic cancer
14
reduced. There is also the possibility that biomarkers can be employed to detect the presence of early pancreatic cancer in otherwise asymptomatic individuals. Subsequently, this would mean that patients with PDAC are diagnosed earlier thereby increasing their chances of having operable disease and therefore improving the prognosis.
1.3.2 Current biomarker of pancreatic cancer: CA19-9
The tumour associated antigen, Carbohydrate Antigen 19-9 (CA19-9), was first described in pancreatic cancer by Koprowski et al. in 198193. Approximately 95% of the general population are able to synthesise CA19-9 while the remaining 5-10% of the population, due to genetic differences, have a Lewisa-b- phenotype meaning that they are unable to synthesise CA19-994.
1.3.2.1 CA19-9 in screening and diagnosis of pancreatic cancer
CA19-9 was initially evaluated as a potential diagnostic marker exclusively for pancreatic cancer; however, studies in the past two decades have reported elevated levels of CA19-9 in other malignant tumours including gastric, ovarian, hepatocellular, and colorectal cancers as well as benign pancreaticobiliary diseases such as chronic pancreatitis, cholangitis, and choledocholithiasis23, 95-99. Furthermore, a recent study by Morris-Stiff et al. demonstrated a direct correlation between serum levels of CA 19-9 and bilirubin 100. This finding, together with evidence from clinical studies demonstrating that CA19-9 is not sufficiently sensitive for the detection of early or small-diameter pancreatic cancer, suggest that CA19-9 should not be used alone as a screening modality for pancreatic cancer96, 101-102.
15
1.3.2.2 CA19-9 in prognosis, surveillance, and assessment of chemotherapy
Mounting evidence shows that serum concentrations of CA19-9 correlate with the prognosis of resected pancreatic cancer patients103-106. In a retrospective study by Ferrone et al., it was reported that a CA19-9 level of <200 kU/l or a decrease in CA19-9 levels following surgical resection are independently associated with better prognosis107. Recently, the NACB guidelines recommend that whilst CA19-9 should be considered for risk stratification in patients with pancreatic cancer and that high concentrations are indicative of poor outcome, the guidelines emphasised that CA19-9 is only one of many factors influencing the prognosis and treatment planning of pancreatic cancer102.
CA19-9 is also used in postoperative surveillance of pancreatic cancer96, 108. Several studies have shown that sequential measurements of CA19-9 may be able to detect recurrent/metastatic pancreatic cancer before clinical or radiological evidence95-96, 108. In addition, there is a consensus that a declining CA19-9 level following initiation of chemotherapy is associated with a better outcome compared to no decline96. Based on this evidence, the NACB recommends that serial measurements of CA19-9, along with radiological imaging at regular intervals may be used for both post-operative surveillance and the monitoring of therapy102.
1.3.3 Other markers of pancreatic cancer
16
accuracy compared to CA19-9 alone111-112. However, considering the relatively small sample size in these studies and in view of recent evidence demonstrating the confounding effects of biliary obstruction on the diagnostic accuracies of some proteomic biomarkers, further validation must be performed before these novel markers can replace the role of CA19-9 in pancreatic cancer.
1.3.4 Techniques for biomarker discovery
There are two main approaches to biomarker discovery: The genomic approach, which focuses on identifying genetic mutations or changes in gene expression on micro RNA levels and the proteomics approach, which mainly examines the difference in protein levels between PDAC and benign conditions. The following sections will describe the various techniques used in the discovery of proteomic biomarkers including 2D polyacrylamide gel electrophoresis (2D PAGE) and isobaric Tag for Relative and Absolute Quantification (iTRAQ) in addition to common techniques used in the validation of biomarkers such as western blotting and enzyme-linked immunosorbent assay (ELISA). Furthermore, the current section will describe the use of a microsphere-based multiplex cytokines assay, for both the discovery and validation of biomarkers for pancreatic cancer.
1.3.4.1 2D-PAGE
The technique of two-dimensional polyacrylamide gel electrophoresis (2D-PAGE) was first described by O‟Farrel et al. and Klose in 1975113-116. The original technique of 2D-PAGE described by these authors consisted of protein separation by carrier-ampholyte-generated pH gradients in the first dimension (isoelectric focusing, IEF) followed by separation by protein molecular weight in the second dimension (SDS-PAGE) 113-116.
17
it was not long before researchers recognised that the original 2D-PAGE method suffered from a number of limitations including the lack of reproducibility, low resolution, inability to separate very acidic and/or very basic proteins, and limited sample loading capacity116, 118. In an effort to overcome these limitations, Görg et al.120 introduced a new gradient for first dimension separation in the 1980s- the immobilized pH gradients (IPGs) 120-122. The use of IPG enabled an extremely stable pH gradient to be generated, which subsequently improved isoelectric focusing and the reproducibility of the technique118. Later studies further enhanced this technique by introducing narrow-overlapping IPGs, which enabled a higher resolution as well as permitted the detection of lower abundance proteins and proteins with isoelectric points ranging from pH 2.5 to pH 12123-125.
Research on 2D-PAGE and its related technologies in the past decade has been focused on improving the solubilisation and separation of hydrophobic proteins, the display of low abundance proteins, and achieving more reliable protein quantification by either fluorescent dyes or isobaric tags118. Indeed, the recent development of the difference gel electrophoresis (DIGE) technology has enabled mixed samples to be analysed on a single 2-DE gel via differential fluorescent dye labelling126.
1.3.4.2 Mass Spectrometry and iTRAQ
Isobaric Tag for Relative and Absolute Quantification (iTRAQ) is a chemical labelling multiplexing technique, which quantifies the concentration of proteins using mass spectrometry127-129. iTRAQ coupled with electro-spray ionisation tandem mass spectrometry (ESI-MS/MS) is becoming increasingly popular over the past 5 years in the field of biomarker research due to its ability to identify and quantify hundreds of proteins in a single experiment128. Indeed, a previous study from the Division of Surgery and Oncology, University of Liverpool, have identified over 300 differentially expressed proteins in the serum of pancreatic cancer patients compared to controls129. In Chapter 2, the accuracies of three iTRAQ/MS identified proteins as diagnostic markers for pancreatic cancer is provided.
18
PDAC) is labelled with a different tag with a unique reporter group of a specific mass, which is released during mass spectrometry through collision-induced dissociation thus allowing the association of a peptide with a specific sample group. The detection part of iTRAQ-MS involves the vaporisation and ionisation of the labelled peptides through an electromagnetic field. The resulting trajectory data and mass-to-charge ratio data from the MS analysis can then be used to identify the protein origins of these peptides. The different tags allow the relative quantification of peptides between samples, for example, a given peptide labelled with the disease-specific tag could be four times more abundant than the same peptide labelled with the control specific tag, indicating that the peptide is more abundant in the disease than the controls.
Mass spectrometry based methods such as iTRAQ offers the identification and quantification of numerous proteins in a single experiment. This is clearly advantageous for biomarker studies, where several potential biomarkers can be identified upon data comparison between the disease and control groups. However, there are two major drawbacks for this technique: iTRAQ requires a large amount of sample and the sample preparation stage may span require weeks to complete especially in the case of serum, where abundant protein depletion is necessary. An acceptable solution to this problem is the use of pooled samples but this is not without its own disadvantages. Although pooled samples present an „average‟ profile for the disease group in question, this “average” is very susceptible to skewing by an outlier with unusually high or low expression of a particular protein. Therefore, it is important to validate the results from pooled samples by other proteomic methods such as western blotting or ELISA.
1.3.4.3 Western blotting
19
antibodies, and better labelling/detection methods. Indeed, novel detection methods for western blots such as infrared labelling have been of increasing interest to researchers. In a recent study comparing tradition chemiluminescence with infrared detection131, the authors described many potential advantages to infrared detection such as the ability to simultaneously detect two proteins and the loss-less preservation of signal long periods of time. Due to its higher detection sensitivity however, the resulting blot may in practice show more non-specific bands compared to traditional chemiluminescence and therefore may not be desirable.
The technique of western blotting involves two phases: sodium dodecyl sulphate (SDS) polyacrylamide gel electrophoresis (PAGE) and immunofluorescence detection. The purpose behind SDS-PAGE is to separate uniformly charged, denatured proteins according to their molecular weight through the use of an electric current. Briefly, denatured proteins are reduced by SDS (i.e. given a uniform charge) and are subjected to an electric current. Proteins with a lower molecular weight will travel through the polyacrylamide gel at a faster rate compared to heavier proteins, therefore, with time, lighter proteins will travel a greater distance compared to heavier proteins. The proteins in the polyacrylamide gel are then transferred and immobilised on a nitrocellulose membrane in preparation for immuno-detection. In the detection phase, a primary antibody is used to bind to the protein of interest and a horseradish peroxidase (HRP) secondary antibody is used to bind to the primary antibody. This is necessary because the HRP on the secondary antibody allows chemiluminescence detection by catalyzing the reaction between two luminescence substrates.
20
loss of proteins during the transfer step and therefore direct comparison between blots is not recommended unless internal standards are rigorously used. Secondly, the primary antibody, which is engineered to recognise a specific amino acid sequence unique to the protein of interest, may have a variable ability in recognising the same sequence after the protein has been denatured. Finally, the quantification of bands from scanned ray films must be interpreted with care because the intensities of x-ray scanned bands follow a sigmoid-like correlation with the actual concentrations of the protein of interest in a sample132. This means that the difference in band intensity is likely to be less distinct when compared to the difference in actual protein concentration.
1.3.4.4 Enzyme-Linked Immunosorbent Assay (ELISA)
Enzyme-linked immunosorbent assay (ELISA), sometimes referred to as enzyme immunoassay (EIA), is another technique frequently employed in the quantification of blood-based proteins. Although it is widely used in the research setting, it is also frequently employed in clinical settings especially in diagnostic medicine. Interestingly, the technique of ELISA is the result of synthesized knowledge from studies published by a number of researchers from 1960 to 1971133-135. As with western blotting, very little has changed in the original method since 1971 other than the development of better antibodies and more sophisticated/automated apparatus, which play a pivotal role in minimised human error and improving data reproducibility. There are a number of variations to the ELISA technique including direct, indirect, sandwich, competitive, and multiplex assays however, the principle behind the variations remains the same.
21
There are many advantages in using ELISA for protein quantification, for example, the assay itself is simple and relatively quick to perform, each analysis simultaneously quantifies over 40 samples, and the resulting data are readily reproducible. However, as with western blotting, one of its basic requirements is the availability of an antibody specific to the antigen of interests. In addition, the serum sample requirement for a typical ELISA (25 µL) is over 60 times greater than a typical western blot analysis (0.4µL) and it is usually more expensive (per sample) to perform.
1.3.4.5 Multiplex Assays (LUMINEX)
Researchers and biomedical companies in the past decade have sought to overcome the various disadvantages of conventional ELISAs136-137. One of the ways in which this is achieved is by combining the ELISA technology with existing biochemical techniques such as microspheres, flow cytometry, and laser detection136-137. In chapter 3 of the current MPhil thesis, I described the use of the LUMINEX multiplex assay to analyse 27 different cytokines, chemokines, and growth factors in serum samples. A brief description of this technique is given below (see section 3.3.3 for detailed protocol).
22
23
1.4 Role of CCGFs in inflammation and cancer
The role of cytokines, chemokines, and growth factors (CCGFs) in pancreatic inflammatory diseases (e.g. acute and chronic pancreatitis) has been reported by many studies138-144. More recently, evidence from experimental and epidemiological studies have shown that CCGFs play a pivotal role in mediating cancer-related inflammation144-150. Indeed, a recent review by Colotta et al. suggested that cancer-related inflammation may be considered as the seventh hallmark of cancer150 and that an inflammatory tumour microenvironment contributes to the proliferation, angiogenesis, survival and metastasis of certain cancers143, 151-154.
1.4.1 The relationship between inflammation and cancer
24
1.4.2 Pathways linking inflammation and cancer
1.4.2.1 NF-
NF-B is a family of transcription factors consisting of five members including NF-B1, NF-B2, RelA, RelB, and c-Rel162-163. Members of the NF-B family share a 300 amino acid region, which gives NF-B the characteristic ability to form dimmers and to bind with other NF-B proteins, DNA, and NF-B inhibitors (IB)164. In normal eukaryotic cells, NF-B is usually in a quiescence state; however, NF-B can be activated by a number of stimuli including cellular stress, inflammatory mediators (e.g. TNF- and IL-1), and bacterial/viral antigens162-163. The activation of NF-B promotes the transcription of a number of inflammatory mediators including IL-1, IL-1, and TNF-, which may in turn stimulate the NF-B pathway in a positive feedback loop and may lead to a longer and more severe inflammatory response162-163. Aberrant activation of the NF-B pathway has been associated with a number of cancers162-163, 165-168. It has been proposed that the continuous activation of NF-B promotes oncogenesis by enhancing the transcription of genes encoding for cytokines (e.g. TNF-), chemokines (e.g. IL-8), and growth factors (e.g. Vascular Endothelial Growth Factor, VEGF) as well as anti-apoptosis genes162-163, 166. Furthermore, evidence from a number of in vitro and in vivo studies has demonstrated that NF-B can promote tumour metastasis by regulating the expression of cell adhesion molecules (e.g. ICAM-1), cell surface proteases (e.g. MMP-9), and plasminogen activators (e.g. urokinase-type plasminogen activator).
1.4.2.2 STAT3
25
activated in malignant cells and it plays a crucial role in regulating the expression of genes associated with cancer-related inflammation in the tumour microenvironment169, 175. STAT3 can be activated via a number of intrinsic and extrinsic mechanisms. In particular, STAT3 can be activated by a number of upstream receptors including cytokine receptors (e.g. IL-6R, IL-10R) and growth factor receptors (e.g. Platelet-derived growth factor (PDGF) receptor and EGFR)169,
174
. Indeed, recent studies have demonstrated that IL-6 can activate STAT3 through the activation of Janus Kinase (JAK), which ultimately leads to the up-regulation of anti-apoptotic genes and tumour cell survival170, 173, 176-178. Interestingly, IL-10 has been shown to exhibit anti-tumour activity by inhibiting the NF-B pathway179. However, recent evidence has also indicated that IL-10 may play a dual role in cancer by being an activator of STAT3 thereby indirectly promoting cancer proliferation, angiogenesis, survival, and metastasis through promoting the transcription of anti-apoptotic genes and growth factors169, 180.
Furthermore, in view of the common role of STAT3 and other cancer-associated transcription factors in cancer-associated inflammation, it is somewhat unsurprising that the two transcription factor pathways should interact with each other on many levels. For example, recent studies have suggested that the activation of NF-B promotes the expression of IL-6 gene, which in turn is an activator of STAT3. In contrast, the activation of STAT3 prevents RELA of the NF-B family from leaving the nucleus thereby contributing to the persistent NF-B activation in cancer181.
1.4.2.3 HIF 1-alpha
26
HIF are a family of transcription factors consisting of six members (HIF-1, HIF-1, HIF-2, HIF-2, HIF-3, and HIF-3), which are responsible for promoting neo-angiogenesis and wound healing182. One of the best-characterized HIFs is the heterodimer protein, hypoxia-inducible factor-1. HIF-1 consists of two subunits, HIF-1 and HIF-1183-184. Whilst both subunits are expressed in all cells, HIF-1 is virtually undetectable in well-oxygenated cells due to its rapid degradation by ubiquitination183-184. In contrast, during cellular hypoxia, there is an accumulation of HIF-1, which undergoes dimerization with HIF-1 and ultimately promoting the transcription of various angiogenesis-related proteins including vascular endothelia growth factor (VEGF)183-184.
Although the exact role of HIF-1 is not yet fully understood, a number of studies have demonstrated that HIF-1 expression is positively correlated to VEGF expression, tumour size, and tumour stage (particularly stage III and IV)183. Furthermore, there is increasing evidence suggesting that HIF-1 may enhance the expression of motility factors in pancreatic cancer cells and may therefore play a role in promoting metastasis183.
1.4.3 Tumour microenvironment, cytokines and cancer
27 1.4.3.1 Immune cells, cytokines, and cancer
Tumour-associated macrophages (TAMs) are a major source of inflammatory cytokines the tumour microenvironment189-191. In contrast to normal macrophages, these tumour-recruited phagocytes are unresponsive to their normal regulatory mechanisms have been associated with six tumour-promoting extrinsic traits: chronic inflammation, matrix remodelling, tumour cell invasion, intravasation (invasion of blood vessels), angiogenesis, and distant metastasis192. Indeed, studies on the transition of carcinoma in-situ to invasive cancer have demonstrated the presence of TAMs at points of basement-membrane breakdown192-193. This finding, together with evidence from multi-photon imagining studies, suggests that tumours can manipulate TAMs to facilitate invasion and migration through the surrounding stroma192, 194. TAMs are also an important producer of VEGF, a key component for neoangiogenesis in tumours179, 193, 195. It has been proposed that cytokines produced by hypoxic cancer cells are responsible for the recruitment of macrophages193, 196. The induction of hypoxic inducible factor 2 alpha (HIF-2a) in recruited macrophages promotes the expression of vascular endothelial growth factor (VEGF) and angiogenesis193, 195. Furthermore, VEGF also acts as a chemo-attractant for macrophages thus creating a positive feedback loop for rapid vascularization in tumours193.
In contrast to TAMs, T cells may play a promoting or suppressing role in cancer depending on their effector functions186. Clinical and experimental evidence indicates that the anti-tumour function of T lymphocytes is mediated by both cytotoxic mechanisms and cytokines186. Correspondingly, studies have demonstrated that increased activated cytotoxic T lymphocytes (CTLs) and Type 1 T-helper cells (Th1) are associated with better prognosis in pancreatic cancer. However, evidence has also suggested that several subsets of T cells (e.g. CD8, IFN-producing Th1 cells, and Th2 cells) are involved in tumour promotion, progression, or metastasis186.
1.4.3.2 Pancreatic stellate cells, CCGFs, pancreatic fibrosis, and cancer
28
29
1.5 Statistical Modelling Methods
1.5.1 Background
This section is written with the aid of an article titled “Classification of Breast Cancer Cells Using JMP” by Dr Marie Gaudard et al. in 2009199. This article was later published in Chapter 9 the book Visual Six Sigma: Making Data Analysis Lean. However, the original article can still be viewed online at
http://www.northhavengroup.com/documents/BreastCancer_WhitePaper_Current.pdf. In Chapters 2 and 3 of the current thesis, a number of statistical modelling methods were employed to select and then combine candidate biomarkers into a single marker including stepwise regression model, multinomial logistic regression model, and artificial neural network model.
1.5.2 The Stepwise Regression (SR) Model
The SR model was used in Chapter 3 to select independent markers of PDAC amongst a large number of potential markers, which were statistically significant on univariate analysis. The SR model utilises the Wald/Score statistics to select independent predictors of outcome. The Wald/Score test in the SR model serves two purposes. Firstly, it compares the predictive capabilities of each variable with each other and secondly, the predictive capabilities are assessed in consideration of variables already entered into the SR mode. Therefore, whilst a variable may be a significant predictor of the outcome, it will not be entered into the SR model if previously selected variables can already identify the same samples and subsequently, this means that only variables with independent predictive abilities are selected by the SR model.
30
stepwise regression (used in Chapter 3), each step consists of a forwards component followed by a backwards component. This means that at each step, the variable with the highest significance will be entered into the SR model then a backwards step will be performed to remove any variables, which then became insignificant.
1.5.3 The Multinomial Logistic Regression Model
Logistic (or Binary) regression is a mathematical method used to predict a dichotomous outcome e.g. PDAC versus Controls. It is widely employed by researches to predict a dependent variable based on a number of continuous and/or categorical independent variables.
In the current thesis, M-LR was used to estimate the probability of PDAC (dependent variable) using the serum concentrations of candidate CCGFs selected by the stepwise regression model (continuous independent variables). This is achieved through the use of the logistic formula:
Where
And
β0 represents the intercept constant
β1, β2, β3, and β4 are regression coefficients for the corresponding CCGF
This algorithm will generate, using serum concentrations of candidate CCGFs in a given sample, a probability value of PDAC ranging from 0 to 1
31
Figure 1.2- A diagram of the Artificial Neural Network model
1.5.4 Artificial Neural Network Model
The neural network model is so named because of its ability to “learn” in a similar fashion to neurons in the human body. There are three layers of neurons arranged in nets within the NN model: input layer, hidden layer (where processing occurs), and output layer. Each layer of neurons can be excited to a range of degrees (i.e. not binary). The input layer can be considered as sensory neurons, which react to a stimulus (CCGF concentrations) and generates an output signal that reflects the intensity of the input stimulus. This signal then enters the hidden layer where a predefined number of hidden nodes will again generate a weighted pattern of stimulus (i.e. a linear function [the weighted part] of logistic functions generated at each node), which is carried to the output layer. Finally, the inputs are summed (i.e. the estimated probability of PDAC) and compared to a threshold value (optimal cut-off) to determine their output (predicted PDAC or Control). Most importantly, perhaps the most important feature in NN model is its ability to learn from its mistakes. This is achieved by comparing the predicted out-put with the actual classification and by propagating the degree of error back through the whole network with the incorrectly classified connections down-weighted and correctly classified connections strengthened.
Again, this model will estimate the probability of a sample being PDAC based on the serum concentrations of the four CCGFs where a probability of 0 suggests a likely control sample whereas a probability of 1 suggests a likely PDAC sample.
Input Layer
Hidden Layer
Output Layer
PDAC
32
1.6 Research Project Design
This research project takes a two-fronted approach to the discovery of proteomic biomarkers for pancreatic cancer whereby two independent studies are described in Chapter 2 and Chapter 3 of this thesis (seeFigure 1.3).
Chapter 2 aim to determine the diagnostic potential of three serum-based candidate markers identified from a previous mass spectrometry experiment are determined by western blot analyses using pancreatic cancer and control samples from two database: Liverpool Pancreatic Cancer database (LPCD) and UK Collaborative Trial of Ovarian Cancer Screening (UKCTOCS) (See section 2.3.2.2).
Chapter 3 describes the use of multiplex cytokine assays for the discovery of novel biomarkers for pancreatic cancer. In this Chapter, the diagnostic potential of cytokines is examined as individual and combined markers. The results are validated using an independent validation sample set. (See section 3.3.2)
Figure 1.3- Design of the current MPhil Project. The current thesis consists of two separate
33
![Figure 2.4- Western blotting (WB) of original iTRAQ samples. [A] WB image of iTRAQ result](https://thumb-us.123doks.com/thumbv2/123dok_us/8064020.226407/61.595.107.524.484.753/figure-western-blotting-original-itraq-samples-image-result.webp)
![Figure 2.8- Examples of Phase II Western Blot (WB) images. [A] WB of PDAC, CP, and HC samples for VDBP, [B] WB of DC samples for VDBP](https://thumb-us.123doks.com/thumbv2/123dok_us/8064020.226407/64.595.110.528.137.676/figure-examples-phase-western-images-samples-vdbp-samples.webp)
![Figure 2.9- [A] Box plots showing the relative intensity of VDBP in individuals with chronic pancreatitis (CP, n=10), disease controls (DC, n=20), healthy volunteers (HC, n=10), and pancreatic cancer (PDAC, n=20) Kruskal Wallis’s Test showed significant di](https://thumb-us.123doks.com/thumbv2/123dok_us/8064020.226407/65.595.110.529.444.766/relative-intensity-individuals-pancreatitis-volunteers-pancreatic-kruskal-significant.webp)
![Figure 2.17 Logistic Plots showing the diagnostic accuracy of [A] VDBP ,[B] RBP-4, and [C] FINC as individual markers of PDAC against the combined HC and CP group](https://thumb-us.123doks.com/thumbv2/123dok_us/8064020.226407/73.595.115.530.382.702/figure-logistic-showing-diagnostic-accuracy-individual-markers-combined.webp)