Website Boundary Detection via Machine
Learning
Thesis submitted in accordance with the requirements of the University of Liverpool for the degree of Doctor in Philosophy
by
Ayesh Alshukri
Preface
This thesis is submitted to the University of Liverpool in support of my application for admission to the degree of Doctor of Philosophy. No part of it has been submitted in support of an application for another degree or qualification of this or any other institution of learning. This thesis is predominantly my own work and the sources from which material is drawn are identified within. Sections of some chapters of this thesis have appeared in the following publications as indicated:
Sections of Chapter 5 have appeared in:
[1] A. Alshukri, F. Coenen, and M. Zito. Web-Site Boundary Detection Using In-cremental Random Walk Clustering. In Proceedings of the 31st SGAI International Conference(pp. 255–268). Cambridge, UK: Springer. 2011.
Sections of Chapter 7 have appeared in:
[2] A. Alshukri, F. Coenen, and M. Zito. Incremental Web-Site Boundary Detection Using Random Walks. InProceedings of the 7th International Conference on Machine Learning and Data Mining. (pp. 414–427). New York, USA: Springer. 2011.
Abstract
This thesis describes research undertaken in the field of web data mining. More specif-ically this research is directed at investigating solutions to the Website Boundary De-tection (WBD) problem. WBD is the problem of identifying the collection of all web pages that are part of a single website, which is an open problem. Potential solutions to WBD can be beneficial with respect to tasks such as archiving web content and the automated construction of web directories.
A pre-requisite to any WBD approach is that of a definition of a website. This thesis commences with a discussion of previous definitions of a website, and subsequently proposes a definition of a website which is used with respect to the WBD solution approaches presented later in this thesis.
The WBD problem may be addressed in either the static or the dynamic context. Both are considered in this thesis. Static approaches require all web page data to be available a priori in order to make a decision on what pages are within a website boundary. While dynamic approaches make decisions on portions of the web data, and incrementally build a representation of the pages within a website boundary. There are three main approaches to the WBD problem presented in this thesis; the first two are static approaches, and the final one is a dynamic approach.
The first static approach presented in this thesis concentrates on the types of fea-tures that can be used to represent web pages. This approach presents a practical solution to the WBD problem by applying clustering algorithms to various combina-tions of features. Further analysis investigates the “best” combination of features to be used in terms of WBD performance.
The second static approach investigates graph partitioning techniques based on the structural properties of the web graph in order to produce WBD solutions. Two variations of the approach are considered, a hierarchical graph partitioning technique, and a method based on minimum cuts of flow networks.
The final approach for the evaluation of WBD solutions presented in this research considers the dynamic context. The proposed dynamic approach uses both structural properties and various feature representations of web pages in order to incrementally build a website boundary as the pages of the web graph are traversed.
Acknowledgement
First and Foremost, I would like to thank my primary supervisor Dr Frans Coenen for his extreme patience, encouragement and continued faith in me. I am very grateful for his constant guidance and support, I could not have started this journey, or seen it through without his help. I would also like to express my gratitude to my second supervisor Dr Michele Zito for his suggestions and valued comments. He has helped me and my research develop over the four years of my PhD study.
Contents
Preface i
Abstract ii
Acknowledgement iv
List of Figures ix
List of Tables xvii
1 Introduction 1
1.1 Motivations . . . 2
1.2 Research Questions . . . 4
1.3 Research Methodology . . . 5
1.4 Contributions . . . 6
1.5 Organisation of Thesis . . . 7
2 Background 8 2.1 The World Wide Web (WWW) . . . 8
2.2 Website Boundary Detection (WBD) . . . 9
2.2.1 Related Work . . . 10
2.2.2 Web page features . . . 14
2.3 The KDD Process . . . 17
2.4 Web Mining . . . 19
2.4.1 Web Mining Challenges . . . 20
2.5 Web Crawling . . . 23
2.5.1 Basic web crawler . . . 24
2.5.2 Random Walk . . . 26
2.6 Clustering . . . 26
2.6.1 Clustering Algorithms . . . 27
2.6.2 Kmeans . . . 28
3 The Website Boundary Detection Problem 31
3.1 Website Definition . . . 31
3.1.1 W3C Definitions . . . 32
3.1.2 Theoretical Definitions . . . 33
3.1.3 Practical Definitions . . . 38
3.1.4 The Three Notion Model of a Website . . . 39
3.2 Proposed Definition . . . 40
3.3 WBD problem . . . 42
3.3.1 WBD Mining Issues . . . 43
3.3.2 WBD solutions derived using The KDD process model . . . 44
3.4 Formal Description . . . 47
3.4.1 WBD as a clustering problem . . . 48
3.4.2 Static vs Dynamic . . . 50
3.4.3 Evaluation Metrics . . . 51
3.5 Summary . . . 56
4 Data sets 57 4.1 Binomial Random Graphs (BRGs) . . . 58
4.1.1 Simple Binomial Random Graphs . . . 58
4.1.2 Feature Binomial Random Graphs . . . 59
4.2 Artificial Data Graphs (ADGs) . . . 60
4.2.1 Artificial Data set generation . . . 61
4.2.2 Artificial Data Graph Sets . . . 63
4.3 Real Data Graphs (RDGs) . . . 64
4.3.1 Real Data set generation . . . 64
4.3.2 University of Liverpool Departments . . . 66
4.3.3 Variations . . . 67
4.3.4 Comparison of data sets . . . 72
4.4 Summary . . . 73
5 Static Technique 1: Feature Analysis 74 5.1 Formal Description . . . 75
5.2 Representation . . . 76
5.3 The Static Approach . . . 78
5.3.1 Data Collection (Phase 1) . . . 79
5.3.2 Data Modelling (Phase 2) . . . 79
5.3.3 Data Analysis (Phase 3) . . . 80
5.4 Static Technique Implementations . . . 80
5.4.2 Static Technique: using feature types discrimination (feature
dis-crimination) . . . 81
5.5 Evaluation . . . 84
5.5.1 Single Features . . . 85
5.5.2 Double Feature Combinations . . . 89
5.5.3 Triple Feature Combinations . . . 89
5.5.4 Composite (All) Features . . . 90
5.5.5 Discriminated Features . . . 91
5.5.6 Comparisons . . . 93
5.6 Conclusions . . . 97
6 Static Technique 2: Graph Structure Partitioning 99 6.1 Hierarchical Graph Partitioning . . . 100
6.1.1 Newman’s Modularity . . . 100
6.1.2 The Newman Graph Clustering Algorithm . . . 101
6.1.2.1 Example of Newman Hierarchical Clustering . . . 102
6.1.2.2 Application of Hierarchical Clustering Based Method to WBD . . . 102
6.2 Evaluation of Hierarchical Graph Partitioning Approach . . . 103
6.2.1 Complete Snapshots . . . 104
6.2.2 Varying the “Snapshot” Size . . . 105
6.2.3 Evaluation Summary . . . 108
6.3 Flow Networks . . . 111
6.3.1 Flow Network Model . . . 112
6.3.1.1 Residual Networks . . . 113
6.3.1.2 Augmenting paths . . . 114
6.3.1.3 Network Cuts . . . 115
6.3.1.4 Max-Flow / Min-Cut theorem . . . 117
6.3.2 Ford Fulkerson Algorithm . . . 117
6.3.2.1 Ford Fulkerson Implementation characteristics. . . 118
6.3.3 Partitioning web graphs using flow network theory . . . 119
6.3.3.1 Flow Graph Models . . . 120
6.3.3.2 WBD solution . . . 121
6.4 Evaluation of Minimum Cut Approach . . . 121
6.4.1 Fixed source s, iterating sinkt . . . 121
6.4.1.1 Standard Flow Graph Model . . . 122
6.4.1.2 BackLinks Flow Graph Model . . . 123
6.4.2 Iterating source sand sinkt. . . 125
6.4.2.2 Backlinks Flow graph model . . . 126
6.4.3 Evaluation Summary . . . 129
6.5 Conclusion . . . 130
7 Dynamic Techniques 131 7.1 Formal Description . . . 132
7.2 The Dynamic Approach . . . 132
7.3 Graph Traversal . . . 133
7.3.1 Breadth First (BF) and Depth First (DF) . . . 134
7.3.2 Random Walk (RW) . . . 136
7.3.3 Self Avoiding Random (SAR) Walk . . . 137
7.3.4 Metropolis Hastings Random Walk (MHRW) . . . 137
7.3.5 Random Ordering (RO) Clustering . . . 139
7.4 Incremental Clustering . . . 140
7.4.1 Incremental Kmeans (IKM) . . . 140
7.4.2 Incremental Clustering Algorithm (ICA) . . . 140
7.5 Graph Representation . . . 141
7.5.1 Edge Weighting . . . 141
7.5.2 Similarity Edges . . . 142
7.6 Issues of the Dynamic Approach to WBD . . . 143
7.7 Evaluation . . . 145
7.7.1 Binomial Random Graphs Evaluation . . . 147
7.7.1.1 Simple Binomial Random Graphs Evaluation . . . 149
7.7.1.2 Feature Binomial Random Graphs Results . . . 151
7.7.1.3 Summary . . . 152
7.7.2 Artificial Data Graphs . . . 154
7.7.2.1 ICA and IKM Clustering comparison . . . 155
7.7.2.2 Graph Representation comparison . . . 158
7.7.2.3 Random Ordering . . . 162
7.7.2.4 Summary . . . 166
7.7.3 Real Data Graphs . . . 167
7.7.3.1 Feature Representation Comparison . . . 168
7.7.3.2 Graph Traversal Method Comparison . . . 169
7.7.3.3 Summary . . . 170
7.8 Evaluation Summary . . . 173
7.9 Conclusions . . . 174
8 Conclusion 175 8.1 Summary . . . 175
8.3 Contributions and main findings . . . 178 8.4 Future Work . . . 180
Bibliography 181
A Real Data Graph (RDG) Cluster Examples 198
B Ford Fulkerson Example 207
List of Figures
2.1 An illustration of individual web pages segmented into (A) structure link “blocks” (Red) and (B) content link “blocks” (Blue) [162] . . . 10 2.2 Illustration of a collection of four web pages (Discover, Buy, How-to and
Apps) connected in a link block graph due to the presents of a common s-menu [105] . . . 11 2.3 The Process-Centred view model of the KDD process [77] . . . 17 2.4 The operation of a basic web crawler (based on [128]). . . 24 3.1 The WBD problem as modelled using the KDD process based on the
Process-Centred view model by [77] . . . 45 3.2 The vector space model for the WBD problem using some formal
nota-tion. In this example k = 2 for all features and thus a binary value of
{0,1}is allocated to each feature. . . 48 3.3 An exmaple data set W, showing a composition of subsets CN (noise)
and CT (target). . . 49
3.4 An example cluster configuration showing a grouping of web pages into K ={K1, K2, K3}clusters. . . 50 3.5 An example cluster configuration showing a grouping of web pages into
K ={KT, KN} clusters. . . 50
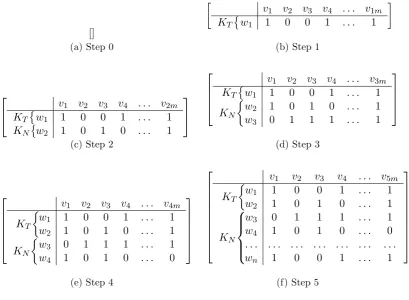
3.6 The dynamic construction of a vector space created from n web pages (wn). At each step (a-f) a new web page is added. . . 52
3.7 Evaluation metrics expressed as a confusion matrix. . . 53 4.1 Example of a Binomial Random Graph . . . 58 4.2 Illustration of the ADG generation. (a) shows the host graph created
using the preferential attachment model [112], (b) shows the clusters created using the host graph in (a) . . . 61 4.3 Example graph with depth and width values for each level. . . 65 4.4 Average degree for target (CT) and noise (CN) pages for the RDG data
5.1 The vector space model for the WBD problem using some formal nota-tion. In this example k = 2 for all features and thus a binary value of
{0,1}is allocated to each feature f1,f2 and f3. . . 75 5.2 An example data set W (left), showing a possible cluster configuration
using different features (right). Each coloured area represents a related set of pages using a particular sub feature (fi), overlap of clusters occurs
as different features express similar relationships. . . 76 5.3 An illustration of the n-feature type technique. . . 81 5.4 An illustration of the feature discrimination technique. . . 82 5.5 The average performance score of each feature using the four RDG data
sets. . . 86 5.6 The performance score of each feature for RDGs data set. . . 86 5.7 Performance of the top nine single features, ordered from best performing
1, to worst performing 9. . . 87 5.8 The minimum, maximum and average for each of the evaluation measures
used to evaluate the single features. . . 88 5.9 The performance of double feature combinations for RDG data sets. . . 89 5.10 The performance of double feature combinations, ordered from best
per-forming 1, to worst perper-forming 36. . . 90 5.11 The performance of triple feature combinations for each data set. . . 91 5.12 The performance of triple feature combinations, ordered from best
per-forming 1, to worst perper-forming 84. . . 92 5.13 The average WBD solution score is plotted against the number of
fea-tures in the combination, the highest scoring combination in the case of each data set is highlighted by a dot. . . 93 5.14 The feature combinations and average scores for each data set. The
highest scoring feature combinations in each case has been highlighted. . 94 5.15 The average scores of the single, double, triple and all feature
combina-tions. The x-axis represents the feature combination, while the y-axis illustrates the performance of that particular feature combination. . . . 95 5.16 The rank of each of the features in order of best performance over singles,
doubles, triples and all feature combinations. . . 95 5.17 Each clustering algorithm ranked with respect to average WBD score
performance for each ADG data set for the single, double, triple and all feature combinations. . . 96 6.1 An example graph. . . 103 6.2 The Q values (a) and corresponding dendogram (b) for each iteration
6.3 The performance of the hierarchical graph clustering algorithm on the four test datasets (LivChem, LivHistory, LivMath and LivSace). . . 106 6.4 The compositions of the output clusters generated using the Newman
algorithm for all four data sets. The tables show how many clusters were produced and the total number and target pages (vertices) in each of the clusters. The cluster containing the seed page (ws) is the target
cluster KT. . . 106
6.5 The modularityQvalues obtained for each iteration of the Newman algo-rithm for all four datasets (LivChem, LivHistory, LivMath and LivSace). Iteration 0 has each vertex in an individual cluster. In the final iteration all vertices are in a single cluster. The dark line indicates the highest Q value, and subsequently the “best” cluster configuration, in each case. . 107 6.6 The results of running the Newman hierarchical clustering algorithm on
the RDG datasets (LivChem, LivHistory, LivMath and LivSace). . . 109 6.7 The cluster compositions of the best results from all tests that applied
the Newman algorithm on varying sized snapshots with respect to the four data sets (shown in Figure 6.6). The size of the snapshot in each case is indicated. The tables show how many clusters were produced and the total and target number (CT) of vertices in each of the clusters. The
cluster containing the seed page (ws) is labelled as the target clusterKT. 110
6.8 The number of output clusters from each round of applying the Newman algorithm on varying sized snapshots with respect to the four data sets. The plot shows the number of clusters (y-axis) for each snapshot size (x-axis), the average number of clusters is also shown. . . 110 6.9 Comparison of the results of the application of the Newman algorithm
to the complete snapshot and the best result obtained from varying the snapshot size. The plot shows the WBD solution performance score of both the best and complete snapshot results (y-axis) for each data set (x-axis). . . 111 6.10 The image in (a) shows an example network of vertices with weighted
edges. The image in (b) is a corresponding flow network G= (V, E) of the network in (a). The edges are labelled as f(u, v)/c(u, v) to indicate the amount of flow f and the maximum capacity c of edge (u, v). The flow network (b) depicts edge weights the network given in (a) as capacity constraints c(u, v). A flow f of 1 unit is shown along path s → v1 →
6.11 The image in (a) shows a flow networkG= (V, E) with flowf, the edges are labelled as f(u, v)/c(u, v). The image in (b) is the corresponding residual network Gf = (V, Ef) of G induced by flow f, the edges are
labelled with their residual capacitycf(u, v). . . 115
6.12 Augmenting path example. (a) and (b) show a flow network G and its corresponding residual network Gf respectively, each are highlighted
with an augmenting path p (s → v1 → v3 → t). (c) and (d) show the resulting flow network G0 and residual network G0f respectively after a max flow has been admitted along augmenting pathp. The max flow is determined bycf(p) = 4 as a consequence of edge (v1, v3)). . . 116
6.13 A network with an example cut(S,T). . . 116 6.14 (a) is a flow networkGwith max-flowf. (b) is the corresponding residual
network Gf with no augmenting paths. The min-cut (S, T) is shown
such that S ={s, v1, v2, v4} and T ={v3, t}. The cut has a capacity of c(S, T) = 23, a net flow off(S, T) = 23. . . 118 6.15 WBD performance score using the standard flow graph model, with a
fixed source s=ws (the seed page) and iterating sink t. For a graph of
n vertices, s = 0 is fixed, t is then iterated from t = 1 to t = n. The plots show the performance score value (y-axis), plotted for each sink t (x- axis). . . 122 6.16 WBD performance recall and precision values using the standard flow
graph model, with a fixed source s =ws (the seed page) and iterating
sinkt. . . 123 6.17 WBD score using the backlinks model, with a fixed source s=ws (the
seed page) and iterating sinkt. For a graph ofnvertices, s= 0 is fixed, tis then iterated fromt= 1 tot=n−1. The plots show the score value (y-axis) plotted for each possible sinkt(x- axis). . . 124 6.18 WBD performance score using the standard flow model, with iterating
sourcesand sink t. The plots show the score value (y-axis), plotted for each sink sand tcombination (x- axis). All cominbations ofsand tare shown. . . 126 6.19 Frequency distribution of source and sink for the top 25 scoring WBD
6.20 WBD score using the backlinks model, with iterating source sand sink t. The plots show the score value (y-axis), plotted for each sink s and t combination (x-axis). The top 450 results are shown only, this is to highlight the two level trend. . . 128 7.1 Illustration of a random walk discovering of nodes of the graph as it
explores the structure. The ordering of nodes visited are A,B,A,D,C. The greyed out nodes and edges are undiscovered or unknown, the visible nodes and edges are known via traversal of the structure, while the darker nodes and edges are marked as visited. . . 135 7.2 A directed graph (a) and corresponding directed graph (b) after an s
step traversal whereby additional edges are added to aid a random walk traversal (shown as dashed lines). . . 135 7.3 Traversal of the graph in (a) are shown in the corresponding Sub-Figures
(b, c and d). The traversals are; Breadth First (BF) in (b), Depth First (DF) in (c) and Random Walk (RW) in (d). The steps of the traversal are shown as edge labels and the corresponding nodes visited are noted in each example. . . 144 7.4 Accuracy with respect to the traversal, converging and converged phases
of a BF walk on ADG Set1 G1 (see section 4.2). . . 145 7.5 Coverage variability of 50 random walks on ADG Set1 G1 (see section
4.2). The grey lines indicate the coverage of individual RWs, and the black line the average coverage. . . 145 7.6 The ratio value output of a RW using data set BRG C5. This plot is a
segment of the plot in Figure 7.7a (between steps 6400-7200). . . 150 7.7 The ratio values for RWs using data set Simple BRG C5, C50 and C500
with complete clusters. Plot (a) shows the earlier stages of the walk (0-10k steps) and plot (b) shows the later stages (40k-50k steps). . . 151 7.8 The ratio values for RWs using data set Simple BRG P5, P50 and P500
with partial clusters. Plot (a) shows the earlier stages of the walk (0-10k steps) and plot (b) shows the later stages (40k-50k steps). . . 151 7.9 Ratio values calculated for RW-SW using data set Feature BRG F5. The
plot shows both the ratio values and the cluster transitions (spikes) in the line (above). Each plot (a,b,c) shows the progress of the random walk at various step segments as indicated. . . 153 7.10 Ratio values calculated for RW-SW using data set Feature BRG F50.
7.11 Ratio values calculated for RW-SW using data set Feature BRG F500. The plot shows both the ratio values and the cluster transitions (spikes) in the line (above). Each plot (a,b,c) shows the progress of the random walk at various step segments as indicated. . . 153 7.12 The average WBD performance of BF and RW graph traversal methods
using both incremental clustering algorithms IKM and ICA on the data set ADG Set1 (see section 4.2). . . 157 7.13 The average WBD performance of BF and RW graph traversal methods
using both incremental clustering algorithms IKM and ICA on the data set ADG Set2 (see section 4.2). . . 158 7.14 The average WBD performance of the dynamic approaches indicated on
data set ADG set1. . . 163 7.15 The graph coverage of the dynamic approaches indicated on data set
ADG set1. . . 163 7.16 The average WBD performance of the dynamic approaches indicated on
data set ADG set2. . . 164 7.17 The graph coverage of the dynamic approaches indicated on data set
ADG set2. . . 164 7.18 The WBD performance of the dynamic approaches indicated on data set
ADG set1. . . 166 7.19 The WBD performance of the dynamic approaches indicated on data set
ADG set2. . . 167 7.20 The WBD score performance for BF, DF, RW, MHRW and SAR
dy-namic approaches using Body text, Title text, Script links, Resource links, Image links feature representation. . . 169 7.21 The average graph coverage for five graph traversals (as indicated) on
ADG data sets (LivChem, LivHistory, LivMaths and LivSace) using the title feature. . . 171 7.22 The WBD performance for five graph traversals (as indicated) on RDG
data sets (LivChem, LivHistory, LivMaths and LivSace) using the title feature over 1000 steps. . . 172 8.1 Comparison of the highest performing approaches for the production of
WBD solutions presented in this thesis. Sub-Figure (a) shows WBD performance score, (b) Target and (c) Noise coverage. . . 177 A.1 The whole LivChem graph displayed using a selection of graph layout
A.2 The LivChem graph using a reduced scale to highlight the high degree of connectivity. Dark patches indicate vertices and edges with a high degree. Areas of nodes that have lower connectivity are greyed out of the image. . . 199 A.3 The LivChem graph filtering vertices with degree > 30, displayed with
layout method as described. This essentially greys out hubs/authorities with high degree, and shows the edges and vertices with average degree more clearly. . . 199 A.4 The target and noise clusters of the LivChem graph displayed in a
cir-cular layout. The graphs are filtered to remove vertices and edges with degree less than 1, 15, 20, 30, 70 and 90, figures (a) to (f) respectively. . 200 A.5 The LivHistory graph displayed using a selection of graph layout methods.200 A.6 The LivHistory graph using a reduced scale to highlight the high degree
of connectivity, Dark patches indicate vertices and edges with a high degree. Areas of nodes that have lower connectivity are greyed out of the image. . . 201 A.7 The LivHistory graph filtering vertices with degree >30, displayed with
layout method as described. This essentially greys out hubs/authorities with high degree, and shows the edges and vertices with average degree more clearly. . . 201 A.8 The target and noise clusters of the LivHistory graph displayed in a
circular layout. The graphs are filtered to remove vertices and edges with degree less than 1, 15, 20, 30, 70 and 90 figures (a) to (f) respectively.202 A.9 The LivMath graph displayed using a selection of graph layout methods. 202 A.10 The LivMath graph using a reduced scale to highlight the high degree
of connectivity. Dark patches indicate vertices and edges with a high degree. Areas of nodes that have lower connectivity are greyed out of the image. . . 203 A.11 The LivMath graph filtering vertices with degree > 30, displayed with
layout method as described. This essentially greys out hubs/authorities with high degree, and shows the edges and vertices with average degree more clearly. . . 203 A.12 The target and noise clusters of the LivMath graph displayed in a circular
A.14 The LivSace graph using a reduced scale to highlight the high degree of connectivity. Dark patches indicate vertices and edges with a high degree. Areas of nodes that have lower connectivity are greyed out of the image. . . 205 A.15 The LivSace graph filtering vertices with degree > 30, displayed with
layout method as described. This essentially greys out hubs/authorities with high degree, and shows the edges and vertices with average degree more clearly. . . 205 A.16 The target and noise clusters of the LivSace graph in a circular layout.
The graphs are filtered to remove vertices and edges with degree less than 1, 5, 10, 20, 40 and 90 figures (a) to (f) respectfully. . . 206 C.1 An example graph G1, the corresponding adjacency list and diagram is
List of Tables
2.1 Pseudo code for kmeans algorithm based on [71]. . . 28 2.2 Pseudo code for ICA in the context of this work, based on the method
in [132]. . . 29 3.1 A list of theoretical dictionary definitions of the term “Website” (or
equivalent, as discussed in section 3.1). . . 35 3.2 A list of public definitions of the term “Website” (or equivalent, as
dis-cussed in section 3.1). . . 36 4.1 The graph-theoretic statistics for the Complete BRG data sets. Intra
edgesare links connecting two pages in the same cluster. Inter edgesare links connecting pages in different clusters. . . 59 4.2 The graph-theoretic statistics for the Partial BRG data sets. Intra edges
are links connecting two pages in the same cluster. Inter edgesare links connecting pages in different clusters. . . 60 4.3 The graph-theoretic statistics for the Feature BRG data sets. Intra edges
are links connecting two pages in the same cluster. Inter edgesare links connecting pages in different clusters. . . 60 4.4 Graph-theoretic statistics for artificial graphs of type Set1 and Set2.
Intra edges are links connecting two pages in the same cluster. Inter edgesare links connecting pages in different clusters. . . 64 4.5 Graph metrics for the LivChem web graph. This includes values
sured relative to the whole graph (including all clusters) and also mea-sured relative to the target and noise clusters. . . 68 4.6 Confusion matrix for the connections between clusters of the LivChem
graph. . . 68 4.7 Graph metrics for the LivHistory web graph. This includes values
sured relative to the whole graph (including all clusters) and also mea-sured relative to the target and noise clusters. . . 69 4.8 Confusion matrix for the connections between clusters of the LivHistory
4.9 Graph metrics for the LivMath web graph. This includes values sured relative to the whole graph (including all clusters) and also
mea-sured relative to the target and noise clusters. . . 70
4.10 Confusion matrix for the connections between clusters of the LivMath graph. . . 70
4.11 Graph metrics for the LivSace web graph. This includes values measured relative to the whole graph (including all clusters) and also measured relative to the target and noise clusters. . . 71
4.12 Confusion matrix for the connections between clusters of the LivSace graph. . . 71
4.13 Comparison of four University of Liverpool department data sets. . . 73
5.1 Overview of processes involved in a general static approach to the WBD problem. . . 79
5.2 The n-feature algorithm. . . 82
5.3 Feature discrimination algorithm. . . 83
5.4 Example hierarchy generated using the feature discrimination technique. 84 6.1 Iterative Hierarchical Clustering algorithm based on Newman [144, 143]. 102 6.2 Ford Fulkerson Algorithm [83], based on the description presented in [57].118 7.1 Template detailing the dynamic approach to WBD. . . 133
7.2 Pseudo code for Breadth First (BF) . . . 136
7.3 Pseudo code for Random Walk (RW) . . . 137
7.4 Pseudo code for Self Avoiding Random (SAR) with reset . . . 138
7.5 The probability of traversing neighbourQnew based on increasing degree. 139 7.6 Pseudo code for Metropolis Hastings Random Walk (MHRW) . . . 139
7.7 Pseudo code for generic edge weighting method. . . 142
7.8 Pseudo code for artificial edges based on similarity. . . 143
7.9 The evaluation strategy for the dynamic approaches to the WBD prob-lem. The three categories of data set are given on the left hand side. . 148
7.10 A comparison of ICA and IKM algorithms using the BF and RW graph traversal in terms of WBD score performance. Score values are shown for 2k and 10k steps for BF and RW respectively. . . 159
7.12 The graph traversal and graph representation approaches (as indicated) ordered according to WBD performance score. The average graph cov-erage, WBD performance score and average time per step is shown for each approach using data set ADG Set2. . . 160 7.13 The WBD performance the dynamic approaches as indicated, ordered
Chapter 1
Introduction
The World Wide Web (WWW) is a prolific information source which provides a massive amount of information which is publicly accessible from almost anywhere, which makes it the largest data source in the world [49, 135, 128]. The past decade has seen an explosive growth of the WWW. This explosive growth has been fuelled by factors which include advances in hardware technologies, increases in the ease of use of software and the tremendous opportunities the web offers for business [50, 128]. The new generation of web applications, coined ‘web 2.0’, is also a contributing factor to this growth, with user authored content contributing significantly [139, 159]. User involvement in the use of the WWW is ever increasing [159]. It is integrated into everyday life; shopping, banking, conferencing and social networking can all be conducted online with many additional benefits [33].
Given that the WWW is the largest data source in the world there is a desire to both support the current benefits offered by the WWW (information sharing, networking and so on) and derive additional benefits using automated tools and techniques. Machine understanding and communication of data using sophisticated algorithms, not only makes possible, but can also enhance the services that are used by many users online today [33]. To achieve a high level of machine understanding of the WWW requires knowledge of the structure of the WWW. One way of modelling the WWW is to conceive it in the form of a web graph, where each node represents a web resource, and edges represent hyperlinks (each resource can be linked to many other resources via multiple edges). Using this interpretation of the WWW it is possible to design software tools (web crawlers[172]) that can automatically traverse the graph with the aim of collecting information.
(see section 2.2). The solution to the WBD problem is hindered by the lack of any clear understanding of what a WWW site is: the term means different things to different groups of users and different types of application.
This thesis seeks to provide an answer to the boundary detection problem by consid-ering its solution in terms of a clustconsid-ering (unsupervised learning) problem. A number of alternative possible solutions are presented, some operating in a static context and some in a dynamic context. The potential solutions include the adoption of established unsupervised techniques, such as the kmeans algorithm, and the use of more “up to the minute” techniques such as random walks. All the solutions are founded on a par-ticular definition of what a WWW site is, the derivation of this definition also forms an essential element of the overall contribution of this thesis.
The rest of this introductory chapter is organised as follows. In Section 1.1 some further motivation, in addition to the above, is presented in terms of a number of specific applications. The research questions, and associated research issues, central to the work described in this thesis is then presented in Section 1.2. The research methodology adopted to address the research objective is then outlined in section 1.3. The contribution made by the work described is summarised in Section 1.4, followed by an overview of the remainder of this thesis in section 1.5.
1.1
Motivations
The work described in this thesis is motivated by a number of applications where WBD is central to the problem domain. These include digital preservation, web directory generation (indexing), web site map generation, web spam detection and various forms of web analysis.
Digital preservation is concerned with the archiving of digital information, such as web sites, for historical purposes. Examples of selective web archiving initiatives include LOCKSS1 and OPF2. The general process of archiving digital content is a three step process: (i) collecting, (ii) storing and (iii) access. WBD is a central element with respect to the collection step. Currently data collection is usually conducted by manual traversal [46, 60]. Identifying the boundary of a website can automate the choice of pages to archive [168, 21].
Web directories are used by internet search engines to support web searching. Yahoo Directory3 and Look Smart4 are examples of online applications that operate using web directories. Currently web directories are often manually constructed by domain experts, comprising a small group of paid staff [117]. The Open directory project5 is
1LOCKSS: Lots Of Copies Keep Stuff Safe.http://www.lockss.org/lockss/Home 2
OPF: Open planets foundation. http://www.openplanetsfoundation.org/about
3http://dir.yahoo.com/ 4
http://www.looksmart.com
an effort to create the most comprehensive human edited web directory. This initiative is in response to the increasing rate of growth of the internet. The web directory is supported by a growing community of voluntary domain experts that have an interest in a certain topic. Such core web directories are typically used to power search engines. It would clearly be advantageous if the large scale generation of web directories could be automated. This in turn would require WBD.
A website map provides users with an overview of a website. Despite the obvious usefulness of such a resource, website maps are only available for a small number of websites; they can either be manually constructed or their generation can be automated [129, 64]. Constructing a site map for a website that has many different authors is difficult [130]. Automated solutions to site-map construction are often limited (by some degree) to domain name, however websites can clearly also be related regardless of domain name. For example Google site map generator6 uses a technique that traverses a specific given URL domain to construct a site map. The resulting site map will thus not include content spread over different domains. The automated generation of web site maps would necessitate a solution of the WBD problem as envisaged in this thesis. This would offer a particular advantage with respect to websites that change rapidly.
Web spam (similar to email spam) is content on the web that is generally unwanted or fake, with possible malicious intentions. Detecting web spam can be very challenging and is a top priority for many search engines so as to stop this content from being ranked higher than legitimate content in user search results [35, 140, 52, 36]. Reported work on detecting web spam is typically directed at the detection of individual spam web pages as opposed to the identification of spam web sites [183, 182, 118, 181]. Solutions to the WBD problem would support the detection of entire spam websites.
Study of the WWW is conducted in many contexts, including authorship, accessi-bility, and structure analysis. Studying the world wide web at the website level rather than the web-page level can have a number of benefits [41]:
WWW Document Authorship Analysis Document authorship analysis is conducted with respect to a single authored document on the WWW. For example if we wished to analyse web document authorship, one publication can be represented by multiple pages on the web [63]. Thus it is not reasonable to study attributes like authorship at page level. Instead it might be better to study the web at the web-site level.
WWW Site Inter-relationship Analysis The inter-relationships between websites changes over time. A website entity may be reorganised at the site owners’ control, causing pages and links to appear and disappear [128]. It is important to be able to identify website boundaries to accurately study inter website relationship.
Connectivity Analysis It is sometimes important to analyse the connectivity be-tween WWW sites, see for example [44]. An understanding of the boundaries of WWW sites is important to support such an analysis.
Statistical Analysis The statistical analysis of the WWW is a common application area. The study of the web founded on a statistical analysis of web-pages alone may be skewed due to the simplicity of rapid and dynamic generation. Studying the WWW at the web site level allows for better extraction of statistics such as measures of the growth of the WWW.
1.2
Research Questions
Given the above motivation the objective of the research described in this thesis can be summarised as the search for an answer to the question is it possible to discover website boundaries using unsupervised learning techniques?
This research question encompasses a number of component research questions: 1. What is an appropriate definition of a website to be used within the
context of this research? From the literature there is substantial ambiguity concerning the definition of what is, and what is not, a website. The term web-site is widely used, but poorly defined; it means many things to many different observers. If we are to establish techniques for identifying website boundaries, a necessary precursor is to determine an appropriate definition for a website. 2. What is an appropriate web page model to be used within the context
of this research? To identify website boundaries we need to model the domain in some way. More specifically we need to be able to model web pages, and by extension websites. A web page comprises many features: giving a definition of a website is also necessary to determine what features need to be taken into consideration if we are to build models of the web.
3. What is an appropriate mechanism to deal with the magnitude of the web? The size of the web is growing exponentially. There are a vast number of websites which means that if we wish to, in some sense, process the entire web this will entail an unacceptable computational overhead. An alternative mechanism is therefore required.
1.3
Research Methodology
This section presents the methodology adopted with respect to the research described in this thesis to address the proposed research question. A 5 phase programme of work was adopted. A necessary precursor to any investigation to address the WBD problem, as already noted, was to establish a definition of what a website is. This then comprised Phase one of the programme of work. Phase two was then directed at an investigation of the attributes most suited to defining a website, which in turn would influence the nature of any solution to the WBD problem. As already noted the solution to the WBD problem, with respect to this thesis, is conceptualised as a special type of clustering problem.
The remaining 3 phases of the programmes of work were directed at a potential solution to the WBD problem. Potential solutions were categorised as being either static or dynamic. Because static solutions were considered as a precursor to dynamic solutions these were considered first.
The first two proposed approaches to produce potential solutions to the WBD prob-lem were directed at the static context, The first of the static approaches concentrated on investigating the best features to represent web pages. In combination with cluster-ing algorithms the most appropriate features to represent web pages where found with respect to the WBD problem. The second approach, in the static context, was cen-tred around the graph structure of the web, induced by the hyperlinks between pages. Graph partitioning algorithms were used to investigate the potential segmentation of the web graph in order to exploit the structural properties exhibited in the web with respect to the WBD problem. The final approach is considered in a dynamic context. Both the structural properties and features of the web were used in order to perform a “real time” traversal and incremental clustering of the graph in order to produce WBD solutions.
To evaluate the proposed techniques a number of data sets were used. Firstly syn-thetically generated binomial random graphs and artificial graphs, based on the pref-erential attachment model, were created. Secondly a set of real web data was obtained by collecting a portion of the WWW. The criteria used to measure the effectiveness of the proposed techniques was founded on the following:
• Performance of the website boundary detected with respect to measures.
with a WBD solution. The ratio was used to quantify the unnecessary processing of noise pages, and show the number of web pages that have been covered relative to noise.
Intuitively the reader may postulate that traditional unsupervised learning measures (cohesion, separation [95]) could be used to evaluate potential solutions. However, it is argued here that such measuring was not appropriate to measure the performance of a WBD solution. These measures are traditionally associated with problems that have no labelling associated with the data, therefore these measures are typically used to determine the quality of a solution relative to the data itself [176]. Also each of the data sets have an associated labelling of target and noise web pages. Given that the main objective of the research described in this thesis is to detect, with high performance, the boundaries of websites; this can be measured using traditional supervised learning measures using labelled data. A subsequent objective of the work is to deal with the large volume of data on the web, which can be interpreted as a desire to reduce the expense of unnecessarily processing noise items; this can also be measured using labelled data.
1.4
Contributions
This thesis makes a number of contributions. Firstly the work demonstrates that, given a definition of what a website is, it is possible to detect the boundaries of a website in a static context by applying unsupervised clustering techniques. However, in the static context, it is often impractical to pre-determine the collection of pages required to identify the desired boundary because: (1) there is uncertainty in “grabbing” data of an unknown size, implying great difficulty in pre-determining what to include in the collection of pages; and (2) it is resource intensive to process potentially large amounts of unwanted data that may be contained in the pre-determined collection. Thus the second claim made in the thesis is that website boundaries can also be identified using a dynamic process. In the thesis it is argued that by using a clustering algorithm and content information coupled with a random walk web graph traversal, in a dynamic incremental context, it is possible to produce a solution to the WBD problem with satisfactory accuracy while at the same time avoiding unnecessary processing of un-wanted data. It is also argued that the proposed dynamic approach to WBD is more desirable because: (1) there is no need to have any knowledge concerning the web site to be identified prior to producing a solution to the WBD problem, and (2) the process requires a smaller computational resource than in the static context.
In summary the contributions of this thesis can be itemised as follows:
2. An investigation of the web page features that can be used to support the proposed definition, which can consequently be used to effectively model web pages for the purpose of WBD.
3. An investigation into mechanisms to identify website boundaries in the static context, using the kmeans clustering algorithms, combined with a particular set of web page features.
4. An investigation into mechanisms to identify website boundaries in the static context using the structural properties encoded in the hyperlink web graph. 5. An investigation of mechanisms to identify website boundaries in the dynamic
context using a random walk graph traversal method, combined with the kmeans clustering algorithm and using textual features to represent web pages.
6. Evidence that the proposed dynamic mechanisms offer advantages, with respect to the practical challenges of WBD, over static mechanisms.
1.5
Organisation of Thesis
Chapter 2
Background
This chapter presents the necessary background information that underpins the work described in this thesis. The chapter commences (section 2.1) with consideration of the initial inception of the WWW and how it has evolved and its continuing impact on society. Section 2.2 then considers previous and related approaches to solve the Web-site Boundary Detection (WBD) problem. The Knowledge Discovery from Databases (KDD) process model is a general model outlining the steps to extract interesting pat-terns and new knowledge from data. The steps of the KDD process are presented in section 2.3. Data mining is a specific step in the KDD process, and is concerned with the actual pattern discovery in data. Web mining is a related field to data mining and, given its relevance to this work described in this thesis, is reviewed in section 2.4. Section 2.5 presents some background information on web crawling, introducing a random method of crawling the web, which has significance with respect to one of the proposed approaches presented in this thesis. The solutions to the WBD problem considered in this thesis viewed the solution to the WBD problem in terms of a clus-tering problem. Section 2.6 therefore considered the clusclus-tering problem in relation to this research, and further explains the static and dynamic contexts in which it is used in this work. The final section of this chapter (section 2.7) gives a summary of the previous work presented in this chapter.
2.1
The World Wide Web (WWW)
The World Wide Web (WWW) was invented by Sir Tim Berners-Lee in 1989 when working at the Center for European Nuclear Research (CERN) [37]. The name ‘World Wide Web’ was the term he coined for the project. The WWW (or web) is the largest and best known repository of hypertext content in the world [128, 49]. The content is distributed and heterogeneous in its nature. The integration of the web is apparent in almost all aspects of society [39, 40, 94, 170, 171].
The publication of content on the web is not controlled by a central authority or ad-ministered in any way [50]. Due to the lack of editorial control it allows the publication of content on any topic in any format [128]. The easy and unrestricted publication of content provides a platform that can have advantages for many applications, and can provide a great future for open and democratic communication from any participant.
The organisation of information that is distributed on the web is determined by the author or publisher of the information. An example of which is the organisation of the content in collections of web pages that constitute a website. This content can be (hyper) linked to other related content across domains or other physical locations as directed by the publisher or authoring body. This organisational structure is generally understandable by other human users. However this open and unrestricted environ-ment can also have adverse effects when looked at from an information retrieval point of view, as there is no strict and enforced guidelines as to how content is to be published, described and disseminated on the web. Also the size and growth of the web means that desired content cannot be easily accessed by users, and thus it is essential to use software to aid information retrieval from such a vast data source [82, 26].
2.2
Website Boundary Detection (WBD)
The Website Boundary Detection (WBD) problem is an open and difficult problem to solve [41, 28, 98, 104]. As already noted the WBD problem is commenced with the task of identifying the collection of all web resources that are contained as a single website (see section 3.3 for further discussion on the WBD problem). To the author’s knowledge there is currently no automated machine learning technique to detect the boundaries of a website with the precision of a human user.
The field of “website mining” [75, 178, 54, 158] describes an area of research that falls under the main field of web mining (see section 2.4), but is directed at specific applications with respect to a website’s structure (in contrast to web pages for example). The general problem of website mining is to discover hidden patterns or knowledge in relation to websites. Website mining techniques utilise web structure (hyperlinks) and web content (attributes of a page).
There are many website mining applications presented in the literature, which can include evaluating the quality of websites [101, 155] or detecting the structure of web-sites [142, 88] to name but a few. Although each of these problems are related to websites, the specific problem of defining the boundary of a website, which is often a necessary precursor, is often solved manually or overlooked completely.
model web pages, which is directly related to the approaches presented later in this thesis.
2.2.1 Related Work
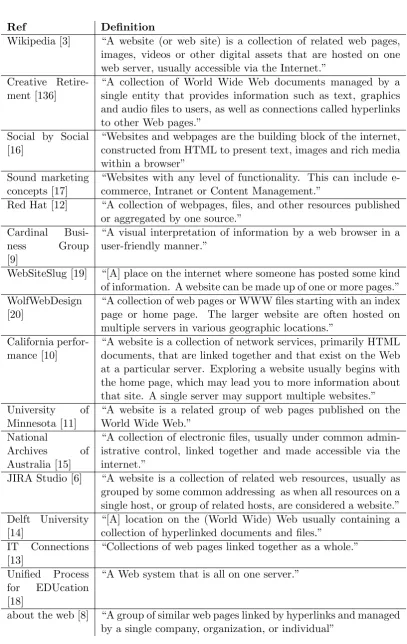
[image:32.595.113.530.234.494.2]This sub-section first presents some selected related work on the WBD problem. The related work discusses: link block graphs, logical websites, compound documents, direc-tory based websites and website hierarchies. Secondly some related work that focuses on related website mining issues is presented with respect to website classification.
Figure 2.1: An illustration of individual web pages segmented into (A) structure link “blocks” (Red) and (B) content link “blocks” (Blue) [162]
Link Block Graph The WBD problem has been approached by using methods based on the link block graph representation. The link block graph is created from web pages by segmenting individual pages into “blocks” representing navigation menus or sets of coherent links (Figure 2.1). This is typically done by segmenting the HTML Document Object Model (DOM) of web pages. Once segmented a graph structure can be used to represent the link blocks (a link block graph). The individual blocks represent vertices, and the connections represent links between blocks.
to another page that contains the same s-menu. The pages that contain this menu are said to represent the skeleton structure of some hidden content hierarchy defined by the particular s-menu. Web pages that contain common s-menus can define the boundaries of a website. While s-menus that are present on only a smaller subset of pages within a website represent sub-sites.
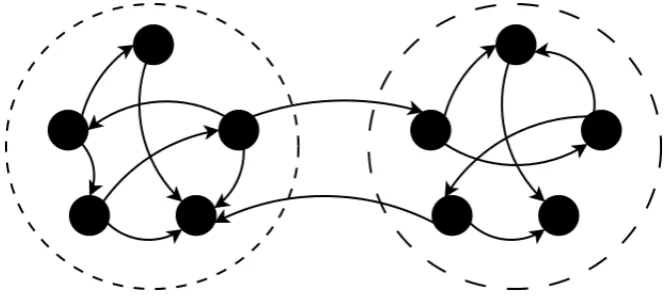
[image:33.595.156.485.281.518.2]In [105] a menu miner algorithm is used to decode the architecture of websites, and produce a content hierarchy. The algorithm uses a bi-directional graph of the web, where vertices represent s-menus, and a link exists only if it is reciprocated (Figure 2.2). The content hierarchy is found by identifying pages containing common s-menus by discovering maximal cliques in the graph. The content hierarchy is then used to detect the boundaries of a website by using a disjunctive set of pages defined through the identification of common s-menus.
Figure 2.2: Illustration of a collection of four web pages (Discover, Buy, How-to and Apps) connected in a link block graph due to the presents of a common s-menu [105]
In [161, 160] identification of Strongly Connected Components (SCC) in the link block graph is performed using a linear time algorithm. A sub site is then detected by creating the union of all web pages that contain the particular s-menu in the identified SCC. Both of the proposed methods require only the preprocessing of a web page’s HTML structure in order to segment them into coherent structures representing link blocks.
the static preprocessing of a collection web pages in order to segment them into coherent structures represented by their corresponding link blocks. Also if pages are from the same website, but do not contain a common s-menu, they will not be detected as being within the same website boundary.
Logical Websites In the work by Senellart [167, 168], the aim is to find web pages that are contained in “logical websites”. A logical website is described in terms of the link structure and is defined as a collection of nodes (or web pages) that are significantly more connected than other nodes. A gathered portion of the web is modelled using flow networks. The assumption is made that if a flow is pushed around the network, bottlenecks will occur in the less connected noise pages, but flow more freely around the highly connected target pages of the website. To detect the boundaries of a website flow is pushed from a set of seed pages until a bottle neck is created around the boundaries of the website. The set of nodes that have flow pushed to them are then identified as part of the website.
Compound Documents Research by Eiron [73] proposes the notion of compound documents. This is a set of web pages that can be aggregated to a single coherent infor-mation entity. A simple example of a compound document is a news article, although it is created conveying ideas in text format, it could also have illustrative elements like images or video. This collection of web pages aggregates to form a compound document representative of a news article.
In the work by Dmitriev [63, 65] a method to discover compound documents is pro-posed. The method uses supervised learning techniques to train a model using manually labelled compound documents. The correct weighting of edges between related pages from the input labelled compound documents are assigned based on extracted features. The features used were web page content similarity, along with anchor text and title similarity. Features based on structural components were also considered, they include the number of common in and out links, links with common anchor text and the number of hyperlinks pointing to common directories [66].
The model is then applied to a new set of pages to calculate edge weights based on features which relate pages of compound documents. A clustering method is then applied to partition the model into compound documents using the weighted edges.
Directory Based Website In [28] the difficulty of the WBD problem is enforced by a claim regarding the vague nature of the current definitions of a website. The proposed solution is to define a “directory based (web) site”. This is described as a section of a web server over which an author has full control. The method proposed to identify the website is to use various filters based on characters in the URLs of web pages to categorise which child pages are under the control of a certain author. For example in URLs the tilde symbol (∼) is sometimes used to represent a user. Subsequent pages in the following directories can be identified as being under the control of that user. This method is consequently limited by a restricted definition which does not allow flexibility for a website to span beyond multiple domains or directories.
Website Hierarchies Mining website hierarchies is an area of research that aims to extract hierarchical structures from the web pages contained in a website. A hierarchy is a tree structure that can be used to represent the organisation of a collection of web pages based on the link structure. A method of extracting a hierarchy from a collection of web pages of a website is proposed in [130, 131, 188]. The method uses a machine learning approach to weight edges based on the different predetermined categories of links. A shortest path algorithm is then used, rooted at the home page, to build the tree structure to represent the hierarchy of the website.
In [54] an approach to produce clusters of hierarchies for a website using a link structure is proposed using the ReHITS method. The ReHITS method comprises an iterative application of the HITS algorithm which is used to discover authorities and hub pages in the website. These authorities and hubs are then used to represent a cluster. The HITS algorithm is then reapplied after removing the previously identified authorities and hubs. This process is repeated to build a set of clusters. Sub trees are formed using the path structure of the urls of pages in a cluster. If the paths of two authorities overlap they are merged into one sub-tree. This method is used to identify logical sub-trees representing clusters within a website.
In [113] a method of segmenting the URL tree of a website into topical cohesive regions is proposed. This produces a hierarchy that reflects topical sub-sites of a web-site. The algorithm requires an existing tree structure of the web pages in a collection, this can be retrieved according to the URL of the pages in a website. The approach segments the given tree into collections representing topic related sub collections using methods based on recursively traversing the tree, selecting to add nodes based on a cost measure associated with adding nodes to a sub tree.
hier-archies where the collection of pages making up a website is hidden within a larger collection of noise web pages. Noise pages in this thesis are referred to as unwanted web pages that are irrelevant to the goal of WBD, i.e. noise pages are outside the boundary of a website.
Website Classification The topic of website clustering/classification is an interest-ing topic related to the WBD problem. The aim is to label a website with a topic or subject, this is in contrast to web page classification which aims to do the same but for a single web page [156]. The vast majority of the literature on this subject aims to categorise the subject matter a website describes, or classify the website into predefined groups. Unfortunately much of the work simply makes an assumption con-cerning the boundaries of the website before any classification techniques are applied [152, 111, 75, 27, 115, 126, 179]. Therefore the problem of detecting the boundaries of the website in question are often overlooked, or an estimation is used as to how many pages should be collected from a certain domain to represent the website [127].
2.2.2 Web page features
This sub section presents some related work on the features that have been used to model web pages. This is an important aspect with respect to this thesis as the features used to model web pages will directly effect the measure of similarity between two pages. The notion of similarity used will inevitably have an impact on the pages identified to be within a website boundary.
A common approach to represent web pages is to use methods that are used in text mining. Traditional text data mining methods are applied where a web page is modelled as a text document. This document model is then used to determine the similarity between a set of web pages [50, 49, 135, 128]. Despite the application of text mining approaches, web pages can be distinguished from traditional text collections [156] for the following reasons:
• The web contains pages that are unstructured or semi structured with inconsistent formatting.
• Web pages usually contain markup code that is rendered visually for users.
• Pages on the web exist within a web graph of rich hyperlinks pointing to and from various pages.
that distinguish web pages are usually contained “on-page” and encoded in the web pages content in some way. A review of features that have been used in the literature for web page modelling is presented below.
Text The text of a web page is the most straight forward feature to use when mod-elling web pages. Hence the common application of traditional text mining techniques. Using textual content allows for the application of text mining methods, for example the bag of words model. The noise that is associated with data from the web can often hinder these techniques [156]. The technique of using n-grams has also been applied to web pages [141]; a technique which can be used to capture concepts and/or phrases. A draw back is that the n-grams method usually creates a higher dimensional feature space than in the case of the bag of words method. High dimensional data can intro-duce additional problems, particularly when using traditional similarity measures with respect to the application of clustering algorithms [110]. Therefore further techniques need to be applied to reduce the dimensions of the feature space, for example feature selection techniques [156].
URL Arguably the most prominent feature of a web page is its Uniform Resource Locator (URL). The feature is typically used for web navigation purposes [34]. This feature is not strictly encoded in the web page’s content, but has to be known in order to request web page content. The main elements making up a standard URL consist of: scheme, domain, sub domains, directory path and query. The URLhttp:
//www.my.examples.com/example?query_string is made up of: ahttp scheme, the
domain and sub domain is examples.comand my, the path isexample and the query
isquery_string.
There are techniques that have been successfully used to classify web pages using features constructed from the various elements making up a URL. Creating features based on the domain, sub domain and directory structure have been used [28]. There have also been methods that extract features from the URL by segmenting the various elements of the URL using delimiters.
Styling tags In [116, 115] web pages are represented according to the presence of certain tags in the content. Some common features (title, headings, and meta data) were used in this work. However, additional features based on tags in the HTML content were also used. Web pages are segmented into features representing certain tags in the textual content. For example textual styling tags like bold, underline and strong may be extracted from a web page [116]. A weighting scheme is used to distinguish the significance of the tags used. If a tag is used very often, the assumption is that it is not used for emphasis, thus it is deemed unimportant, and the weighting is reduced [115].
Content and Structure The work described in [69, 68, 67] uses a hybrid approach to representing features from a web page which draws upon both the content and the internal structure of web pages. The content is represented by features constructed using keywords from the text. The structural properties are used to create features us-ing page anchors. Page anchors are used as links “jumpus-ing” the user to various points in the same web page. This type of feature representation produces a small dimen-sional feature space, and does not involve the complexity associated with modelling the hyperlink structure [67].
User behaviour In [169] numerous sets of common features are used to model web pages, in particular they are used in combination with users navigation behaviour. The URL-based features are used as in previous work, but the features are constructed based on the depth of URL paths. The “type” of a web page is also used. A feature is constructed using the file extension, which can indicate the type of resource at a URL, for example .pdf, .jpg and so on. Features are constructed using the textual content in a page anchor (named entities, nouns and verbs). The web page is used to construct a DOM, which is then used to represent block based features. Links based features are used (incoming links). User behaviour features collected from browser toolbars are also used as features, examples include; the number of page visits over a certain time period, number of links clicked on each page and pages visited from bookmarks or browser history. Notice that the features used, and collected, are quite extensive. The research was conducted in part by Yahoo!, which is a major search engine based in the US. This work performs clustering on the features using a term-term co-occurrence model, which is created using a bag of words.
expressed from user oriented point of view, as they derive features based on what is visually rendered. This point is in contrast to the majority of the features presented above, where the object is to encode content [156].
2.3
The KDD Process
The phrase Knowledge Discovery in Databases (KDD) was first used in [150]. KDD is described as “the process of finding useful information and patterns in data” [77]. KDD is a complete process involving a set of specific steps. There are various models that may be used to describe the KDD process. The most notable is the process-centered view model, shown in figure 2.3, which will be used to provide an overview of the KDD process with respect to this thesis. Other KDD models include: the Johns process model [102], the Human-centred process model [42] and the CRISP-DM process model [51].
Each of the steps of the KDD process shown in figure 2.3 is described in more detail below. The discussion is primarily founded on the review of KDD presented in [71, 95], but with additional information garnered from [78, 79, 151, 42, 124]. With reference to figure 2.3 the first thing to note is that KDD can be viewed as an iterative process, which means that when following each step the user can return to any of the previous steps if needed. The flow of information in the process-centered view model is indicated by the direction of the arrows in figure 2.3.
Figure 2.3: The Process-Centred view model of the KDD process [77]
particular techniques to process or gather the data. Once the application domain is understood the KDD process can commence. Thus:
1. Selection In this step we gather the “target data” needed for the knowledge mining [151]. This could involve the task of selecting the sources which are needed for the desired data discovery. The data may come from many different origins such as databases, flat files, the WWW and non-electronic sources [71]. The selection step may also include the identification of a target data set by focusing on a subset of the different sources of data [78, 79].
2. Pre Processing The data gathered in the previous step may be noisy. For example the data may include incorrect or missing values [95, 71]; or anomalies resulting from the use of different data sources, different data types and different metrics [95]. A strategy has to be adopted to deal with these problems [78, 79]. Erroneous data could be corrected or removed [95], missing data can be supplied or predicted. Care must be taken during this step as “occasionally what looks like an anomaly to be scrubbed away is in reality the most crucial indicator of an interesting domain phenomenon” [42].
3. Transformation The data that has been cleaned during the previous step typically needs to be converted to a common or more usable format [95]. Methods for “data reduction” may be used to reduce the dimensionality of data [95, 78, 79]. The transformation step can also involve finding useful features in the data to best represent it according to the intended goals of the KDD task [78, 79].
4. Data Mining The data mining step is where the actual knowledge discovery takes place. The typical aim is to extract useful patterns from the given data set using some particular data mining algorithm(s). This step thus commences with the identification of the most appropriate data mining algorithm given the desired KDD task, which is then applied to the pre-processed data generated by the foregoing steps.
5. Interpretation/Evaluation Testing and verification of the discovered knowledge is important so that the end user can gain confidence in the generated results. Different evaluation techniques are applicable to different types of data mining (KDD). How the patterns that are found in the data mining step are presented to the user is very important [71]. The usefulness of patterns, and the new knowledge that they represent, depends heavily on the interpretation placed on them by the end user. To assist interpretation various visualization techniques have been proposed founded on the use of graphs, charts and GUI’s [71].
documentation of the knowledge discovered, or specific action taken as a direct cause.
As mentioned previously, the KDD process is iterative; this means that it can re-quire interaction with the user between steps thus incorporating flexibility into the model [42]. There is no single KDD solution that fits all KDD tasks. The diversity of KDD goals, and their related complexity in terms of data types and knowledge inter-pretation, requires a tailored approach [53]. KDD solutions are typically constructed and developed for a particular type of problem or data set [53]. A discussion of how the KDD process may be applied to the WBD problem is presented in chapter 3.3.2.
In this section the KDD process has been described. In the following section the specific discipline of web mining will be considered.
2.4
Web Mining
Web mining is the task of discovering knowledge from web hyperlink structure, web content and web usage data [128]. Web mining can be thought of as the data mining step of the the KDD process model, when the knowledge discovery problem is concentrating on data from the WWW [50, 49, 135, 128]. The specific techniques used to discover non trivial patterns in web data are known as web mining techniques, which can be commonly based on traditional data mining techniques, but not exclusively so due to the specific challenges the WWW brings [128]. Web mining tasks can be categorised into three main topics:
Web structure mining techniques exploit the hyperlink (or link) structure between web pages to discover useful knowledge about the web.
Web content mining draws upon the information in the content of web pages. Web usage mining typically discovers patterns from the user access data associated
for a particular web service.
Each of these tasks has an associated set of techniques. It has been suggested that the three category view of web mining techniques could be represented by a merged list representing just two main categories; these are (1) web usage mining techniques, and (2) web content/structure mining techniques [58]. The two category representation is suggested because for many applications the techniques used draw upon more than one category to provide a solution.
![Figure 2.1: An illustration of individual web pages segmented into (A) structure link“blocks” (Red) and (B) content link “blocks” (Blue) [162]](https://thumb-us.123doks.com/thumbv2/123dok_us/8065041.226555/32.595.113.530.234.494/figure-illustration-individual-segmented-structure-blocks-content-blocks.webp)
![Figure 2.2: Illustration of a collection of four web pages (Discover,Buy, How-to and Apps) connected in a link block graph due to thepresents of a common s-menu [105]](https://thumb-us.123doks.com/thumbv2/123dok_us/8065041.226555/33.595.156.485.281.518/figure-illustration-collection-discover-apps-connected-thepresents-common.webp)
![Figure 2.4: The operation of a basic web crawler (based on [128]).](https://thumb-us.123doks.com/thumbv2/123dok_us/8065041.226555/46.595.218.424.217.539/figure-operation-basic-web-crawler-based.webp)
![Table 2.1: Pseudo code for kmeans algorithm based on [71].](https://thumb-us.123doks.com/thumbv2/123dok_us/8065041.226555/50.595.171.471.69.159/table-pseudo-code-kmeans-algorithm-based.webp)

![Figure 3.1: The WBD problem as modelled using the KDD process based on theProcess-Centred view model by [77]](https://thumb-us.123doks.com/thumbv2/123dok_us/8065041.226555/67.595.117.527.73.159/figure-problem-modelled-using-process-based-theprocess-centred.webp)