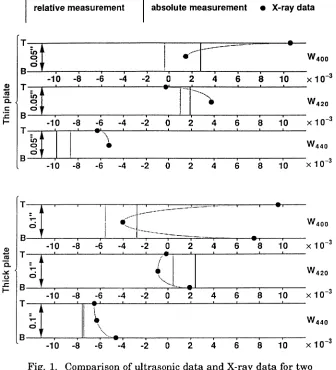
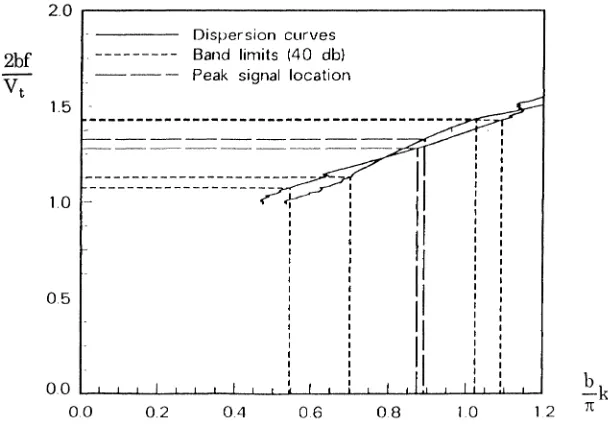
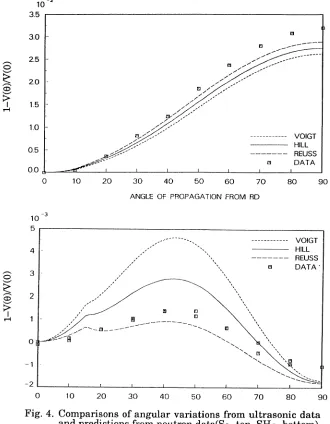
Ultrasonic Measurement of Texture of Cubic and Hexagonal Materials
Full text
Figure

Related documents
Hepatic steatosis was defined by noncontrast computed tomography (CT) liver-to-spleen (L/S) attenuation ratio < 1.0. Multivariable linear regression was used to: 1) evaluate
So, we can conclude that hybrid quantizer is the best solution for quantization of r coordinate. It was shown in Section 3 that our model can achieve the same performances
The workshopseminar on internaonal commercial contracts organised by UIA in Munich will analyze the basic issues of cross border contracts with reference to three types of
Standardization of herbal raw drugs include passport data of raw plant drugs, botanical authentification, microscopic & molecular examination, identification of
The top surface velocity greatly influences the harmful presence of the mold slag. The high velocity of the flow of the top surface can shear slag into the steel pool to
Male Sprague Dawley rats were subject to partial warm liver ischemia/reperfusion injury with intraperitoneal injection of either normal saline or hydrogen enriched saline at dose of
Intervention effects with respect to ‘ PTA ’ , ‘ INFO ’ , ‘ SAFED ’ , clinical patient outcomes, and health-related quality of life were estimated using general- ised
