METHODS FOR BIOLOGICAL AND
ENVIRONMENTAL SAMPLE
ANALYSIS
By
Aliaa Ibrahim Shallan
M.Sc. (Pharmacy)
School of Physical Sciences
Submitted in fulfilment of the requirements for the Degree of
Doctor of Philosophy
ii This thesis contains no material which has been accepted for a degree or diploma by the University or any other institution, except by way of background information and duly acknowledged in the thesis, and to the best of my knowledge and belief no material previously published or written by another person except where due acknowledgement is made in the text of the thesis, nor does the thesis contain any material that infringes copyright.
AUTHORITY OF ACCESS
The publishers of the papers in this thesis (comprising Chapters One to Four and Chapter Seven) hold the copyright for that content, and access to the material should be sought from the respective journals. The remaining non-published content of the thesis may be made available for loan and limited copying and communication in accordance with the Copyright Act 1968.
S
TATEMENT OF
E
THICAL
C
ONDUCT
The research associated with this thesis abides by the international and Australian codes on human and animal experimentation, the guidelines by the Australian Government's Office of the Gene Technology Regulator and the rulings of the Safety, Ethics and Institutional Biosafety Committees of the University. Ethics Approval Ref is H0010801.
Aliaa Shallan
iii
The Giants whom I stand on their shoulders
" Simplicity is the ultimate sophistication."
iv “All praise is due to Allah with whose favours all good can be accomplished”
No words can describe my gratitude towards my supervisors, Prof. Michael Breadmore and Dr. Rosanne Guijt. Thank you for making my PhD such a rich journey of professional and personal evolution. I deeply appreciate your extreme understanding of cultural differences and wisdom in handling your students.
Many thanks to CSL members, Mr. John Davis from the electric workshop, Mr. Peter Dove from the mechanical workshop, and Dr. Sandrin Feig and Dr. Karsten Goemann for taking SEM images.
Thanks to all past and present members of the Chippers & CEers group and to the extended family of ACROSS members. I could not feel homesick for the whole period of my study. Thanks for those who came out of their way to help me whenever needed. Thanks for seeking my advice to solve your problem, I learned from you as much as you learned from me. Thanks to my colleagues and friends in the School of Chemistry and the School of Pharmacy, I really enjoyed morning tea discussions.
Thanks to my papers’ reviewers who I may never know but have dedicated time to review my work and give constructive feedback.
I would like to gratefully acknowledge the Egyptian Ministry of Higher Education for the financial support and Helwan University for allowing me to take a study leave and come to Australia for Ph.D. Special thanks to Prof. Mohamed Salem and Prof. Safaa Tubar for their constant support, directly or indirectly, since 1997.
v The majority of the work presented in this thesis was published and include the contribution of the following authors:
Paper 1, Shallan, A. I.; Gaudry, A. J.; Guijt, R. M.; Breadmore, M. C., Tuneable nanochannel formation for sample-in/answer-out devices. Chemical Communications 2013, 49 (27), 2816-2818.
This paper constitutes 30% of the experimental part of Chapter One and Chapter Three. Ms. Aliaa Shallan was the first author and conducted all the experimental work, data analysis and writing the manuscript. Dr. Adam Gaudry wrote the LabView program to control the power supply through feedback current, which was an essential element to the success of this work. Prof. Michael Breadmore suggested the idea of using current limit feedback to control the dielectric breakdown process. Dr. Rosanne Guijt and Prof. Michael Breadmore contributed equally to the idea and development of the work.
Paper 3, Shallan, A. I.; Guijt, R. M.; Breadmore, M. C., Electrokinetic size and mobility traps for on-site therapeutic drug monitoring. Angewandte Chemie International Edition 2015, 54, 7359-7362. DOI: 10.1002/anie.201501794.
vi Chapter 4. Microfluidic devices for the analysis of drugs and their metabolites in biological fluids in “Microfluidics, Nanotechnology and Disease Biomarkers for Personalized Medicine Applications”, NOVA Science Publishers, Shiddiky, M. J. A.; Wee, E. J. H.; Rauf, S.; Trau, M., (ed), United States, pp. 73-98. ISBN 978-1628080209 (2013)
This book chapter constitutes Chapter Two. Ms. Aliaa Shallan was the first author (80%) contribution. Dr. Rosanne Guijt and Prof. Michael Breadmore contributed equally to the refinement of the text.
Review 3, Shallan, A. I.; Guijt, R. M.; Breadmore, M. C., Electrokinetics for sample preparation of biological molecules in biological samples using microfluidic systems. Bioanalysis 2014, 6 (14), 1961-1974.
This book chapter constitutes Chapter Four. Ms. Aliaa Shallan was the first author (80%) contribution. Dr. Rosanne Guijt and Prof. Michael Breadmore contributed equally to the refinement of the text.
Paper 2, Shallan, A. I.; Smejkal, P.; Corban, M.; Guijt, R. M.; Breadmore, M. C., Cost-effective three-dimensional printing of visibly transparent microchips within minutes. Analytical Chemistry 2014, 86, 3124-3130.
viii
Type of Publications
References
Papers in refereed Journals & book chapters 8
Posters at national and international conferences 6
Oral presentations at international conferences 5
1. Shallan, A. I.; Guijt, R. M.; Breadmore, M. C., Capillary electrophoresis: Basic principles in “Encyclopedia of Forensic Sciences” (Eds.: A. S. Editors-in-Chief: Jay, J. S. Pekka), Academic Press, Waltham, pp. 549-559. ISBN 978-0-12-382166-9 (2013).
2. Shallan, A. I.; Guijt, R. M.; Breadmore, M. C., Chapter 4. Microfluidic devices for the analysis of drugs and their metabolites in biological fluids in “Microfluidics, Nanotechnology and Disease Biomarkers for Personalized Medicine Applications”, NOVA Science Publishers, Shiddiky, M. J. A.; Wee, E. J. H.; Rauf, S.; Trau, M., (ed), United States, pp. 73-98. ISBN 978-1628080209 (2013). (Chapter Two)
3. Breadmore, M. C.; Shallan, A. I.; Rabanes, H. R.; Gstoettenmayr, D.; Abdul Keyon, A. S.; Gaspar, A.; Dawod, M.; Quirino, J. P., Recent advances in enhancing the sensitivity of electrophoresis and electrochromatography in capillaries and microchips (2010–2012). Electrophoresis 2013, 34 (1), 29-54. DOI: 10.1002/elps.201200396.
ix of electrophoresis and electrochromatography in capillaries and microchips (2012–2014) Electrophoresis 2015, 36, 36-61. DOI: 10.1002/elps.201400420. 5. Shallan, A. I.; Guijt, R. M.; Breadmore, M. C., Electrokinetics for sample
preparation of biological molecules in biological samples using microfluidic systems. Bioanalysis 2014, 6 (14), 1961-1974. DOI: 10.4155/bio.14.140. (Chapter Four)
6. Shallan, A. I.; Gaudry, A. J.; Guijt, R. M.; Breadmore, M. C., Tuneable nanochannel formation for sample-in/answer-out devices, Chemical Communications, 2013, 49, 2816-2818. DOI: 10.1039/c3cc38330j. (Chapters One and Three)
7. Shallan, A. I.; Smejkal, P.; Corban, M.; Guijt, R. M.; Breadmore, M. C., Cost-effective three-dimensional printing of visibly transparent microchips within minutes. Analytical Chemistry 2014, 86, 3124-3130. DOI: 10.1021/ac4041857. (Chapter Seven)
8. Shallan, A. I.; Guijt, R. M.; Breadmore, M. C., Electrokinetic size and mobility traps for on-site therapeutic drug monitoring. Angewandte Chemie International Edition 2015, 54, 7359-7362. DOI: 10.1002/anie.201501794. (Chapters One and Three)
9. Shallan, A. I.; Guijt, R. M.; Breadmore, M. C., Integrated polydimethylsiloxane membrane for protein removal. UTAS postgraduate Conference (SEiR), University of Tasmania, Australia, 1-2 September 2011. (Poster)
x Hobart, Australia, 28-30 November 2011. (Poster)
11. Shallan, A. I.; Guijt, R. M.; Breadmore, M. C., Integrated polydimethylsiloxane membrane for protein removal. The 19th RACI Research and Development Topics Conference, Melbourne, Australia, 7-9 December 2011. (Poster)
12. Shallan, A. I.; Gaudry, A. J.; Guijt, R. M.; Breadmore, M. C., Integrated polydimethylsiloxane membrane for protein removal. The 3rd Australia & New Zealand Micro/Nanofluidics and Bionano Symposium (ANZMNF), Wellington, New Zealand. 12-13 April 2012. (Oral)
13. Shallan, A. I.; Gaudry, A. J.; Guijt, R. M.; Breadmore, M. C., Integrated polydimethylsiloxane membrane for protein removal. The 28th International Symposium on Microscale Bioseparations (MSB), Shanghai, China, 21-24 October 2012. (Poster)
14. Shallan, A. I.; Gaudry, A. J.; Guijt, R. M.; Breadmore, M. C., Integrated polydimethylsiloxane membrane for protein removal. The 16th International Conference on Miniaturized Systems for Chemistry and Life Sciences (µTAS), Okinawa, Japan, 28 October - 1 November 2012. (Poster)
xi in/answer-out capability of small molecules in blood. The 29 MSB, Charlottesville, USA, 10-14 March 2013. (Poster)
17. Shallan, A. I.; Guijt, R. M.; Breadmore, M. C., (2013, April). 3D-printed microchips. The 4th ANZMNF, Adelaide, Australia, 22-24 April 2013. (Oral) 18. Breadmore, M. C., Sample-in/answer-out electrophoretic systems. Invited
seminar at Palacký University, Olomouc, Czech Republic, 14 October 2013. 19. Breadmore, M. C., Sample-in/answer-out electrophoretic systems, Invited
seminar at institute of Analytical Chemistry of the ASCR, Brno, Czech Republic, 16 October 2013.
20. Shallan, A. I.; Smejkal, P.; Corban, M.; Guijt, R. M.; Breadmore, M. C., 3D-printed microchips. The 40th International Symposium on High Performance Liquid Phase Separations and Related Techniques (HPLC), Hobart, Australia, 18-21 November 2013. (Oral)
21. Shallan, A. I.; Smejkal, P.; Corban, M.; Guijt, R. M.; Breadmore, M. C., 3D-printed microchips. The 5th ANZMNF, Hobart, Australia, 14-16 April 2014. (Oral)
22. Shallan, A. I.; Guijt, R. M.; Breadmore, M. C., Electrokinetic traps for integrated biological sample analysis. CE in the Biotechnology & Pharmaceutical Industries: 16th Symposium on the Practical Applications for the Analysis of Proteins, Nucleotides and Small Molecules (CE Pharm 2014), Seattle, United States, 12-16 October 2014. (Poster)
xii integrated biological sample analysis. The 18 µTAS, San Antonio, United States, 26 - 30 October 2014. (Poster)
25. Shallan, A. I.; Smejkal, P.; Corban, M.; Guijt, R. M.; Breadmore, M. C., 3D printed microfluidic devices using consumer-focused printers. Pittcon 2015, New Orleans, United States, 8-12 March 2015. (Oral)
xiii 3D Three dimensional
ABS Acrylonitrile-butadiene-styrene
AuNPs Gold nanoparticles
b Slip length
B Buffer reservoir
BGE Background electrolyte
BSA Bovine serum albumin
BW Buffer waste reservoir
CAD Computer-aided design
CAPS 3-(cyclohexylamino)-1-propanesulfonic acid
CCD Charge coupled device
Ce Ion concentration inside the nanochannel
CE Capillary electrophoresis
CEDIA Cloned enzyme donor immunoassay
CGIA Concentration gradient immunoassay
CHAPS 3-[(3-cholamidopropyl) dimethylammonio]-1-propanesulfonate
CNF 5-(and-6)-carboxynaphtho fluorescein
Co Bulk salt or ion concentration
xiv D Diffusion coefficient
Da Dalton
DGPMS Diethoy (3-glycidyloxy propyl) methyl silane
DIA Competitive diffusion immunoassay
DKA Diabetic ketoacidosis
DMD Digital micromirror device
DTT Dithioerythritol
Du Dukhin number
e Elementary charge
EDC Endocrine disrupting compounds
EDTA Ethylene diamine tetraacetic acid
ELISA Enzyme linked immunosorbent assay
EME Electromembrane extraction
EOF Electroosmotic flow
eΣ Surface charge density
EDL Electric double layer
Ee Applied electric field
F Faraday constant
FASI Field amplified sample injection
xv fe Volume electric forces
FIA Flow injection analysis
FITC Fluorescein isothiocyanate
FPIA Fluorescence polarization immunoassay
GC Gas chromatography
h Nanochannel height
h Hour
HF-LPME Hollow fibre liquid phase microextraction
HPLC High performance liquid chromatography
HPMC Hydroxypropylmethyl cellulose
HRP Horseradish peroxidase
IA Immunoassay
IC Ion chromatography
ICP Ion concentration polarization
ICP-MS Inductively coupled plasma mass spectrometer
ICU Intensive care unit
IEF Isoelectric focusing
INS Insulin
ITP Isotachophoresis
xvi kB Boltzman constant
!! Bulk conductivity
!! Surface conductivity
!! Bjerrum length
LC Liquid chromatography
LCD Liquid crystal display
LCoS Liquid crystal on silicon
!!" Dukhin length LE Leading electrolyte
LED Light emitting diode
LIF Laser induced fluorescence
LLE Liquid-liquid extraction
LOC Lab-on-a-chip
LOD Limit of detection
LOQ Limit of quantitation
LOV Lab-on-a-valve
MBE Moving boundary electrophoresis
MCE Microchip capillary electrophoresis
MEKC Micellar electrokinetic chromatography
xvii NED N-(1-Naphthyl) ethylenediamine dihydrochloride
NOPE 2-nitrophenyloctylether
NS Navier-Stokes
OVA Ovalbumin
PAGE Polyacrylamide gel electrophoresis
PBS Phosphate buffer saline
PCR Polymerase chain reaction
PDMS Poly(dimethylsiloxane)
PEEK Polyetheretherketone
pI Isoelectric point
PMMA Poly(methylmethacrylate)
POC Poin-of-care
PVA Polyvinyl alcohol
PVP Polyvinyl pyrrolidone
R Gas constant
RSD Relative standard deviation
R6G Rhodamine 6G
S Sample reservoir
SDS Sodium dodecyl sulphate
xviii SLM Supported liquid membrane
SMT Size/mobility trap
S/N Signal-to-noise-ratio
SPE Solid-phase extraction
SPR Surface plasmon resonance
ssDNA Single strand deoxyribonucleic acid
SW Sample waste reservoir
T Absolute temperature in Kelvin TDM Therapeutic drug monitoring
TE Terminating electrolyte
tITP Transient isotachophoresis
Tris tris(hydroxymethyl)-aminomethane
TRITC Tetramethylrhodamine isothiocyanate
UV Ultraviolet
Vel Electrostatic interaction VD Donnan potential
Z Valence of an ionic species
β-LG β-lactoglobulin
βOHB Beta-hydroxybutyrate
xix Δρs Salt concentration difference across the nanochannel
λD Debye length
λem Emission wavelength
λex Excitation wavelength
λS Analyte-specific length scale
µEO Electroosmotic velocity
µFIA Miniaturized flow injection analysis
µTAS Micrototal analysis system
η Fluid viscosity
ρe Charge density
ρs Solution ionic strength
ψ Electrical potential at a solid/liquid interface
ζ Zeta potential
xx The introduction of the “microscale total analysis system (µTAS)” concept in the late 80’s triggered the evolution of microfluidic devices that cover a vast range of applications. Automation, integration of multiple processes, and near zero dead volume for separation techniques are some benefits. Closing the gap between research and commercialization in a resource-limited environment is the main aim of this research.
This project feeds into two main streams. The first is to integrate on-chip sample preparation for biological applications, like therapeutic drug monitoring (TDM) and diagnostics, using nanojunctions created by controlled dielectric breakdown (Chapters One - Five). The second part focuses on fast prototyping of microfluidic devices with multiple integrated functionalities using a consumer-based 3D-printer (Chapters Six & Seven). These two approaches were tailored to solve specific problems inherent to each sample type and application.
xxi introduced on the other side of the separation channel and offset by a 500 µm. While the role of the first junction remains the same, extraction, the second junction made with smaller pore size blocks the analyte but permits smaller ions. The two nanojunctions work together as a trap that concentrates the injected plug and simultaneously desalt it. This approach is very flexible and can be tuned for different applications as demonstrated in the following chapters.
Chapter Two is an introduction to microfluidic systems used for analysis of small molecules, especially pharmaceuticals, in biological samples. The methods were reviewed regarding the hardware and fluid handling processes. The chapter concludes by discussing the requirements for point-of-care devices and decision making based on the results obtained. There are still many challenges and issues that need to be addressed before the wide spread use of these devices becomes a reality.
xxii examples: quinine (an example for positively charged drug) and ampicillin (an example for negatively charged drug). Quinine is a counter-ion at the experimental conditions employed, which is also the case for many pharmaceuticals like antidepressants, and hence its transport is favoured through the negatively charged nanojunction. A single nanojunction was integrated between the sample compartment and the separation channel of the microfluidic device for extraction. Peak mode ITP was employed to concentrate the injected plug and achieve a linear response that covers the therapeutically relevant range. Direct fluorescence detection was feasible due to the native fluorescence of quinine.
Finally, SMTs were employed for TDM of ampicillin. This eliminated the need to use other preconcentrating techniques like ITP. The electroosmotic flow (EOF) can be tuned in relation to the electrophoretic mobility by carefully selecting the buffers in the separation channel and the waste/desalting channel. This enables trapping of ions within a certain size/mobility range. Ampicillin is one of the front line antibiotics used for managing sepsis, a critical condition with 30-50% mortality rate. The device may facilitate accurate dose adjustment and improve the survival of septic patients.
xxiii biopolymer applications. The single nanojunction format was employed to concentrate sodium dodecyl sulphate (SDS)-protein complexes from high ionic strength buffers. Enhancement factors up to 80-fold were achieved within 200 s. The above mentioned SMTs were employed for the direct extraction of short single strand DNA (ssDNA), 20 bases, from blood. As examined with small molecules, DNA molecules were extracted into the separation channel while cells and proteins were blocked. The second nanojunction trapped the DNA in the separation channel leading to simultaneous concentration and desalting. The LOD achieved for fluorescein labelled DNA was 12.5 nM.
Chapter Six is an introduction to 3D-printing. Different modes were discussed and compared regarding their capabilities and suitability for microfluidic applications. This was followed by brief discussion of the recent portable systems reported for environmental analysis and design requirements in comparison to biological samples.
xxiv tool for small research laboratories.
xxv Personalized medicine promises better clinical outcomes and better global health but socioeconomic factors hinder its wide application. It relies on genetic testing and TDM to ensure that the right drug is prescribed for the patient at the optimum amount and dosing interval thus improving efficacy and minimizing toxicity. Most of the effort so far has been developing genetic tests as these provide information for better matching of the drug and patient individuality with an increasing number of instances where the US Food and Drug Administration (FDA) recommends genotyping before treatment, for example warfarin, clopidogrel and tamoxifen. While this information is highly valuable to ensure the desired suitability of the drug for the patient, these tests fail to identify intra-patient pharmacokinetic variability that evolves due to a progressing disease state, drug-drug interaction, or even dietary and life style changes.
Information regarding the pharmacokinetics can be obtained when analysing the patients’ sample as done in the traditional context of TDM to ensure correct administration of narrow therapeutic window drugs. Conventional analytical methods, however, are restricted to central laboratories equipped with complicated instrumentation and are operated by professionally trained personnel. The required sample and reagent volumes are in the order of mL and turnaround times range from hours to days. Broadening the application of TDM in this context will cause a significant financial burden, overload clinical laboratories and struggle to meet the timeframe required between collection and corrective action.
xxvi of-care (POC) devices based on this concept involves the integration of multiple processes into a low-cost, portable platform that is easy to use without compromising the quality of results. An excellent and well-established example that demonstrates the significance of such devices is the glucose blood meters.2
The extraction of the target analytes from biological samples is still the bottleneck in analysis and in the development of novel instrumentation for POC analysis. Unless a specific enzyme mediated or immunoassay is utilized, direct measurement of pharmaceuticals in whole blood requires sample pretreatment to remove blood cells, plasma proteins, and endogenous macromolecules. It is only integration of these and other analytical steps into a microfluidic platform capable of conducting the analysis in a fully automated manner is required for at-home monitoring or POC analysis.
xxvii range of changes in layout. When fast concept-to-chip time is a priority, one-step manufacturing techniques are favoured over conventional methods.3 For advanced fluidic functionality and/or when the footprint of the device are important, three dimensional (3D) structures are gaining interest. Conventional lithography-based processes, however, typically avoid 3D designs as this significantly increases the cost and complexity of the manufacturing process. The ability to transform digital designs directly into physical models, without the need for masks, will not only speed up the fabrication process, it will also make practical evaluation of different designs faster and easier. 3D manufacturing techniques can be subtractive through removal of material or additive through fused deposition modelling (FDM),4 or photo-fabrication.5 Additive methods in particular have developed rapidly over the past decade and there are now a number of different approaches and materials available to the consumers and professional markets.6 I employed a low cost desktop 3D-pinter to fabricate micro- to millifluidic devices with different functionalities for different applications.
P
ROJECT
A
IMS
• Create nanojunctions with defined permeability ranges using the controlled dielectric breakdown of poly(dimethylsiloxane) (PDMS).
• Demonstrate the use of the nanojunctions for selective electrokinetic transport including the extraction of small molecules from complex matrices like whole blood.
xxviii applications.
xxix 1. Manz, A.; Graber, N.; Widmer, H. M., Miniaturized total chemical analysis systems: A novel concept for chemical sensing. Sensors and Actuators B: Chemical 1990, 1 (1–6), 244-248.
2. (a) Sönksen, P. H.; Judd, S. L.; Lowy, C., Home monitoring of blood-glucose: Method for improving diabetic control. The Lancet 1978, 311 (8067), 729-732; (b) Walford, S.; Gale, E. A. M.; Allison, S. P.; Tattersall, R. B., Self-monitoring of blood-glucose: Improvement of diabetic control. The Lancet 1978, 311 (8067), 732-735.
3. Waldbaur, A.; Rapp, H.; Lange, K.; Rapp, B. E., Let there be chip-towards rapid prototyping of microfluidic devices: one-step manufacturing processes. Analytical Methods 2011, 3 (12), 2681-2716.
xxx stereolithography. U.S. Patent 4,575,330, March 11, 1986; (b) Ikuta, K.; Hirowatari, K. In Real three dimensional micro fabrication using stereo lithography and metal molding, Micro Electro Mechanical Systems, 1993, MEMS '93, Proceedings An Investigation of Micro Structures, Sensors, Actuators, Machines and Systems. IEEE., 7-10 Feb 1993; 1993; pp 42-47.
! xxxi! TABLE OF CONTENT
DECLARATION OF ORIGINALITY ... ii
AUTHORITY OF ACCESS ... ii
STATEMENT OF ETHICAL CONDUCT ... ii
ACKNOWLEDGEMENTS ... iv
STATEMENT OF CO-AUTHORSHIP ... v
LIST OF PUBLICATIONS ... viii
LIST OF ABBREVIATIONS ... xiii
ABSTRACT ... xx
PREFACE ... xxv
PROJECT AIMS ... xxvii
References ... xxix
TABLE OF CONTENT ... xxxi !
1 Nanofluidics for Point-of-care (POC) Devices ... 2 1.1 Introduction to nanofluidics ... 2 1.1.1 Nanometric Length Scales ... 2 1.1.1.1 Bjerrum Length (!") ... 3
1.1.1.2 Debye Length Scale ... 4 1.1.1.3 Dukhin Length (!"#) and Dukhin Number (Du) ... 7
! xlii! injection point to the buffer waste (BW). The sample waste (SW) V-channel was filled with 50 mM Tris-HCl (pH 6.8) with 2.5% HPMC. An extra reservoir (S) was filled with fluorescamine labelled SDS-protein. ____________________________ 130 5.2 Stacking of fluorescamine-labelled SDS-insulin at the nanojunction interface during the injection phase. __________________________________________________ 133 5.3 Effect of injection time on the peak height of the concentrated protein. _________ 133 5.4 80-fold enrichment of SDS-insulin at the nanojunction (blue trace) as compared with standard pinched injection (red trace, zoom-in on the right). __________________ 134 5.5 7-fold enrichment of SDS-apotransferrin at the nanojunction (blue trace) as compared with standard pinched injection (red trace, zoom-in on the right). ______________ 134 5.6 Electropherogram of the size-based separation of 4 SDS-proteins; insulin (INS), β
! xliii! All conditions are similar to Figure 5.8 except that the stock dilution was made in
10 mM phosphate buffer, pH 6.5. _______________________________________ 142
5.10 Effect of sample matrix. Electropherograms of 50 nM DNA injected from different
sample matrices (10 mM phosphate buffer, 100 mM phosphate buffer and blood). 143
5.11 Electropherograms for DNA in blood at different concentrations (12.5, 50 and
500 nM). The scale for the electropherogram on the right was adjusted to focus on the
lowest DNA concentration that can be detected quantitatively. ________________ 144
6.1 Schematic of an FDM 3D printer. In this method, plastic filament is directed into a
heating block where it is heated to a semimolten state. The molten material can be
printed onto an adjustable stage to form a layer of the desired object. The stage is
adjusted (lowered) and another semimolten layer is printed. "Reprinted with
permission from Gross, B. C.; Erkal, J. L.; Lockwood, S. Y.; Chen, C.; Spence, D.
M., Evaluation of 3D Printing and Its Potential Impact on Biotechnology and the
Chemical Sciences. Analytical Chemistry 2014, 86 (7), 3240-3253. Copyright (2014)
American Chemical Society." __________________________________________ 150
6.2 (A) Schematic of a bath configuration stereolithography (SLA) printer with a direct
write curing process. A single laser moves along the surface of the resin, row by row,
until completely curing the desired layer. (B) Schematic of a layer configuration SLA
printer with a projection based curing method. In the projection based curing method,
the digital mirror device allows for a whole layer to be cured simultaneously.
"Adopted with permission from Gross, B. C.; Erkal, J. L.; Lockwood, S. Y.; Chen, C.;
Spence, D. M., Evaluation of 3D Printing and Its Potential Impact on Biotechnology
and the Chemical Sciences. Analytical Chemistry 2014, 86 (7), 3240-3253. Copyright
! xlv! Square columns and channels (x and y dimensions equal across a row) designed to be 250, 200, 150, 100 and 50 µm from top to bottom. _________________________ 182 7.4 Round concentric steps printed to examine the z-resolution. (A) Photo of four concentric circular steps with varying heights of 50, 100, 150 and 200 µm (from left to right). (B) SEM image of steps that are 50 µm high each printed with an exposure time of 3.5 s. (C) SEM image revealing diamond shape pattern on the surface due to uneven light intensity of each pixel. _____________________________________ 183 7.5 Sliced image for the design printed in Figure 7.3, columns are not shown in this image. White areas represent areas where the light intensity will reach the threshold to cure the resin. Black areas are underexposed and the uncured resin will be washed away during the cleaning process. Channels and squares dimensions were drawn in
AutoCAD to be; 50, 100, 150, 200, 250, 300, 350, 400 and 500 µm. Unequal
dimensions of the squares and the missing horizontal channel indicate 50 or 100 µm
Nanofluidics for Point-of-care
2
1
Nanofluidics for Point-of-care (POC) Devices
1.1 Introduction to nanofluidics
Natural systems rely on nanofluidics to perform efficiently at the lowest energy cost possible. The dream to imitate these systems and study them in a controlled environment became possible when advances in microelectronics opened the way to fabricate nanostructures. As a result, nanofluidics emerged as a fast growing field to describe the astonishing fluid behaviour in confined nanometre geometry where at least one dimension is smaller than 100 nm. Contrary to microscale structures, molecular size and electric double layer (EDL) thickness can no longer be neglected and the surface properties have more profound effects leading to unique physical and transport phenomena.1 Models that apply to microfluidics fail to predict or describe nanofluidic behaviour and new laws govern the mass transport and fluid flow. Furthermore, nanojunctions and interfaces integrated within a microfluidic system produce new effects that enable multiple processes to be performed more efficiently, faster and at lower cost. There is a lot to be understood and unveiled about nanofluidic behaviour and it will continue to inspire researchers for years to come.
1.1.1 Nanometric Length Scales
3 Figure 1.1 Various length scales at play in nanofluidics. Reproduced Ref 2 with permission of The Royal Society of Chemistry.
1.1.1.1 Bjerrum Length (!!)
Bjerrum length (!!) is the distance at which the electrostatic interaction Vel between two charged species becomes comparable to the thermal energy (!!!), as defined in Equation 1-1 where !! is the Boltzman constant and T is the absolute temperature in Kelvin.2
!!"! !! ≈!!!! Equation 1-1
which can be also be written for an ion in a dielectric medium at certain
temperature as;
!! =!!!"#!!!!!! Equation 1-2
For a univalent ion (Z = 1) in water at ambient temperature, !! = 0.7 nm
which is common to biological systems but not yet achievable by current
4 be observed for multivalent ions in a medium with low dielectric constant (ε) like organic solvents, where e is the elementary charge.
1.1.1.2 Debye Length Scale
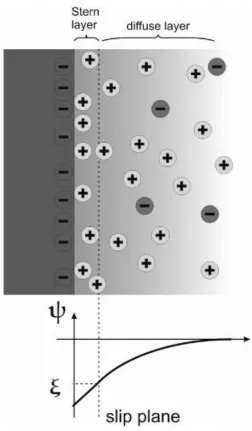
When a solution comes into contact with a charged surface, an EDL forms (Figure 1.2).3 The Stern layer closer to the solid surface consists of counter ions, cations in case of negatively charged surfaces, and can be considered as immobile. This layer is held strongly by electrostatic interactions to neutralize the surface and counter ion concentration is higher than in the bulk solution. The second layer, the diffuse layer, contains co-ions and counter-ions. The higher concentration of counter ions in the Stern layer compared to the adjacent diffuse layer leads to the evolution of the zeta potential (!) at the shear plane. The ion distribution between the EDL and bulk solution is described by the famous Boltzmann distribution equation;
c! =!!!!!"# −!!!!"
!" Equation 1-3
Where (c!) is the ionic concentration in the EDL and (!!) is the bulk ion concentration.
The screening length of the EDL, the Debye length (λD), represents the local balance between the electromigration towards the surface and diffusion away from it4 and can be defined based on the Poisson-Boltzmann theory in terms of the bulk ionic strength (!!).
!! =! !
!!!!!! Equation 1-4
5 is the case when handling most biological samples (λD = 1 nm for an aqueous solution of a monovalent symmetric electrolyte !! = 0.1 M). At very low ionic strength buffers, the λD may reach few tens of nanometers (λD = 30 nm for !! = 10-4 M).
The EDL plays a major role in ion transport through nanochannels under an applied electric field, as it is the region where volume electric forces (fe) take place. The magnitude of these forces is defined by the charge density (!!) and the applied electric field (!!).
!! =!!!!! Equation 1-5
The Poisson-Boltzmann equation quantify the local ionic concentration ratio between the electroneutral bulk and a location inside the EDL at a certain potential relative to the bulk as described in the following equations
!! =!!!!! Equation 1-6
!! =!!!!! Equation 1-7
7 1.1.1.3 Dukhin Length (!!") and Dukhin Number (Du)
The excess counter ion near the solid surface of the nanochannel leads to surface conductivity different from the bulk conductivity inside the nanochannel determined by the bulk ion concentration (Co). The Dukhin length is defined as the surface to bulk conductivity ratio
!!" =!!!!
! Equation 1-8
Accordingly, for a nanochannel height (h), the Dukhin number (Du), a dimensionless term, is defined as
!"=! !! !!!=!
!!"
! Equation 1-9
Large values (>1) indicate higher nanochannel ion selectivity due to surface dominated ion transport even in the absence of EDL overlap.5 While both the Dukhin length and the Debye length increase with decreasing the ionic strength, the Dukhin number takes into account the nanochannel dimensions and the entrance effects under non-equilibrium conditions. When the EDL almost overlap, the Dukhin number becomes very large extending outside the nanochanel and consequently defines the electric field lines at the nanochannel entrance. Dukhin numbers can be used to predict the kind of ion concentration polarization (ICP), propagating or non-propagating, and the extent of micromixing near nano-/microchannel junctions.
8 1.1.1.4 Slip Lengths (b) and Surface Friction
Navier length or slip length (b) describes the friction of the fluid at the interface and affect ion transport at charged surfaces. Slip length for water strongly
depends on wettability and shows higher values for hydrophobic surfaces than hydrophilic ones which are negative and located at the plane of shear, few tens of
nanometres as compared to sub-nanometre.6 Interestingly, lengths in the micrometre range can be observed at nano-/micro-interfaces and enhanced fluid transport occurs when the pore size approaches b.
1.1.2 Electro-osmotic Flow (EOF) and Electrophoresis
As described before under section 1.1.1.2 Debye Length Scale, the EDL for
negatively charged surfaces comprises a dense layer of counter ions, cations. Under the influence of an applied electric field, cations near the solid surface will migrate towards the cathode while dragging water molecules creating a normal or cathodic
EOF. In contrast to microchannels, the profile of EOF in nanochannels is no longer flat as the geometry approaches the !!.7 The direction of the EOF is determined by the type of the surface charge, positive or negative, but its magnitude is the net result
of many factors.
Hydrophobic surfaces exhibit low liquid-solid friction with high slip length (b) values. The large slippage results in high EOF velocity (!!") by amplifying the surface zeta potential (!) which inturn is related to the electrostatic surface potential
9 !!" =!!"
! Equation 1-10
!=!!! 1+!!
! Equation 1-11
Equation 1-11 explains why hydrophobic surfaces may show much higher zeta potential (!) than hydrophilic surfaces with similar surface electrostatic potential !!.
1.1.3 Ion Permselectivity and Ion Concentration Polarization (ICP)
Nanochannels connecting two microchannels (also called nanojunction), with EDL overlap will develop a Donnan potential (VD) at the pore entrance and exit due to co-ion exclusion. The magnitude of VD is quantified by the ratio !!"/h and the following equation.
!! =!!!!!!log !!!
! Equation 1-12
where !! and !! are the negative and positive ion concentrations, respectively.
The nanochannel will have a uniform VD if the two microchannels are at equilibrium with the same electric potential and salt concentration. If an electric field
is applied across the nanochannel (ΔV) or a salt concentration difference exists across
the nanojunction (Δρs), an ion flux will develop.
10 nanochannel at a higher rate than diffusion such that a depletion zone develops at the
anodic side and an enrichment zone at the cathodic side of the nanochannel (Figure
1.3). Also, anions are excluded from entering the nanochannel and will accumulate at
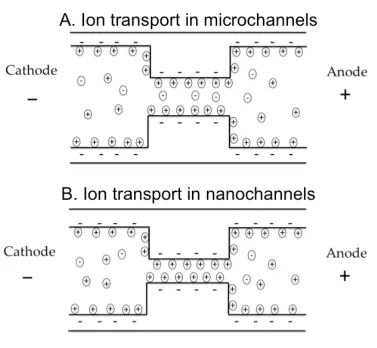
11 Figure 1.3 Schematic explaining the difference between ion transport in
microchannels and in nanochannels with EDL overlap. The permselectivity of the
[image:58.595.110.487.97.445.2]12 Current-voltage curves for nanochannels with EDL overlap comprise three
distinct regions. First, an Ohmic regime in which the current increases linearly with
the applied voltage. Second, the current saturates and does not increase at the same
rate beyond a certain value, the limiting current. This stage marks the onset of ICP.
Depletion zones at the anodic side of the nanojunction are extremely low in ion
concentration, i.e. there are very few free ions to carry the current. This stage does not
continue beyond a certain point as EOF imbalance at the depletion zone boundary
creates vortices and fast mixing. The third regime is characterized by a sudden
increase in current, the over-limiting current, as the fast mixing suddenly delivers ions
into the depletion zones.9
Due to the small pore size of nanochannels, the size contribution of small ions
can no longer be neglected especially when the hydrated ion radius is considered.5a As mentioned before, the Debye length (!!) reflects a local balance between the
electromigration of counter ions towards the surface and their diffusion away from the
surface. While EDL effects on ion transport can be neglected in microchannels, they
play a major role in ion transport in nanochannels. Ion interaction with the EDL is
complicated by the variable viscosity and permittivity within the EDL. The
non-uniform transverse electric fields within the nanochannels leads to a transverse
concentration gradient that can be defined by an analyte-specific length scale (λS) that is a function of the ion valence number, !!, ! and temperature.4 Consequently, ion
transport is a function of EDL thickness, surface charge density, ion valence and of
course its electrophoretic mobility.10 Moreover, at low electrokinetic radius (h/λD < 4) and high surface to volume ratio, electrophoretic separations may turn into
chromatographic separations due to intensified adsorption effects even for weakly
13 1.1.4 Conductivity: Surface versus Bulk
14 1.2 Dielectric Breakdown for creating nanojunctions
Dielectric breakdown is one of the easiest methods for seamless integration of nanojunctions into a microfluidic device because only the micron-sized channels need
to be patterned and bonded, overcoming the difficulty associated with making microfluidic chips with nanochannels. Typically, the chip design includes a
10-100 µm wide structure separating two microchannels filled with electrolyte solution.
Thermal and mechanical failure of this structure by applying high voltage that
exceeds the dielectric strength introduces nanojunctions that connect the two microchannels leading to increased ion transport and measured current. Before the
breakdown, no current can be detected and a sharp increase in current can be observed when the connection between the two microchannels is established. The resistance of the nanojunction is a function of its pore size, length, electrolyte ionic strength and
applied electric field. Consequently, a larger pore size results in a higher current if all other variables are kept constant.
Dielectric breakdown has been reported for integrating nanojunctions into microfluidic devices using different materials such as PDMS,12 glass,13 toner14 and solid-state insulating membranes.15 Reported applications include selective reagent dispensing,12a protein preconcentration12b-d and solution mixing,12e but none of these reported control of the breakdown process to obtain control of the nanojunctions
transport properties. Shortly after the publication of the work described in this thesis, nanopores with sub-nm precision were reported for DNA sequencing by another group using thin insulating membranes of silicone nitride.15
In the following sections, two configurations using the controlled dielectric breakdown of PDMS are presented for the creation of a single nanojunction device,
15 demonstrate control over the dielectric breakdown process, limiting the pore size using the current throughout the breakdown process. This device was applied for the extraction of drugs and small molecular weight biomarkers from blood and for the concentration of large biomolecules like SDS-protein complexes from high ionic strength buffers. The dual nanojunction device was used to introduce a SMT for the simultaneous extraction, concentration and desalting of analytes within specific size/mobility range, directly from blood. This approach was applied for small molecules and short ssDNA.
1.2.1 Single Dielectric Breakdown
1.2.1.1 Microfluidic Device
The microfluidic device is hybrid PDMS/glass with the design shown in Figure 1.4. The PDMS layer formed the top containing the microfluidic structures and was sealed to a glass slide that formed the floor of the channels. All microchannels were
30 µm deep. All separation channels were 50 µm wide while the V-channels were
16 Cured PDMS and soda glass slide were plasma treated with handheld corona
discharge device16 (model BD-20, 230 V power supply, Electro Technic Products) for
15 s and placed in conformal contact for 12 h at 65oC for irreversible bonding. In
reversibly bound devices, the applied voltage caused the PDMS to lift off the glass
surface, forming gaps that continued to widen over time. Moreover, permeability was
greatly affected by PDMS fabrication conditions like degassing of the prepolymer
mixture and curing temperature as it affects the surface roughness of PDMS. Using
irreversibly bound devices prevented this problem and improved the reproducibility
of the method. Air plasma treatment oxidizes the PDMS creating a silica-like surface
stiffer than the native PDMS. Mills et al.17 reported that 4 min exposure will result in
a stiff layer that is 200 ± 40 nm thick and predicted the thickness to be proportional to
the square root of exposure time. Devices made with exposure time of 1 min showed
different results from those treated for 15 s. As the stiff silica-like layer is expected to
have a different dielectric strength from that of PDMS, it is important to keep the
18
1.2.1.2 Dielectric Breakdown Conditions
All microchannels were filled with the breakdown electrolyte; 1 or 10 mM
disodium hydrogen phosphate (Na2HPO4.2H2O). The applied breakdown electric field
used in this work 2200 V (22 V/µm) is just above the dielectric strength of PDMS
(21 V/µm). Before the formation of the nanojunctions, no current can be detected
when applying a high voltage just above the dielectric strength of the PDMS gap.
Preliminary breakdown experiments were performed using
5-(and-6)-carboxynaphthofluorescein (CFN) solution in the sample compartment and recording
the process with a charge coupled device (CCD) camera. Once the breakdown
occurred, as indicated by sudden increase in current and observation of spark
formation through the microscope, the power supply was manually switched off. The
formed channels were able to restrict most of the labelled proteins. The breakdown
electrolyte in this experiment was 10 mM phosphate solution because using a 1 mM
solution, it was difficult to detect the onset of the breakdown as the increase in current
was less sharp.
To achieve better control and repeatability, the high voltage supply was
controlled using a simple Labview 8.6 program (National Instruments, Austin, TX,
USA) adjusted the voltage output by monitoring the return current and kept the
current at the threshold defined by the user. Once the desired current was reached the
applied voltage was reduced, preventing further breakdown of the material. This
approach allowed for the formation of a specific pore size, and enhanced the
reproducibility as compared to other breakdown methods relying on the time and
potential difference. It was also found that operating at an electric field strength just
above the dielectric breakdown allows better control because the rise in current is
19 difference without causing pore widening. Another advantage using the proposed
conditions is that no bubble formation was observed which usually happens during
uncontrolled breakdown.
1.2.1.3 Permeability Studies
The relationship between nanojunction permeability and current limit was
investigated through a series of breakdown experiments using analytes of different
hydrodynamic size and charge, like small inorganic ions (effective hydrated radii of
about 0.3 nm), small organic molecules (0.3-0.5 nm), aromatic compounds
(0.5-1.0 nm) and labelled proteins (2-4 nm).5a
The determination of the exact pore size of the nanojunction was not practical
for a number of reasons. The pores are enclosed within the PDMS structure
preventing the use of scanning electron microscope. Calculation of the width using
current-voltage data requires a known and homogenous pore width. This is not
possible because the breakdown process results in the formation of a bundle of pores
with varying diameter along their length. Hence, the average size is best estimated
based on their permeability to different sized analytes; a mixture of CNF dye
(anionic) and fluorescamine-labelled bovine serum albumin (BSA). The effective
hydrodynamic radii of CNF and BSA are about 1 and 4 nm, respectively.5a
After formation of the nanojunctions, the main channels were filled with
10 mM phosphate, pH 9, to which 0.1% hydroxypropylmethyl cellulose (HPMC) was
added to suppress the EOF. The viscosity range for HPMC used is 2,600-5,600 cP,
2% in water at 20oC. A voltage of 400 V was applied between reservoirs (S) and
(SW) in Figure 1.4 to drive electrophoretic transport. At least 5 devices were tested
20 All solutions were prepared in Milli-Q water obtained from a Millipore (North
Ryde, Australia) purification system. CNF from Molecular Probes (Oregon, USA)
was prepared in 10 mM phosphate solution (pH 11.7) to obtain 200 µg/mL solution.
BSA was labelled with fluorescamine by mixing 200 µL of 250 µg/mL in
10 mM phosphate and 0.9% (w/v) NaCl, with 20 µL of 10 mM fluorescamine in
acetone. BSA and fluorescamine were obtained from Sigma-Aldrich (Steinheim,
Germany) and NaCl from Merck (Darmstadt, Germany). The BGE was 10 mM
disodium hydrogen phosphate solution (pH 9.0) with 0.1% (w/v) HPMC from
Sigma-Aldrich (Steinheim, Germany) to suppress EOF.
Simultaneous transport of inorganic ions was done using 0.1 g/mL solutions of
iron (III) nitrate (Fe(NO3)3.9H2O) from ChemSupply (Beverley, S.A., Australia) and
potassium thiocyanate (KSCN) from Ajax chemicals (Sydney, Australia) in 100 mM
nitric acid (HNO3) from Merck (VIC, Australia).
Images and video footage of the permeability studies were recorded using a
Nikon high-definition colour CCD camera head (Digital Sight DS-Fi1c, Nikon,
Japan) and operated with NIS-Elements BR 3.10 software (Melville, NY, USA)
mounted on an inverted fluorescence microscope (Ti-U, Nikon, Tokyo, Japan).
Multiband pass excitation (λex at 390, 482, 563 and 640 nm) and emission (λem at 446,
523, 600 and 677 nm) filters (Semrock, Rochester, NY, USA) were used for all
experiments.
An in-house 4-channel (0-5 kV) dc power supply was used to apply an
electrical potential to each reservoir through a custom-designed interface connected to
5 platinum electrodes. Platinum electrodes connected to a single V-channel shared the
21
1.2.1.4 Results and Discussion
Under the experimental conditions, the PDMS surface is negatively charged. Different current limits were used to produce the nanojunctions and their permeability was evaluated experimentally. The results are summarised in Figure 1.5.
For a current limit of 10 µA using 10 mM buffer, the pores permitted a hydrodynamic flow from the sample V-channel into the separation channel. This suggests the formed channels may be up to a few µm in diameter because nanojunctions with pore size up to 200 nm will prevent hydrodynamic flow.18
When 5 µA was set as the current limit (Figure 1.5 top row), the resulting
nanojunctions prevented red blood cells (6-8 µm in size) from entering the separation
channel, while allowing electrophoretic transport of fluorescamine-labelled BSA. Decreasing the current limit to 3 µA (Figure 1.5 second row), allowed the
transport of anionic CNF, but not BSA. The transport of BSA (hydrodynamic radius ~4 nm) was restricted due to its size while CNF and R6G (~1 nm) passed through the nanojunctions regardless of their charge. However, when the EOF was not suppressed by HPMC in the separation channel, CNF could not be transported from the sample chamber into the separation channel, while the cationic dye R6G still passed through the nanojunction indicating the contribution of EOF towards the permeability of the nanojunction.
For nanojunctions formed with a current limit of 2 µA (Figure 1.5 third row),
22 nanojunction, but the free space available for transport is smaller than the hydrodynamic radius of CNF, thus preventing its transport. R6G has a similar size to CNF, but due to its positive charge, it can participate in the EDL and be transported
through the nanojunction.
Finally, using a current threshold of 1 µA (Figure 1.5 bottom row), the
nanojunction prevented transport of BSA, CNF and R6G, yet was still able to transport small ions, iron (III) and thiocyanate. The formation of the red iron (III)
thiocyanate complex on both sides of the nanojunctions indicates the simultaneous transport of both ions under suppressed EOF conditions, using 0.1 M HNO3 as BGE
and 400 V applied across the nanojunctions, reservoirs (S) and (SW). As this nanojunction was still able to transport small cations and anions (~0.3 nm), it indicates a smaller pore size in the nanojunction but not complete EDL overlap. In the
case of R6G, it is not clear whether R6G was excluded based on the size or if the strong adsorption to the nanochannel walls rendered them positive and therefore
selectively excluding cations. A characteristic voltage-current curve would help identify if the exclusion was size or ICP related. However, this procedure requires measuring very low currents, in the range of nA, which is not feasible using the
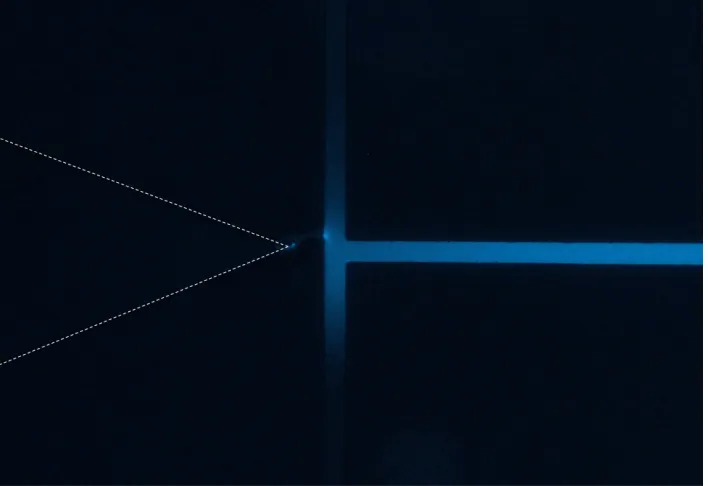
23 Figure 1.5 Screen shots from the movies recorded by the CCD camera of the
fluorescence microscope showing the permeability of nanochannels created with
decreasing current limits for red blood cells, labelled BSA (blue), CNF (red), R6G
(green) and the inorganic ions, iron (III) and thiocyanate. Images on the left show
24 As can be seen from the screen shots in Figure 1.5, the nanochannels in the
nanojunction were formed as a bundle of irregular interconnected structure also
known as ‘‘Lichtenberg’’ structure. The shape resembles a lightening, which is the
dielectric breakdown of air.
1.2.2 Double Dielectric Breakdown
1.2.2.1 Microfluidic Device
The microfluidic device is hybrid PDMS/glass with the design shown in Figure
1.6. All microchannels were 30 µm deep. The separation channel was 50 µm wide
while the V-channels were 500 µm wide. The tip of each V-channel was separated
from the separation channel by a 100 µm gap and offset from each other by 500 µm.
This offset distance allowed the two nanojunctions to communicate and form the
size/mobility trap (SMT). The total length of the separation channel was 60 mm and
the effective length from the injection point (first nanojunction) to the detection point
was 40.0 mm.
The device was fabricated and irreversibly bound using the same procedure
described under 1.2.1 Single Dielectric Breakdown (section 1.2.1.1 Microfluidic
25 Figure 1.6 Schematic diagram of the microfluidic design (dimensions not to
scale) showing the two V-channels and the main separation channel. All channels
[image:72.595.192.400.149.456.2]26 1.2.2.2 Dielectric Breakdown Conditions
Just before use, all channels were filled with the breakdown electrolyte;
10 mM phosphate buffer, pH 11. The extraction nanojunction was formed by
applying a breakdown voltage of 2200 V to the sample V-channel (S) while keeping
the separation channel grounded and setting the current limit to 5 µA using an
in-house regulated power supply. To form the concentration nanojunction, the electrode
was placed in the waste V-channel (SW) and the current limit was set to 0.5 µA. The
channels were then cleaned and refilled with the experimental solutions. For the first
use after the breakdown, reversed polarity was applied through the extraction
nanojunction at 1000 V till a current of 5 µA was reached then the proper voltage for
the experiment was set. The current limits were selected to trap small molecular
weight negatively charged organic molecules (200-1000 Da) and short ssDNA.
The breakdown voltage was supplied from a 2-channel power supply (0-3 kV)
with a built-in current feedback made in the UTAS Central Science Laboratory
Workshop. The voltage was terminated once the current limit was reached.
1.2.2.3 Extraction and Concentration Enhancement Studies
After nanojunction formation, the buffer was replaced by sample in the sample
V-channel and the separation channel was filled with 100 mM phosphate buffer,
pH 11.5, and 0.5% HPMC (unless stated otherwise) whilst the waste V-channel was
filled with 10 mM phosphate buffer, pH 11.5.
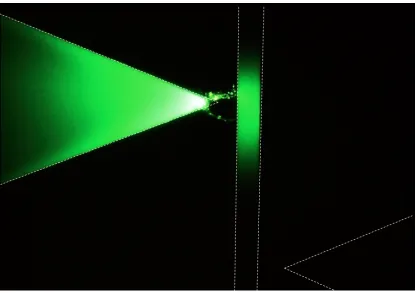
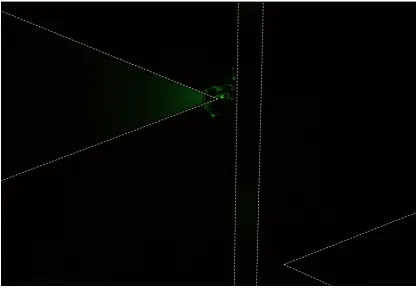
The ion depletion/enrichment zones were visualized by tracking anionic
fluorescent dyes added in the sample V-channel. All the flow motions and ion
transport images were obtained using an inverted fluorescence microscope integrated
27 Dielectric Breakdown (section 1.2.1.3 Permeability Studies). Quantitative
measurements were performed using a photomultiplier tube (PMT) (Hamamatsu
Photonics KK, Hamamatsu, Japan) connected to the microscope. Data acquisition was
made using an Agilent interface (35900E) connected to a laptop and operated by
Agilent ChemStation for LC software (Agilent Technologies, Waldbronn, Germany).
Multiband emission and excitation filters were used. An in-house 4-channel (0-5 kV)
dc power supply was used to apply an electrical potential to each reservoir through a
custom-designed interface connected to 6 platinum electrodes. Platinum electrodes
connected to a single V-channel shared the same voltage channel and hence provided
the same voltage.
1.2.2.4 Results and discussion
The SMT is based on preferential electrokinetic transport of ions through
nanochannels (Figure 1.7). The extraction nanojunction permits the transport of small
ions (< 1000 Da) through the free transport region not occupied by the EDL whilst
blocking the transport of cells and plasma proteins. The high ionic strength on both
sides of the extraction nanojunction, the use of HPMC to shield the surface charge
and the relatively large pore size delay the development of ICP and hence extend the
injection for small anions. Fluorescein is negatively charged at this pH, co-ion to the
negatively charged surface, and its transport through the extraction nanojunction into
the separation channel indicates little or no EDL overlap in this junction (Figure 1.8).
The applied voltage for injection was kept longer after the transport has stopped to
sharpen the concentrated analyte zone because the developing depletion zone from the
concentration nanojunction will prevent the collected analyte from moving beyond
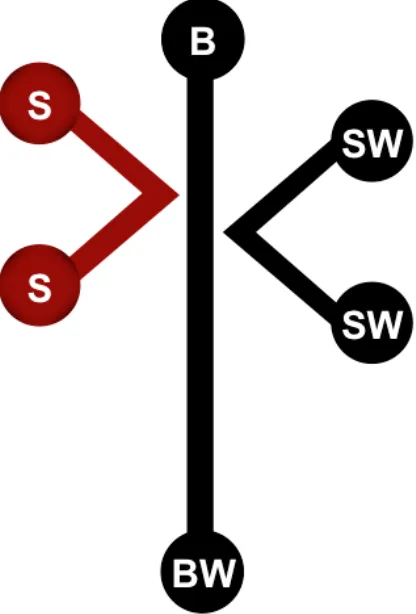
28 Figure 1.7 The concept of electrokinetic SMTs. Nanojunctions were formed
by controlled PDMS dielectric breakdown of the 100-µm wide barriers between the
tip of the V-channels and the separation channel under preset current limit. The
extraction nanojunction (left) has larger pore size than the desalting nanojunction
(right). Current limits were chosen to achieve pore size that enables trapping of small
30 The concentration nanojunction between the waste V-channel and the
separation channel was created with a 0.5 µA current limit selected to block the
transport of target analytes, modelled by fluorescein (332 Da), but allow the transport
of small inorganic ions in order to desalt the sample. A lower ionic strength, 10 mM
phosphate buffer, pH 11.5, was used to allow the application of higher voltages
without the risk of secondary breakdown. The EOF in the waste V-channel was not
suppressed as it was beneficial to prevent the small molecular weight anions from
passing through the nanochannels until the ICP is developed. Together the extraction
and concentration nanojunctions create the SMT in which molecules with a defined
size/mobility range can be extracted, concentrated, and desalted.
Figure 1.8 shows the efficacy of the SMTs using molecules of different
molecular weights. In the first panel, negatively charged BSA (MW ~66.5 kDa)
labelled with fluorescamine concentrates at the tip of the sample V-channel because
its size exceeds that of the free transport region within the extraction nanojunction.
The second panel shows the trapping of fluorescein, a small anion similar to many
pharmaceuticals, in the separation channel. The injected plug is trapped between the
two nanojunctions. The third panel illustrates the transport of a small inorganic anion,
thiocyanate, which migrates from the sample V-channel, through the extraction
nanojunction into the separation channel, then through the concentration nanojunction
into the waste V-channel filled with iron (III) where it forms a red complex,
establishing the directional transport of the thiocyanate ions. Whilst migration of iron
into the sample V-channel is also expected, the red colour was not observed in the
sample V-channel due to the high pH in this channel, which prevents the complex
31 selectively concentrate and desalt small organic molecules from both larger and
smaller ions.
The matrix ionic strength and viscosity were found to affect the amount of
transported ions (Figure 1.9). As the ionic strength and viscosity of the sample
increases, ion transport quickly decreases. The Nernst-Planck equation describes the
direct relation between the ion transport through the channel and the electric potential
gradient.
! ! =!−!!"(!!")−!"!"!"!"(!!" )+!!!"(!) Equation 1-13
where D, z, and C are the diffusion coefficient, charge of the permeation
species, and concentration, respectively. !"(!!") is the concentration gradient at distance
x, !"(!!" ) is the potential gradient and !!" is the electroosmotic velocity. The three
terms on the right-hand side of Equation 1-13 represent the contributions of diffusion,
electromigration and EOF, respectively.
The increased viscosity decreases the ion mobility and consequently lowers
the junction conductivity, which can be observed as decreased transport. But a
different effect of the viscosity modifier, HPMC, was observed when it was used in
the separation channel to suppress the bulk EOF. A concentrated fluorescein zone was
only formed when the EOF in the separation channel was suppressed using 0.25% or
more of HPMC.
Increasing the ionic strength of the BGE in the separation channel resulted in
corresponding increase in the fluorescein amount extracted. In the waste V-channel, a
lower ionic strength of 10 mM was used to allow the application of high voltage
32 The extent of the EOF through the concentration junction was controlled by its
pore size without using an EOF suppressor. If the pore size is larger than the
optimum, strong EOF will disturb the extracted zone. Without having the
concentrating junction, the extracted analyte zone will continue to diffuse and
broaden along the separation channel without effective concentration. Using the
SMTs, 100-fold enhancement factor of fluorescent dyes was achieved compared to
standard pinched injection in a conventional cross-channel with the same width and
depth and using the same applied voltages. Experiments using a mixture of
fluorescein and eosin showed that these dyes do not interfere with each other and
separation can be achieved without compromising the efficiency (peak width) of the
separation. This is illustrated in Figure 1.10, with the comparison of the
electropherograms obtained following a conventional pinched injection and the SMT