Identification of candidate genes
for devil facial tumour disease
tumourigenesis
Robyn L. Taylor
1, Yiru Zhang
2, Jennifer P. Schöning
2,4& Janine E. Deakin
3Devil facial tumour (DFT) disease, a transmissible cancer where the infectious agent is the tumour itself, has caused a dramatic decrease in Tasmanian devil numbers in the wild. The purpose of this study was to take a candidate gene/pathway approach to identify potentially perturbed genes or pathways in DFT. A fusion of chromosome 1 and X is posited as the initial event leading to the development of DFT, with the rearranged chromosome 1 material now stably maintained as the tumour spreads through the population. This hypothesis makes chromosome 1 a prime chromosome on which to search for mutations involved in tumourigenesis. As DFT1 has a Schwann cell origin, we selected genes commonly implicated in tumour pathways in human nerve cancers, or cancers more generally, to determine whether they were rearranged in DFT1, and mapped them using molecular cytogenetics. Many cancer-related genes were rearranged, such as the region containing the tumour suppressor NF2 and a copy gain for ERBB3, a member of the epidermal growth factor receptor family of receptor tyrosine kinases implicated in proliferation and invasion of tumours in humans. Our mapping results have provided strong candidates not previously detected by sequencing DFT1 genomes.
Tasmanian devils (Sarcophilus harrisii) are the world’s largest marsupial carnivores endemic to the island state of Tasmania, Australia. Wild Tasmanian devil populations have been succumbing to a clonal metastatic transmissi-ble cancer known as Devil Facial Tumour Disease (DFTD), which was first noticed in the mid 1990s in the North East corner of the state and has since spread rapidly across the wild devil population range of the island, dramati-cally reducing Tasmanian devil numbers and causing devils to be listed as an endangered species in 20091, 2.
DFTD is a soft tissue neoplasm of Schwann cell origin3, 4, often appearing within oral cavities and around the
jowls2, 5 that, so far, has no known pathogenic etiology or transmission route. DFTD is most likely transmitted
allogeneically where free live tumour cells metastasise from affected individuals to healthy individuals through intimate contact such as biting, which is a social behaviour in groups of devils6–9. It has been shown that the DFT
cells are not recognised by the devil immune system as ‘non-self’ and evasion of the immune system allows free live tumour cells to grow rapidly and metastasise10, 11.
Allogeneic transmission of clonal tumour cells, cells originating in one individual and continue passaging throughout different individuals and populations, accumulating genetic mutations over time, was suggested as the method of transmission following the observation that the karyotype of devil facial tumour (DFT) cells from different individuals were the same6, 12. The chromosomes from DFT cells were highly rearranged, with both
copies of chromosome 1 and X and one copy of chromosome 5 rearranged to form distinctive marker chromo-somes13 (Fig. 1). Genotyping of microsatellites, single nucleotide polymorphisms (SNPs) and major
histocompat-ibility complex (MHC) alleles as well as mitochondrial DNA sequencing have supported this theory of allogenic transmission, demonstrating that tumour genotypes did not match those of the their host and genotypes of tumours from different individuals were identical or near identical to each other3, 14–16. A second, independently
derived, transmissible tumour (DFT2) causing DFTD has been recently described in animals from the south east of Tasmania but it has a very different karyotype to the first tumour (DFT1) and most likely a different cellular origin17.
1School of Biological Sciences, University of Tasmania, Hobart, Tasmania, 7001, Australia. 2Research School of
Biology, The Australian National University, Canberra, ACT, 2601, Australia. 3Institute for Applied Ecology, University
of Canberra, Canberra, ACT, 2617, Australia. 4Australian Institute for Bioengineering and Nanotechnology, University
of Queensland, Queensland, 4067, Australia. Correspondence and requests for materials should be addressed to J.E.D. (email: janine.deakin@canberra.edu.au)
Received: 15 May 2017 Accepted: 14 July 2017 Published: xx xx xxxx
DFT1 is proposed to have arisen from telomeres on one homologue of chromosomes 1 and X becoming critically short, permitting the fusion of these two chromosomes, followed by a series of breakage-fusion-bridge cycles to ultimately result in their shattered appearance in the DFT1 karyotype13, 18. The transmissible tumour is
evolving as it as spreads through the devil population, accumulating mutations resulting in visible, karyotypic differences12. Four different karyotypes have been classified based on G-banding and are referred to as Strains 1
to 4 of DFT1. Strains 1 and 2 are the most common strains detected across Tasmania and differ by the presence of an additional marker chromosome in Strain 2; Strain 3 is geographically restricted to the Forrestier Peninsula; Strain 4, the most derived and potentially more virulent strain, is restricted to eastern Tasmania12. The use of these
classifications into strains may be misleading as similar magnitude differences have been detected within strains as between strains when more sensitive, molecular cytogenetic analyses were performed13. The karyotypic
differ-ences appear mainly in material from chromosomes 3, 4 and 512, 13 (Fig. 1) but the arrangement of chromosome
1 material in the tumour is stable, suggesting that this arrangement is required for the survival of the tumour13.
Mutations driving tumourigenesis in DFTD are yet to be identified. The emergence of a second transmissible tumour makes it imperative that we gain a better understanding of DFT tumourigenesis. It is challenging to deter-mine mutations contributing to tumorigenesis in human cancers, where there is access to matched tumour and host samples and extensive resources, including a well-assembled and annotated human reference genome19. In
DFTD, extra layers of difficulty exist for determining genes involved in tumourigenesis. Transcriptome sequenc-ing has determined a Schwann cell origin of DFT13, but identifying genes aberrantly expressed in the tumour is
limited by the lack of a Schwann cell control to compare with DFT1 expression. Attempts to isolate and estab-lish devil Schwann cell cultures have proven challenging (R. Taylor, unpubestab-lished). Moreover, two independ-ent genome projects have sequenced devil and DFT1 genomes, and have only detected a very small number of sequence mutations in genes that could potentially contribute to DFT1 tumourigenesis but no obvious driver candidates15, 16. Furthermore, the lack of a sample from the founder animal in which the tumour initially arose
leaves some doubt as to whether sequence differences are mutations that may affect gene function or merely poly-morphisms between different individuals. Considering the complex chromosome rearrangements in DFT113 and
the known role chromosome rearrangements can play in tumorigenesis in human cancers20, structural mutations
may play a prominent role in DFT1 tumourigenesis. Unfortunately, the current reference devil genome assembly is fragmented (over 35,000 scaffolds), making it challenging to reliably detect rearrangements, although some rearrangements have been detected and validated15.
As an alternative approach, we have exploited our understanding of the structural changes and the Schwann cell origin of the tumour to predict prime candidate genes that may be affected in DFT1, in order to identify potentially perturbed pathways for further investigation. The fusion of chromosome 1 and X is predicted to be the event leading to tumourigenesis in DFT113, 18, making the large chromosome 1 a logical place to start a search
for potential driver mutations, with strong candidate genes being those involved in tumourigenesis in peripheral nerve sheath tumours in humans. Firstly, we decided to test the stability of this chromosome through further mapping of bacterial artificial chromosome (BAC) clones on DFT1 chromosomes from three different samples for which there is already mapping data available13. Secondly, we selected cancer-related genes located on the
other autosomes. We predicted that genes located on devil chromosome 1 and 5 would be rearranged in DFT1 as these chromosomes are highly rearranged in the tumour, and genes on devil chromosomes 2 and 6 would not be perturbed as these chromosomes have few rearrangements13. Some regions of chromosome 4 are rearranged in
DFT113, so we predicted that it was possible that at least some of the cancer-related genes we selected from this
chromosome would be rearranged in the tumour. Our approach has given further support for the stable nature of chromosome 1 material in DFT1 and provided a means for selecting genes and pathways for further analysis for their role in DFT1 tumourigenesis.
Figure 1. The normal devil karyotype consists of 6 pairs of autosomes and a pair of sex chromosomes. In DFT1,
chromosome 1 and X material is spread across up to 5 marker chromosomes (M1-M5) (colour-coded to show their homology to devil chromosomes). Chromosomes varying between and within DFT1 strains are indicated by an asterisk, including the presence or absence of double minutes (DM). The karyotype has been arranged according to the original devil and standard dasyurid karyotypes46, differing from the karyotype presented by
[image:2.595.156.394.49.183.2]Results
We tested our hypothesis that the rearranged chromosome 1 material in DFT1 is stable and therefore, a likely chromosome to harbour mutations driving DFT1 tumourigenesis. We generated a dense map of devil chro-mosome 1 by mapping an additional 29 BACs to devil chrochro-mosome 1 and three DFT1 samples, with distinct karyotypic differences13 and from different geographic locations (Supplementary Figure S1). Then, we mapped
22 cancer-related genes to chromosome 1 and other autosomes to identify potentially perturbed genes/pathways in DFT1.
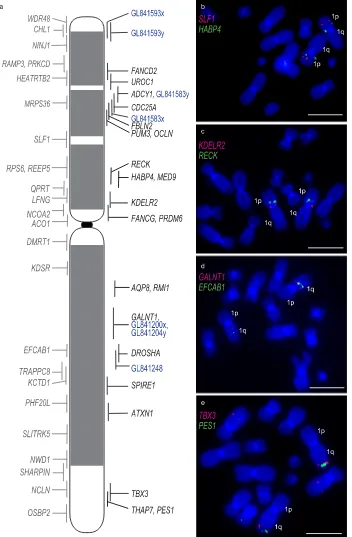
Dense cytogenetic map of chromosome 1 BACs on normal and DFT1 chromosomes.
The devil genome project, which sequenced flow sorted chromosomes, allowed genes to be assigned to normal devil chro-mosomes but their precise location on the chromosome was unknown15. We isolated BAC clones for mappingcorresponding to genes previously mapped to tammar wallaby chromosomes21 (to permit a direct comparison of
gene arrangement between marsupials if needed), or the ends of large (>3 Mbp) sequence scaffolds in the devil genome assembly (version 7.0). The genome coordinates of most BAC clones within the devil genome assembly were determined by sequencing the ends of each BAC clone (Supplementary Dataset 1A). The position of the 29 devil BAC clones on devil metaphase chromosomes was incorporated into the previous version of the cytogenetic map for chromosome 113 by a combination of ordering genes on the chromosome based on Flpter (fractional
length p arm terminus) values22 and further refined with two-colour FISH experiments for genes mapping to
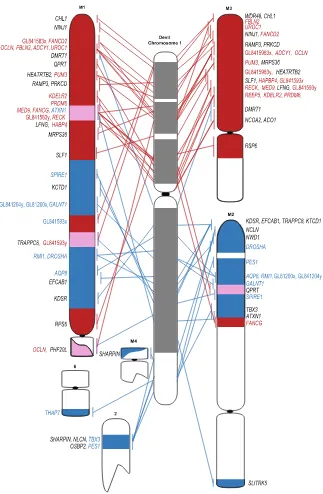
similar locations, resulting in a map consisting of 53 BAC clones distributed across the chromosome (Fig. 2). We then used DFT1 samples that had been used previously to construct the original cytogenetic map of the DFT1 tumours13 and compared gene locations between devil chromosome 1 and all three geographically isolated
tumours (Supplementary Figure S1). We detected no differences in the location of BACs between three different samples (Supplementary Dataset 1B). A comparison of the gene arrangement on devil chromosome 1 versus the combined data for the DFT1 arrangement demonstrates the highly rearranged nature of chromosome 1 DNA on marker chromosome 1 (M1) (Fig. 3). The other copy of chromosome 1 appears to have essentially split at the centromere (with only a few exceptions), with 1p material located on M3 and 1q DNA on M2.
Mapping cancer-related genes in DFT1.
We selected genes commonly implicated in tumour pathways in human malignant peripheral nerve sheath tumours (MPNSTs) or schwannomas (tumours of Schwann cells), as well as some genes often generally perturbed in human cancers, to determine if they were rearranged in DFT1 and therefore, candidates for contributing to DFT1 tumourigenesis (Table 1; Supplementary Dataset 1C). Based on previous molecular cytogenetic characterisation of devil and DFT1 genomes13, and genome sequenceinfor-mation15, we were able to predict which genes were most likely to be rearranged in devil facial tumours and those
unlikely to be affected by structural mutations. Our mapping data confirmed the chromosome assignment given in the genome assembly, localised candidate genes to specific sites on devil and DFT1 chromosomes and allowed us to test our predictions concerning the genes likely to be rearranged in DFT1. BACs were mapped to at least two DFT1 samples.
As predicted, genes located on chromosomes 1 and 5 were predominantly located on the rearranged deriva-tive chromosomes (Table 1). One stand-out candidate gene identified to be on chromosome 1 from sequencing of flow sorted chromosomes15 was NF2, a tumour suppressor gene located on human chromosome 22q12.2.
NF2 has been implicated in a diverse range of nervous system tumours, including those with a Schwann cell ori-gin23. Attempts to isolate BAC clones for this gene failed, despite multiple attempts with different overgo probes24
and two different devil BAC libraries, suggesting that this gene is not represented in either of the BAC librar-ies. However, we mapped two other BACs from the human 22q region, containing genes THAP7 and LZTR1
(VMRC49_433C15) and PES1 (VMRC49_253L6). OSBP2, also from this region, was previously mapped to distal 1q13. We aligned the devil scaffolds to a 10 Mbp region of the opossum genome (the marsupial genome currently
with the most contiguous assembly across this region) encompassing the NF2 gene. BAC end sequence data joins some of the devil reference genome scaffolds in this region (Fig. 4a). The genes in this region map very close together on the distal end of devil 1q (Fig. 3). The NF2 gene is the only gene annotated on the 199,584 bp scaffold, GL842060.1. Mapping of the genes corresponding to the 10 Mbp region surrounding opossum NF2
(THAP7/LZTR1, to PES1/OSBP2) onto DFT1 chromosomes shows that this region has undergone rearrange-ment in DFT1. One copy of PES1 and OSPB2 are located on the derived chromosome 2. The other copy of PES1
is located on marker chromosome 2 (M2). THAP7/LZTR1 does not map to either of these chromosomes (Figs 3 and 4b). Instead, the THAP7/LZTR1-containing BAC is located only on the derivative 6q (i.e. one copy has been deleted). OSBP2 has also previously been shown to have experienced a deletion of one copy and to only be present on the derivative chromosome 2 in DFT113 (Fig. 3).
All other genes selected from devil chromosome 1 were present in DFT1 in two copies, with some remaining in what appears to be a similar genomic context to what they are on devil chromosome 1, despite being located on marker chromosomes (Fig. 3). However, two of the four chromosome 5 genes have experienced a copy gain in DFT1; ERBB3 is located on the short arm of both copies of chromosome 4, as well as the long arm of M4, and
GALNT2 is located on the short arm of one homologue of chromosome 4, the short arm of chromosome 5 and the short arm of M2 (Fig. 5).
clone corresponding to the genome scaffold containing the NF1 gene, which demonstrated that this region of the genome has also experienced a copy gain in DFT1 (Fig. 5).
Cancer-related genes from chromosomes 2 and 6 were also mapped to test our prediction that these were unlikely to be rearranged in DFT1. This prediction was correct for three chromosome 2 genes, which each mapped to the same location on chromosome 2 on normal devil and DFT1 chromosomes from most samples. The one exception was DICER1, which localised to two locations on chromosome 2 in sample 11.3178 and was
Figure 2. (a) Map of normal devil chromosome 1, including genes from the first generation map13 shown to the
[image:4.595.156.508.47.584.2]amplified on double minutes (Fig. 6). Contrary to our prediction, EGF, the only gene mapped from devil chromo-some 6, was not located on chromochromo-some 6 but both copies mapped to chromochromo-some 2 (Fig. 5).
Discussion
It is challenging to determine mutations contributing to pathogenesis in human cancers, where there is access to extensive reference resources19. In DFT1, extra layers of difficulty exist for identifying mutations driving
tumour-igenesis. Considering the complex chromosome rearrangements in DFT1, structural mutations play a significant role in DFT1 pathogenesis but the current state of the devil reference genome assembly make the accurate identi-fication of structural mutations challenging based solely on sequence data. By employing a molecular cytogenetic approach to target candidate genes, we have detected strong candidates for further investigation for a role in
Figure 3. Comparison of consensus mapping data from three DFT1 strains with the location of genes on devil
[image:5.595.156.479.41.535.2]DFT1 pathogenesis. Of the 22 genes selected for mapping, those of particular interest for further investigation are those in a very different genomic context (e.g. located on a different chromosome) compared to the normal arrangement and/or show a change in copy number in the tumour common to all strains (Table 1).
The event leading to DFT1 tumourigenesis is proposed to be the fusion of chromosome 1 with an X chromo-some, which led to a series of breakage-fusion-bridge cycles and extensive rearrangement of chromosome 1 mate-rial on M113, 18. With this idea in mind, along with the now seemingly stable nature of the extensively rearranged
chromosome 1 material in DFT1, chromosome 1 is a likely source for DFT1 driver mutations. Although many genes have been implicated with cancer, we chose candidates based on their known association with nerve cell neoplasms or being commonly involved in cancers more generally. The strongest candidate on devil chromosome 1 is NF2. This hypothesis is based on the frequency of breakpoints in the region encompassing NF2 in humans (corresponding to 22q11-13) involved in MPNSTs26, 27, and the role of the loss or inactivation of NF2 in Schwann
cell tumours28. Although we were unable to isolate and map the NF2 gene as part of this study, we demonstrated
that this region of the DFT1 genome has undergone rearrangement and even some deletion, including the dele-tion of one copy of the tumour suppressor LZTR129 (Fig. 4b).
The additional mapping of chromosome 1 genes on devil and DFT1 chromosomes enabled a scenario for the initial chromosome rearrangements contributing to DFT1 tumourigenesis to be proposed (Fig. 7). Previous research has suggested the loss of telomeres led to the fusion of chromosomes 1 and X13, 18. Our mapping data
suggest the initial fusion most likely occurred close to the NF2 region at the distal end of 1q and the distal end of Xq. Therefore, the NF2 region would have been close to the original site of genome instability and a site of further instability, with this region being separated from the rest of chromosome (translocated to chromosome 2 and 6). The other copy of this region, located on chromosome M2 has also experienced rearrangement and even deletion (OSBP2, THAP7/LZTR1).
NF2 is a tumour suppressor involved in regulating intracellular signalling pathways and cell cycle progres-sion30. In schwannoma cells lacking NF2, epidermal growth factor receptor tyrosine kinases ErbB2, ErbB3 and
EFGR are overabundant on the cell surface, upregulating their downstream targets, thereby driving cell pro-liferation31–33. This is particularly interesting in light of the mapping of ERBB3 in DFT1. ERBB3 is in a very
different genomic context in the tumour (located on chromosome 4 rather than 5) and has experienced a copy number gain (Fig. 5). Consistent with the Schwann cell origin of DFT13, it is therefore not surprising to find
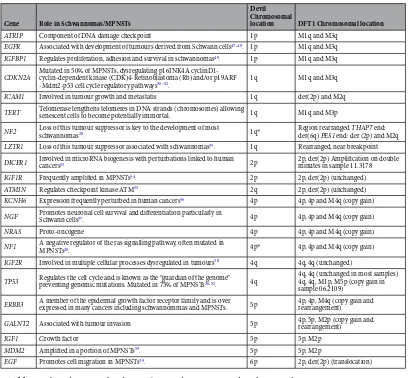
Gene Role in Schwannomas/MPNSTs
Devil Chromosomal
location DFT1 Chromosomal location
ATRIP Component of DNA damage checkpoint 1p M1q and M3q EGFR Associated with development of tumours derived from Schwann cells47, 48. 1p M1q and M3q IGFBP1 Regulates proliferation, adhesion and survival in schwannomas49. 1p M1q and M3q
CDKN2A Mutated in 50% of MPNSTs, dysregulating p16INK4A cyclinD1-cyclin-dependent kinase (CDK)4-Retinoblastoma (Rb) and/or p19ARF
-Mdm2-p53 cell cycle regulatory pathways50–52. 1q M1q and M3q ICAM1 Involved in tumour growth and metastatis 1q der(2p) and M2q TERT Telomerase lengthens telomeres in DNA strands (chromosomes) allowing senescent cells to become potentially immortal. 1q M1q and M3p
NF2 Loss of this tumour suppressor is key to the development of most schwannomas28. 1q* Region rearranged der(6q) PES1 end: der (2p) and M2qTHAP7 end: LZTR1 Loss of this tumour suppressor associated with schwannomas35. 1q Rearranged, near breakpoint DICER1 Involved in microRNA biogenesis with perturbations linked to human cancers53 2p 2p, der(2p) Amplification on double minutes in sample 11.3178 IGF1R Frequently amplified in MPNSTs54. 2p 2p, der(2p) (unchanged)
ATMIN Regulates checkpoint kinase ATM55 2q 2p, der(2p) (unchanged) KCNH6 Expression frequently perturbed in human cancers56 4p 4p, 4p and M4q (copy gain) NGF Promotes neuronal cell survival and differentiation particularly in Schwann cells57. 4p 4p, 4p and M4q (copy gain)
NRAS Proto-oncogene 4p 4p, 4p and M4q (copy gain)
NF1 A negative regulator of the ras signalling pathway, often mutated in MPNSTs28. 4p* 4p, 4p and M4q (copy gain) IGF2R Involved in multiple cellular processes dysregulated in tumours58 4q 4q, 4q (unchanged)
TP53 Regulates the cell cycle and is known as the “guardian of the genome” preventing genomic mutations. Mutated in 75% of MPNSTs36, 52. 4q
4q, 4q (unchanged in most samples) 4q, 4q, M1p, M5p (copy gain in sample 06.2109)
ERBB3 A member of the epidermal growth factor receptor family and is over expressed in many cancers including schwannommas and MPNSTs. 5p 4p, 4p, M4q (copy gain and rearrangement)
GALNT2 Associated with tumour invasion 5p 4p, 5p, M2p (copy gain and rearrangement)
IGF1 Growth factor 5p 5p, M2p
MDM2 Amplified in a portion of MPNSTs59. 5p 5p, M2p
EGF Promotes cell migration in MPNSTs39. 6p 2p, der(2p) (translocation)
[image:6.595.147.557.43.421.2]ERBB3 and potentially NF2 the subject of structural mutations. NF2, ErbB3 and downstream effectors PI3K-Akt or MAPK signalling pathways are therefore prime candidates for future immunohistochemistry and functional studies to determine if they are involved in DFT1 tumourigenesis. It has recently been shown that elevated levels of ErbB3 are detectable in devil sera several months prior to visual tumour eruptions34 making it imperative that
the pathway involving NF2 and ErbB3 be prioritised for further investigation. Additionally, germline mutations in the tumour suppressor LZTR1 are associated with a predisposition for an inherited disorder responsible for the development of multiple schwannomas in humans35, making the entire NF2 region a high priority for further
investigation.
TP53 is commonly referred to as “the guardian of the genome” because of its central role as a cell cycle check-point and tumour suppressor. It is commonly mutated in many cancers, including approximately 75% of human MPNSTs, where mutations commonly result in deletion or loss of function of TP5336. It has only experienced a
copy gain in one of the samples tested (06.2109) (Fig. 6), which is interesting considering most MPNST muta-tions involve a p53 loss and raises quesmuta-tions as to whether this copy gain affects TP53 function in this strain. Transgenic mice with three copies of Trp53 had an enhanced response to DNA damage and an increased resist-ance to cresist-ancer37. It seems likely that TP53 function has been affected in DFT1 since there are four copies of this
gene. If appropriately regulated, these additional copies should enhance the role of TP53 in tumour suppression. However, two of these TP53 copies are in a completely different genomic context, being located on chromosomes M1 and M3, and may be aberrantly regulated.
Genome sequencing has previously failed to detect changes in copy number for chromosome 4, making the gain in copy number of TP53, the NF1 scaffold, KCNH6 and NGF (Fig. 5) an unexpected finding, whereas copy number gains for chromosome 5 had been previously reported15. Among the chromosome 4 genes,
Neurofibromin 1 (NF1) was the top candidate prior to mapping. NF1 is a tumour suppressor gene, where loss of function mutations are associated in humans with the autosomal dominant syndrome Neurofibromatosis type 1. Patients with this syndrome often develop MPNSTs, many of which are of Schwann cell origin38. The loss of NF1
function is seen as an early step in the development of neurofibromas, which then may progress to MPNST with mutations in other tumour suppressor genes such as TP53 and CDKN2A28. In this context, a copy gain for the NF1
region rather than a deletion, make it less likely that NF1 is a driver of DFT1 tumourigenesis. In additional, the extra copy of this region is also located on chromosome M4, a highly methylated chromosome compared to other DFT1 chromosomes18, which may be an indicator of transcriptional silencing of this chromosome and therefore,
may not alter the overall gene expression of genes on the NF1 scaffold. The copy number gains observed for NGF
and KCNH6 also have a low probability of being driver mutations of DFT1 as they are not on a chromosome pos-ited to be initially involved in the formation of the tumour. They also have two copies of the gene in their normal location. Like the NF1 scaffold, the additional copy of KNCH6 is located on chromosome M4. The additional copy of NGF is located chromosome M2 and may be aberrantly expressed.
The translocation of EGF (epidermal growth factor) from chromosome 6 to chromosome 2 in DFT1 was surprising, as rearrangements involving the movement of genes from chromosome 6 had not been previously detected. Finding both copies in the same location on chromosome 2 is intriguing and suggests that this region of chromosome 2 may have undergone repair to incorporate EGF on both chromosome 2 homologues. In MPNSTs, EGF promotes tumour migration39, making it another candidate for functional analysis.
The amplification of DICER1 on DFT1 double minutes in tumour 11.3178 (Fig. 4) may explain the anecdotal evidence that this is a more aggressive lineage (strain 4) of DFT1, killing animals more quickly than other strains and resulting in a reduced transmission rate12. DICER1 is a key gene involved in the biogenesis of microRNAs.
[image:7.595.156.550.47.206.2]The amplification of this gene may provide an explanation for the faster growth rate observed for strain 4 and its
presumed more aggressive nature12. Changes in the expression levels of DICER1, either an increase or decrease,
are associated with aggressive human cancers40. In particular, overexpression of DICER1 observed in human
tumours has been associated with enhanced cell proliferation41 and poor prognosis42. It would be interesting to
determine whether the amplification of DICER1 correlates with an increase in DICER1 expression and/or deter-mine the effect of amplification on DICER1 function.
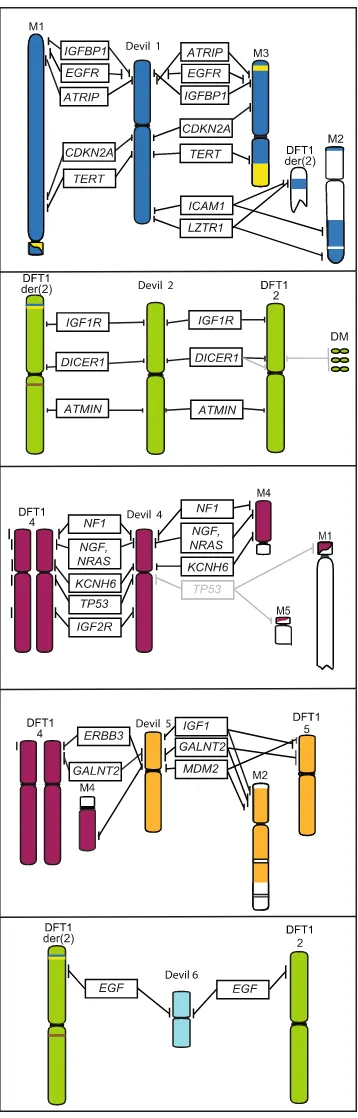
Figure 5. Location of cancer-related genes on devil and DFT1 chromosomes. Genes in grey indicate variations
[image:8.595.156.335.43.602.2]Figure 6. (a) TP53 is located on chromosome 4 on normal devil chromosomes and (b) in DFT1 sample 06.1926. (c) TP53 is located on two additional chromosomes (M1 and M5) in sample DFT1 06.2109. DICER1
localises to (d) chromosome 2 on normal devil chromosomes. (e) In DFT1 sample 11.3178, DICER1 is amplified on double minutes (indicated by arrows). (f) DAPI image to show that green fluorescent signals in (e) correspond to double minutes. Scale bars represent 10 μm.
Figure 7. Proposed scenario for the fusion of chromosome 1 and X leading to the formation of marker
[image:9.595.100.553.47.270.2] [image:9.595.153.394.362.590.2]Conclusions
We have confirmed the stable nature of chromosome 1 material in DFT1, supporting the hypothesis that the highly rearranged arrangement of chromosome 1 material is required to drive the tumour13. We have also
deter-mined the location of cancer-related genes on DFT1 chromosomes and identified a key genomic region and path-ways that are potentially perturbed in the tumour, warranting future analysis. This candidate gene approach has provided an alternative strategy for identifying genes contributing to DFT1 tumourigenesis in a non-traditional model species, with a fragmented reference genome assembly15 and lacking other critical resources. Future
research into rearrangements in DFT1 would benefit from an improved reference devil genome assembly and deep tumour sequencing. Such an improvement to the reference assembly is now within reach given the recent advances in sequencing approaches, such as high-throughput conformation capture sequencing, capa-ble of producing more contiguous genome assemblies from physical contact information43. Comparison of a
chromosome-level devil reference genome to devil facial tumour genomes would provide details of structural mutations at the base pair level and could be particularly powerful if combined with validation of rearrangements using molecular cytogenetics. Furthermore, it is imperative that a concerted effort be made to establish devil Schwann cell lines, which will be essential for the next steps to determine whether the functions of the prime can-didate genes and/or regions (e.g. NF2 region, including LZTR1, and ERBB3) are contributing to DFT1 tumour-igenesis. Future studies are required to determine whether the transcript and/or proteins of genes occurring in rearranged regions are perturbed, followed by in vitro experiments on devil Schwann cells and DFT1 cells. There will undoubtedly be a suite of genes involved in DFT1 tumourigenesis but those identified here provide a good starting place for a more in-depth understanding of the drivers of DFT1.
Methods
BAC library screening.
Overgo probes for (i) genes mapped in the tammar wallaby and located near the ends of human-opossum evolutionary conserved blocks21, (ii) sequences located near the ends of large sequencescaffolds in the devil genome assembly15 or (iii) for genes involved in human cancer. Devil genomic sequence
for the genes or regions of interest were obtained from Ensembl (genome assembly Devil_ref7.0) and used as input sequence for the Overgo Maker program developed by The Genome Institute at Washington University. BLASTN searches of the devil genome assembly were performed with the resulting 40 bp overgo probe in order to confirm the specificity of all probes. Only probes with a single match across the entire length of the probe were used for BAC library screening to avoid hybridization to paralogous sequences. All overgos used for screening are listed in Dataset 1. BAC library filters were screened with pools of overgos, radioactively labelled as described by Ross et al.24, with dot blots performed on the resulting positive BACs in order to determine the gene each BAC
contained following the protocol described by Deakin et al.44. In cases where overgos for genes failed to isolate a
BAC for the target gene, we screened the library with different overgos for a location elsewhere on the sequenced genome scaffold.
BACs were end sequenced by Macrogen (Korea) using primers pCC1
™
/pEpiFOS™
forward sequencing primer (5′ GGATGTGCTGCAAGGCGATTAAGTTGG 3′) and pCC1™
/pEpiFOS™
reverse sequencing Primer (5′ CTCGTATGTTGTGTGGAATTGTGAGC 3′). BAC end sequences were submitted to the GSS database (dbGSS Accession KS520996 - KS521086). BAC clones were confirmed to contain the gene of interest by BLASTN searching the devil genome assembly (Devil_ref v7.0), using the BAC end sequences as queries.Fluorescence
in situ
hybridization (FISH).
Devil metaphase chromosomes were prepared from a fibroblast cell line using standard methods previously described12. Blood and DFT1 samples were collectedunder approval of the Tasmanian Department of Primary Industries and Water Animal Ethics Committee and all methods were performed according to the relevant guidelines and regulations. Metaphase chro-mosomes were prepared by the Department of Primary Industries, Parks, Water and the Environment as previously described12.
DNA was extracted from 15 ml BAC clone cultures using the WIZARD Plus SV Minipreps DNA Purification System (Promega, Alexandria, NSW, Australia) using a slightly modified protocol; the volume of all reagents added prior to centrifugation to remove cell debris from the lysis process were doubled. Between 500 ng and 1 μg of DNA for each BAC was labelled by nick translation with either SpectrumGreen dUTP or SpectrumOrange dUTP (Abbott Molecular Inc., Des Plaines, IL, USA) and hybridized to normal devil or DFT chromosomes following the method described by Alsop et al.45. Unbound probe was washed off slides, counterstained and
mounted as described by Deakin et al.13. Chromosomes and BAC signals were visualized and captured using
either a Zeiss Axioplan2 epifluorescence microscope (Carl Zeiss Ltd, Cambridge, UK) fitted with a SPOT RT3 Monochrome charge coupled device (CCD) camera (Diagnostic Instruments Inc.) or Zeiss Axiocam MRm Scope A1 epifluorescence microscope fitted with an AxioCam Mrm Rev.3 CCD camera (Carl Zeiss Ltd). Measurements were taken to determine Flpter values using Adobe Photoshop software.
Data availability.
The datasets generated and/or analysed during the current study are available in the dbGSS repository (accession KS520996 - KS521086) or are included in this manuscript (and its Supplementary Information files).References
1. Hawkins, C. E. et al. Emerging disease and population decline of an island endemic, the Tasmanian devil Sarcophilus harrisii. Biol. Conserv. 131, 307–324 (2006).
2. Pyecroft, S. B. et al. Towards a case definition for devil facial tumour disease: What is it? Ecohealth 4, 346–351 (2007).
4. Tovar, C. et al. Tumor-specific diagnostic marker for transmissible facial tumors of Tasmanian devils: immunohistochemistry studies. Vet. Pathol. 48, 1195–203 (2011).
5. McCallum, H. Tasmanian devil facial tumour disease: lessons for conservation biology. Trends in Ecology and Evolution 23, 631–637 (2008).
6. Pearse, A.-M. & Swift, K. Allograft theory: transmission of devil facial-tumour disease. Nature 439, 549 (2006).
7. Hamede, R. K., Mccallum, H. & Jones, M. Biting injuries and transmission of Tasmanian devil facial tumour disease. J. Anim. Ecol. 82, 182–190 (2013).
8. Hamede, R. K., Mccallum, H. & Jones, M. Seasonal, demographic and density-related patterns of contact between Tasmanian devils (Sarcophilus harrisii): Implications for transmission of devil facial tumour disease. Austral Ecol. 33, 614–622 (2008).
9. McCallum, H. & Jones, M. To lose both would look like carelessness: Tasmanian devil facial tumour disease. PLoS Biol. 4, 1671–1674 (2006).
10. Woods, G. M. et al. The immune response of the Tasmanian devil (Sarcophilus harrisii) and devil facial tumour disease. Ecohealth 4, 338–345 (2007).
11. Siddle, H. V. et al. Reversible epigenetic down-regulation of MHC molecules by devil facial tumour disease illustrates immune escape by a contagious cancer. Proc. Natl. Acad. Sci. USA 110, 5103–8 (2013).
12. Pearse, A.-M. et al. Evolution in a transmissible cancer: a study of the chromosomal changes in devil facial tumor (DFT) as it spreads through the wild Tasmanian devil population. Cancer Genet. 205, 101–12 (2012).
13. Deakin, J. E. et al. Genomic restructuring in the tasmanian devil facial tumour: Chromosome painting and gene mapping provide clues to evolution of a transmissible tumour. PLoS Genet. 8, e1002483 (2012).
14. Siddle, H. V. et al. Transmission of a fatal clonal tumor by biting occurs due to depleted MHC diversity in a threatened carnivorous marsupial. Proc. Natl. Acad. Sci. USA 104, 16221–16226 (2007).
15. Murchison, E. P. et al. Genome Sequencing and Analysis of the Tasmanian Devil and Its Transmissible Cancer. Cell 148, 780–791 (2012).
16. Miller, W. et al. Genetic diversity and population structure of the endangered marsupial Sarcophilus harrisii (Tasmanian devil). Proc. Natl. Acad. Sci. USA 108, 12348–12353 (2011).
17. Pye, R. J. et al. A second transmissible cancer in Tasmanian devils. Proc. Natl. Acad. Sci. 113, 374–379 (2016).
18. Ingles, E. D. & Deakin, J. E. Global DNA Methylation patterns on marsupial and devil facial tumour chromosomes. Mol. Cytogenet. 8, 74 (2015).
19. Chin, L., Hahn, W. C., Getz, G. & Meyerson, M. Making sense of cancer genomic data. Genes Dev. 25, 534–555 (2011).
20. Gasparini, P., Sozzi, G. & Pierotti, M. The Role of Chromosomal Alterations in Human Cancer Development. J. Cell. Biochem. 102, 320–331 (2007).
21. Deakin, J. E. et al. Reconstruction of the ancestral marsupial karyotype from comparative gene maps. BMC Evol. Biol. 13, 258 (2013). 22. Lichter, P. et al. High-resolution mapping of human chromosome 11 by in situ hybridization with cosmid clones. Science 247, 64–69
(1990).
23. Kehrer-Sawatzki, H., Farschtschi, S., Mautner, V.-F. & Cooper, D. N. The molecular pathogenesis of schwannomatosis, a paradigm for the co-involvement of multiple tumour suppressor genes in tumorigenesis. Hum. Genet. 136, 129–148 (2016).
24. Ross, M., LaBrie, S., McPherson, J. & Stanton, V. In Current protocols in human genetics 5.6.1–5.6.52 (Wiley, 1999).
25. Cheng, Y. et al. Antigen-presenting genes and genomic copy number variations in the Tasmanian devil MHC. BMC Genomics 13, 87 (2012).
26. Bridge, R. S. et al. Recurrent chromosomal imbalances and structurally abnormal breakpoints within complex karyotypes of malignant peripheral nerve sheath tumour and malignant triton tumour: a cytogenetic and molecular cytogenetic study. J. Clin. Pathol. 57, 1172–8 (2004).
27. Plaat, B. E. C. et al. Computer-assisted cytogenetic analysis of 51 malignant peripheral-nerve- sheath tumors: Sporadic vs. neurofibromatosis-type-1-associated malignant schwannomas. Int. J. Cancer 83, 171–178 (1999).
28. Carroll, S. L. Molecular mechanisms promoting the pathogenesis of Schwann cell neoplasms. Acta Neuropathol. 123, 321–348 (2012).
29. Frattini, V. et al. The integrated landscape of driver genomic alterations in glioblastoma. Nat. Genet. 45, 1141–1149 (2013). 30. Beltrami, S., Kim, R. & Gordon, J. Neurofibomatosis Type 2 Protein,NF2:An uncoventional cell cycle regulator. Anticance Res 33,
1–11 (2013).
31. Obremski, V. J., Hall, A. M. & Fernadez-Valle, C. Merlin, the neurofibromatosis type 2 gene product, and beta1 integrin associate in isolated and differentiating Schwann cellstle. J. Neurobiol. 37, 487–501 (1998).
32. Lallemand, D. et al. Merlin regulates transmembrane receptor accumulation and signaling at the plasma membrane in primary mouse Schwann cells and in human schwannomas. Oncogene 28427, 854–865 (2009).
33. Morrison, H. et al. The NF2 tumor suppressor gene product, merlin, mediates contact inhibition of growth through interactions\ rwith CD44. Genes Dev. 15, 968–980 (2001).
34. Hayes, D. A. et al. ERBB3: A potential serum biomarker for early detection and therapeutic target for devil facial tumour 1 (DFT1).
PLoS One 12, e0177919 (2017).
35. Piotrowski, A. et al. Germline loss-of-function mutations in LZTR1 predispose to an inherited disorder of multiple schwannomas.
Nat Genet 46, 182–187 (2014).
36. Holtkamp, N. et al. MMP-13 and p53 in the progression of malignant peripheral nerve sheath tumors. Neoplasia 9, 671–677 (2007). 37. Garcia-Cao, I. “Super p53” mice exhibit enhanced DNA damage response, are tumor resistant and age normally. Embo J. 21,
6225–6235 (2002).
38. Farid, M. et al. Malignant peripheral nerve sheath tumors. Oncologist 19, 193–201 (2014).
39. Byer, S. J. et al. Malignant peripheral nerve sheath tumor invasion requires aberrantly expressed EGF receptors and is variably enhanced by multiple EGF family ligands. J. Neuropathol. Exp. Neurol. 72, 219–33 (2013).
40. Bai, Y. et al. Overexpression of DICER1 induced by the upregulation of GATA1 contributes to the proliferation and apoptosis of leukemia cells. Int. J. Oncol. 42, 1317–1324 (2013).
41. Jakymiw, A. et al. Overexpression of Dicer as a Result of Reduced let-7 microRNA Levels Contributes to Increased Cell Proliferation of Oral Cancer Cells. Genes, Chromosom. Cancer 49, 549–559 (2011).
42. Faber, C., Horst, D., Hlubek, F. & Kirchner, T. Overexpression of Dicer predicts poor survival in colorectal cancer. Eur. J. Cancer 47, 1414–9 (2011).
43. Flot, J.-F., Marie-Nelly, H. & Koszul, R. Contact genomics: scaffolding and phasing (meta)genomes using chromosome 3D physical signatures. FEBS Lett. 589, 2966–2974 (2015).
44. Deakin, J. E. et al. Physical map of two tammar wallaby chromosomes: A strategy for mapping in non-model mammals. Chromosom. Res. 16, 1159–1175 (2008).
45. Alsop, A. E. et al. Characterizing the chromosomes of the Australian model marsupial Macropus eugenii (tammar wallaby).
Chromosom. Res. 13, 627–636 (2005).
46. Martin, P. G. & Hayman, D. L. Quantitative comparisons between the karyotypes of Australian marsupials from three different superfamilies. Chromosoma 20, 290–310 (1967).
47. DeClue, J. E. et al. Epidermal growth factor receptor expression in neurofibromatosis type 1-related tumors and NF1 animal models.
48. Du, X., Yang, J., Ylipää, A. & Zhu, Z. Genomic amplification and high expression of EGFR are key targetable oncogenic events in malignant peripheral nerve sheath tumor. J. Hematol. Oncol. 6, 93 (2013).
49. Ammoun, S. et al. Insulin-like growth factor-binding protein-1 (IGFBP-1) regulates human schwannoma proliferation, adhesion and survival. Oncogene 31, 1710–1722 (2012).
50. Kourea, H. P., Orlow, I., Scheithauer, B. W., Cordon-Cardo, C. & Woodruff, J. M. Deletions of the INK4A gene occur in malignant peripheral nerve sheath tumors but not in neurofibromas. Am. J. Pathol. 155, 1855–60 (1999).
51. Nielsen, G. P. et al. Malignant transformation of neurofibromas in neurofibromatosis 1 is associated with CDKN2A/p16 inactivation.
Am. J. Pathol. 155, 1879–1884 (1999).
52. Carroll, S. L. The challenge of cancer genomics in rare nervous system neoplasms: Malignant peripheral nerve sheath tumors as a paradigm for cross-species comparative oncogenomics. Am. J. Pathol. 186, 464–477 (2016).
53. Gurtner, A., Falcone, E., Garibaldi, F. & Piaggio, G. Dysregulation of microRNA biogenesis in cancer: the impact of mutant p53 on Drosha complex activity. J. Exp. Clin. Cancer Res. 35, 9 (2016).
54. Yang, J. et al. Genomic and molecular characterization of malignant peripheral nerve sheath tumor identifies the IGF1R pathway as a primary target for treatment. Clin. Cancer Res. 17, 7563–7573 (2011).
55. Kanu, N. & Behrens, A. ATMINistrating ATM signalling: Regulation of ATM by ATMIN. Cell Cycle 7, 3483–3486 (2008). 56. Arcangeli, A. Expression and role of hERG channels in cancer cells. Novartis Found. Symp. 266, 225–32–4 (2005).
57. Piirsoo, M., Kaljas, A., Tamm, K. & Timmusk, T. Expression of NGF and GDNF family members and their receptors during peripheral nerve developments and differentiation of Schwann cells in vitro. Neurosci. Lett. 469, 135–140 (2010).
58. Martin-Kleiner, I. & Gall Troselj, K. Mannose-6-phosphate/insulin-like growth factor 2 receptor (M6P/IGF2R) in carcinogenesis.
Cancer Lett. 289, 11–22 (2010).
59. Wallander, M. L., Tripp, S. & Layfield, L. J. MDM2 amplification in malignant peripheral nerve sheath tumors correlates with p53 protein expression. Arch. Pathol. Lab. Med. 136, 95–99 (2012).
Acknowledgements
We thank Barrie Titulaer and Ian Muir for assistance with mapping experiments. We thank Beata Ujvari and Katrina Morris for assistance with overgo design. Robyn Taylor was supported by the Save the Tasmanian devil program. JED was supported by an Australian Research Council Future Fellowship (FT100100426).
Author Contributions
R.L.T. and J.E.D. conceived the study, designed overgos and screened the BAC libraries. J.P.S. and J.E.D. analysed BAC end sequence data. R.L.T., Y.Z., J.P.S. and J.E.D. performed FISH experiments and analysed data. R.L.T. and J.E.D. drafted the manuscript that all authors reviewed.
Additional Information
Supplementary information accompanies this paper at doi:10.1038/s41598-017-08908-9
Competing Interests: The authors declare that they have no competing interests.
Publisher's note: Springer Nature remains neutral with regard to jurisdictional claims in published maps and
institutional affiliations.
Open Access This article is licensed under a Creative Commons Attribution 4.0 International
License, which permits use, sharing, adaptation, distribution and reproduction in any medium or format, as long as you give appropriate credit to the original author(s) and the source, provide a link to the Cre-ative Commons license, and indicate if changes were made. The images or other third party material in this article are included in the article’s Creative Commons license, unless indicated otherwise in a credit line to the material. If material is not included in the article’s Creative Commons license and your intended use is not per-mitted by statutory regulation or exceeds the perper-mitted use, you will need to obtain permission directly from the copyright holder. To view a copy of this license, visit http://creativecommons.org/licenses/by/4.0/.