Inflammation is not a contributing factor in
the development of insulin resistance in diet
induced obesity in rats
By
Aascha Brown
BBiotech (Hons.)
Submitted in fulfilment of the requirements for the degree of
Doctor of Philosophy (Medical Research)
Menzies Institute for Medical Research
University of Tasmania
ii
TABLE OF CONTENTS
TABLE OF CONTENTS ... ii
ACKNOWLEDGEMENTS... v
STATEMENT ... vii
AUTHORITY OF ACCESS ... vii
ABSTRACT ... viii
ABBREVIATIONS ... x
PREFACE ... xi
CHAPTER 1 ... 1
INTRODUCTION ... 1
1.1 Diabetes ... 2
1.2 Insulin ... 3
1.2.1 Metabolic actions of Insulin ... 5
1.2.2 Vascular actions of Insulin ... 7
1.3 Insulin Resistance ... 9
1.3.1 Metabolic Insulin Resistance... 9
1.3.2 Vascular Insulin Resistance... 12
1.3.3 Inflammation in Insulin Resistance ... 14
1.4 Summary of research aims ... 19
CHAPTER 2 ... 20
MATERIALS AND METHODS ... 20
2.1 Animals ... 21
2.2 Anaesthetised Rat Experiments ... 21
2.2.1 Surgical Procedure ... 21
2.2.2 Muscle Glucose Uptake ... 22
2.2.3 Skeletal muscle microvascular perfusion ... 24
2.3 Gene Expression Experiments ... 24
2.3.1 Tissue Sample Preparations ... 24
2.3.2 RNA Extraction ... 24
iii
2.3.4 Calculation of Relative Gene Expression ... 26
CHAPTER 3 ... 27
SHORT-TERM DIET-INDUCED OBESITY AND INSULIN RESISTANCE IS NOT ASSOCIATED WITH INFLAMMATION IN RATS ... 27
3.1 Introduction ... 28
3.2 Materials and Methods ... 32
3.2.1 Animals ... 32
3.2.2 Protocol ... 33
3.2.3 Gene expression ... 34
3.2.4 Data and statistics ... 34
3.3 Results ... 35
3.4 Discussion ... 40
CHAPTER 4 ... 42
EFFECT OF FAT CONTENT AND DIET DURATION ON OBESITY, INSULIN RESISTANCE, AND INFLAMMATION ... 42
4.1 Introduction ... 43
4.2 Materials and Methods ... 46
4.2.1 Animals ... 46
4.2.2 Protocol ... 47
4.2.3 Gene expression ... 48
4.2.4 Data and statistics... 48
4.3 Results ... 49
4.4 Discussion ... 53
CHAPTER 5 ... 58
CAFETERIA-STYLE DIET INDUCES SIGNIFICANT OBESITY AND INSULIN RESISTANCE, BUT NOT INFLAMMATION IN RATS ... 58
5.1 Introduction ... 59
5.2 Materials and Methods ... 62
5.2.1 Animals ... 62
5.2.2 Protocol ... 63
5.2.3 Gene expression ... 64
5.2.4 Data and statistics ... 65
5.3 Results ... 66
5.3 Discussion ... 70
iv METFORMIN RESTORES SKELETAL MUSCLE INSULIN SENSITIVITY AND
MICROVASCULAR RECRUITMENT IN INSULIN RESISTANT RATS ... 74
6.1 Introduction ... 75
6.2 Materials and Methods ... 78
6.2.1 Animals ... 78
6.2.2 Protocol ... 79
6.2.3 Gene expression ... 80
6.2.4 Data and statistics ... 80
6.3 Results ... 81
6.4 Discussion ... 86
CHAPTER 7 ... 88
DISCUSSION ... 88
7.1 Findings and General Discussion ... 89
7.2 Implications ... 94
7.3 Limitations ... 97
7.4 Conclusions ... 100
CHAPTER 8 ... 102
v
ACKNOWLEDGEMENTS
First of all I would like to acknowledge and thank my supervisors Dr. Stephen Richards, Prof.
Stephen Rattigan, and Dr. Michelle Keske for their help and guidance with this project and
thesis.
Many thanks go to past and present members of the Muscle Research Group who have given
their time and friendship over the years. I would especially like to thank Eloise Bradley, Dr.
Dino Premilovac, and Dr. Helena Ng who taught me many of the laboratory techniques and
who always gave their time to answer questions and come to my aid when I needed help or
advice. Eloise and Dino require additional thanks for the high fat and metformin chapters –
you saved my butt yet again and I am forever grateful. I would also like to thank Renee
Dwyer who always had a smile, always tried have something positive to say (even if things
were not great), and was always interested in our personal lives and keeping us (relatively)
sane.
A special thank you (yet again) goes to Eloise. Not only were you an amazing R.A. to have
in the lab (and you taught me so many things that I don’t even think you are aware of), but
you were most importantly an amazing friend and supporter. I don’t think I could have asked
for a better PCR buddy, moral support when running gels, or company for the long hours in
the lab. For all your help and kindness I am forever grateful.
To my fellow PhD students, thank you for your constant support and friendship over the
years. You have become like another family and I don’t know how I would have gotten
through this without you. I would especially like to thank Sarah, Emily, and Jess who have
been through this with me from the start and have been always been there with their support.
Special shout-out again to Sarah for the amazing dance parties in the lab, Sconedog for the
chats and lunch-dates, and Jess for being my PCR buddy. Massive thanks also go to my
‘Pleb’ Lewey who has always been there and given 200% of his time if I needed him.
vi Thanks also goes to Santon for the chats, friendship, and especially the memes; and special
mention goes to Adrian who became my out-of-hours (and sometimes beer and ice-cream)
buddy – thanks for making the early mornings, late nights, and weekends that little bit less
lonely.
I am also especially grateful to Nic who has been an amazing source of love and support
when I have needed it the most. Thank you for always making time for me, encouraging me,
and supporting me no matter what and even from far away, both throughout the writing of
this thesis (maybe now I will finally let you read it) and in my life outside of it.
Lastly I would like to give a massive thanks to my family, who without them I don’t think
this would have been possible. The largest thanks goes to you. Thank you for your
never-ending love and support throughout this whole time and always being there for me and
willing to go above and beyond whenever I needed you. I will always be extremely grateful
vii
STATEMENT
The work in the present thesis has exclusively been for the use of a Ph.D. in the area of
biomedical research. The data in this thesis has not been used for any other higher degree or
graduate diploma in any other university. All experimental and written work is my own,
except which has been referenced accordingly and all experimental work abides by the
Australian ethical conduct codes regarding animal experimentation.
AASCHA BROWN
AUTHORITY OF ACCESS
This thesis may be made available for loan and limited copying and communication in
viii
ABSTRACT
Obesity-related insulin resistance is accompanied by impaired microvascular recruitment
within skeletal muscle. Loss of recruitment within the microvasculature of the muscle has
been shown to be an early defect leading to impaired insulin sensitivity and in time skeletal
muscle insulin resistance, although the mechanism of impairment is unknown. Both obesity
and insulin resistance have been associated with chronic low-grade inflammation. A number
of inflammatory factors have been shown to directly influence vascular and myocyte
responses to insulin and may therefore be a contributing factor towards the development of
insulin resistance. The aim of this thesis was to investigate whether impaired vascular and
metabolic responses to insulin are attributed to the presence of inflammation.
Dietary models of obesity-induced insulin resistance were studied in Sprague Dawley rats.
Rats were placed on diets of different fat content (41% and 58% calories derived from fat) in
addition to a cafeteria-style diet. All diets were given for a 4 week duration, with both high
fat (58%) and cafeteria-style diets also extended to 12 weeks. Hyperinsulinemic euglycaemic
clamps and 1-methyl xanthine (1-MX) techniques were used to measure whole body insulin
sensitivity and microvascular recruitment, with inflammatory gene expression in the skeletal
muscle and epididymal adipose tissue measured by quantitative real-time PCR (q-PCR).
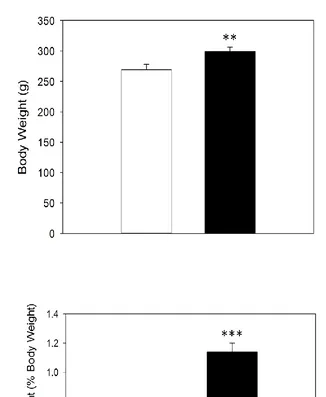
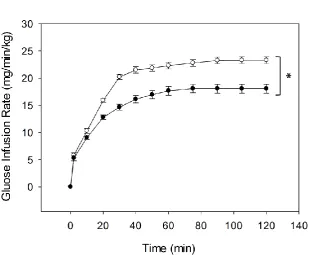
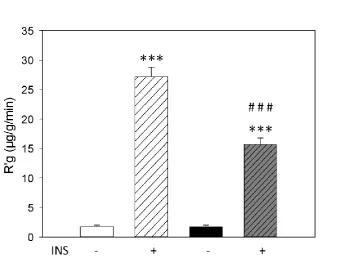
Four weeks of 41% high fat diet caused obesity, insulin resistance, and impaired capillary
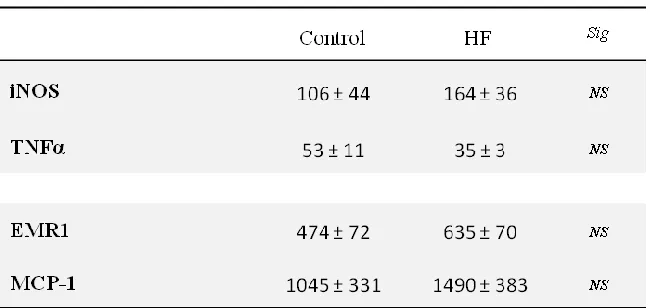
recruitment in rats; however inflammatory markers in epididymal fat were not altered.
Raising dietary fat content to 58% resulted in increased adiposity of the epididymal fat pad
but did not cause insulin resistance or inflammation of adipose tissue. Long term feeding
with this diet attenuated obesity and these animals did not differ from paired control diet rats
in insulin sensitivity or adipose tissue inflammation. A more palatable and varied cafeteria
diet resulted in even greater obesity and insulin resistance than the 41% high fat diet and this
was sustained after 12 weeks of feeding. However this diet did not cause inflammation after
either 4 or 12 weeks of dietary intervention. Finally, restoration of muscle insulin sensitivity
by metformin in 41% high fat fed rats was tested to see if adipose tissue inflammation could
be reduced. Metformin was found to significantly improve insulin sensitivity in insulin
resistant rats after 4 weeks of high fat feeding with the 41% diet, and significantly improve
skeletal muscle microvascular recruitment compared to that of control animals. Therefore in
ix significant actions directly on the vasculature and can restore microvascular blood flow
within insulin resistant skeletal muscle. However, these improvements were not
accompanied by attenuation of adipose inflammatory gene expression.
The lack of up-regulated inflammatory responses in insulin-sensitive tissues of obese and
insulin resistant rats suggests that inflammation may not be a driving factor for the
development of metabolic or vascular dysfunction present in insulin resistance in rats. The
lack of inflammatory response despite significant obesity suggests that rats may possess
mechanisms protecting against obesity-induced inflammation. Adipose tissue
microenvironment and expansion have been identified as potential mechanisms regulating the
induction of inflammation with evidence suggesting that adipose tissue can undergo both
healthy and unhealthy expansion in response to lipid accumulation. Data presented in this
thesis suggest that in rats adipose tissue expansion occurs in a manner that protects against
the development of inflammation, although further investigation is required to identify such
x
ABBREVIATIONS
1-MX 1-Methylxanthine
2-DG 2-deoxy-D-[1-14C] glucose
ANOVA Analysis Of Variance
CAF Cafeteria Diet
ET-1 Endothelin-1
eNOS Endothelial Nitric Oxide Synthase
EMR1 EGF-like Module-containing Mucin-like Hormine Receptor-like 1
FFA Free Fatty Acid
GIR Glucose Infusion Rate
GLUT-4 Glucose Transporter 4
HFD High Fat Diet
iNOS Inducible Nitric Oxide Synthase
INS Insulin
IRS Insulin Receptor Substrate
L-NAME N(G)-Nitro-L-Arginine Methyl Ester
MET Metformin
MCP-1 Monocyte Chemoattractant Protein-1
NO Nitric Oxide
PCR Polymerase Chain Reaction
qPCR Real Time Polymerase Chain Reaction
SEM Standard Error of the Mean
xi
PREFACE
Some of the data obtained in the present thesis has been presented at scientific meetings and
are listed below.
Posters at conferences
Australian Physiological Society Annual Meeting/Conference. Hobart, TAS. December
2015. Aascha Brown, Michelle A. Keske, Stephen Rattigan, Stephen M. Richards.
Inflammation is not a driving factor in the development of insulin resistance in diet induced
obesity in rats.
Oral presentations at conferences
Australian Diabetes Society/Australian Diabetes Educators Association Annual Scientific
Meeting. Adelaide, SA. August 2015. Aascha Brown, Michelle A. Keske, Stephen
Rattigan, Stephen M. Richards. Obesity, insulin resistance and the role of inflammation in
1
CHAPTER 1
2 1.1 Diabetes
Type 2 Diabetes is rapidly reaching epidemic proportions and becoming a serious health
problem worldwide due to the high prevalence of obesity [1, 2]. In 2013, diabetes was
predicted to affect approximately 382 million people worldwide, with this number expected
to increase to 592 million by 2035. It is believed the more than 85-90% of those affected are
suffering from Type 2 Diabetes [3, 4]. A study conducted by Shaw et al [5] estimating the
global prevalence of diabetes between 2010 and 2030 predicts a 20% increase in diabetes
diagnosis in developed countries within this timeframe, however most alarming is the
predicted 69% increase of diabetes diagnosis to occur within developing countries [5].
Despite this prediction the increasing burden of diabetes is expected to remain within
developed countries [6]. There has also been a growing trend in the prevalence of Type 2
Diabetes reported in children and adolescents [7, 8]. Twenty years ago approximately only
3% of diabetes diagnosis in children was classified as Type 2, while today that number has
increased to more than 75% of childhood diabetes diagnosed as Type 2 Diabetes [7, 9, 10].
All studies investigating the development of diabetes agree it is a growing problem and
considerable additional work will be placed on the healthcare system if these trends continue
as Type 2 Diabetes is currently one of the leading causes of mortality in the Western world
[11, 12].
Both obesity and Type 2 Diabetes are associated with the development of insulin resistance,
which is characterised by impaired insulin signalling and response within insulin-sensitive
tissues such as skeletal muscle [13-16]. This leads to poor uptake of glucose by the body
tissues, resulting in high blood glucose levels and hyperglycaemia [13, 17]. Abdominal
obesity in particular is associated with insulin resistance in skeletal muscle, adipose tissue
and the liver [18, 19], with insulin resistance within these tissues often present years before
the development and diagnosis of Type 2 Diabetes [20]. In addition to its metabolic actions,
insulin also has important action on vascular responses by controlling blood flow and the
delivery of both glucose and insulin to the skeletal muscle. In insulin resistant conditions
these vascular actions are impaired which further contributes towards the development of
muscle insulin resistance [15, 21-23]. This vascular dysfunction has been associated with
other health complications such as cardiovascular disease, hypertension and atherosclerosis
3 such as arterial disease and stroke, whilst dysfunction of smaller blood vessels
(microvascular) can result in nerve damage (neuropathy), kidney disease (nephropathy) and
complications and damage to the eyes (retinopathy) depending on the specific location [24].
Obesity, Type 2 Diabetes and insulin resistance are proposed as being states of chronic low
grade inflammation. This presence of background inflammation is thought to be an
influential factor contributing towards altered insulin signalling seen in obesity and insulin
resistance [19, 25-28]. Although a number of potential mechanisms have been proposed and
identified, it is unclear how rapidly inflammation develops in diet-induced obesity, and
whether it has the potential to impair microvascular responses at early stages of insulin
resistance and thus contribute towards impaired metabolic responses. A number of studies
propose inflammation to be a potential driving force which initiates the dysfunction present
in these states [18, 27-29]. Significant progress has been made to understand how and why
insulin resistance and the subsequent progression to diabetes develops [15, 18, 22, 30-32],
however the exact mechanisms by which insulin resistance occurs at a molecular and
signalling level, in both the skeletal muscle and vasculature, still remains to be confirmed.
1.2 Insulin
Insulin is a hormone produced by the pancreas in response to high levels of glucose in the
blood [33, 34], such as after a meal. In order to maintain glucose homeostasis, insulin
promotes skeletal muscle and adipose tissue to take up glucose from the blood, while
suppressing hepatic glucose output by the liver [33]. Skeletal muscle is of high importance
for returning blood glucose levels to fasting levels as it accounts for approximately 80% of
whole body insulin-mediated glucose uptake following a meal [35]. In liver and skeletal
muscle, glucose is stored as glycogen – a long-term energy store that can act as a reservoir of
glucose for muscle cells when availability is low [36, 37]. Liver glycogen is able to provide
glucose to the rest of the body for fuel when circulating blood glucose levels fall via
4 The actions of insulin depend on its binding to specific receptors which are expressed on the
surface of most cells in the body [39, 40]. This binding initiates a complex signalling cascade
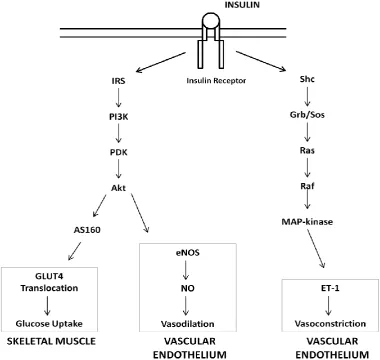
collectively known as the insulin signalling pathway [41] (Figure 1.1). Insulin is able to
signal through a number of pathways including Grb/Sos, MAPK, and TOR, however the most
relevant signalling pathway for metabolism is by PI3K/Akt. The insulin signalling pathway
is highly complex and consists of multiple feedback loops and interactions between signalling
branches and receptors [42, 43]. Many previous studies have investigated this response in
order to gain understanding of the signalling pathways by which insulin promotes glucose
uptake and allow greater insight into insulin’s actions within various tissues. [22, 34, 39-41,
[image:15.595.112.493.328.688.2]44-49].
5 1.2.1 Metabolic actions of Insulin
The insulin signalling pathway is initiated by the binding of insulin to the insulin receptor
(IR) which activates tyrosine domains and causes its auto-phosphorylation [45]. The IR
becomes activated and is able to bind and phosphorylate insulin receptor substrate proteins
(IRS) which act as docking sites for other signalling molecules downstream in the pathway
[45, 49]. Tyrosine phosphorylation of IRS creates recognition sites to allow binding of
phosphatidylinositol 3-kinase (PI3K) at SH2 domains [50], resulting in the activation of PI3K
and generation of phosphatidylinositol 3,4,5-triphosphate (PIP3). PIP3 activates a series of
serine kinases including 3-phosphoinositide-dependent protein kinase-1 (PDK-1) which
becomes activated and can then go on to phosphorylate and activate other serine-threonine
kinases downstream in the pathway such as Akt [2, 40, 51-55]. Activated Akt is then able to
phosphorylate AS160. Phosphorylation of AS160 is required for GLUT4 translocation to the
cell surface, allowing for glucose uptake in the skeletal muscle and adipose tissue [56-60]
(Figure 1.1). This translocation of GLUT4 is a major rate-limiting step for glucose uptake in
skeletal muscle and adipose tissue [56, 61, 62]. Inhibition or altered associations of any of
the key signalling molecules in the PI3K signalling pathway have the potential to prevent
GLUT4 translocation and therefore limit the amount of glucose that can be taken up by the
cells and tissues in response to insulin. Akt is also able to activate glycogen synthesis by
inhibiting GSK-3β so that glucose it taken up by adipose and skeletal muscle, and can be
stored for future energy use when circulating glucose levels fall [52, 63, 64].
As outlined, insulin not only stimulates the PI3K signalling pathway to initiate glucose
uptake and removal from the circulation, but it also has actions on the vasculature to promote
vasodilation [47, 51, 65]. In the vascular endothelium, insulin is able to signal through the
PI3K pathway to stimulate the production of the potent vasodilator nitric oxide (NO) [47, 51,
66]. This resulting vasodilation increases blood flow to skeletal muscle thereby allowing for
enhanced glucose uptake [23, 67]. As well as being a potent vasodilator, NO also functions
as an important signalling molecule in other pathways and can be produced by almost all
cells in the body [68-70]. There are three nitric oxide synthase (NOS) isoforms: neuronal
6 expressed constitutively, while as its name suggests, iNOS expression occurs only when it is
induced, usually by inflammation [68, 70-72].
Insulin-initiated production of NO occurs through activation of the PI3K signalling pathway
and shares similar initial signalling cascades as those required for glucose uptake by skeletal
muscle – the binding of insulin to the IR, phosphorylation of IRS followed by binding and
phosphorylation of PI3K. PI3K stimulates the production of PIP3 which phosphorylates and
activates PDK which in turn phosphorylates and activates Akt [13, 73]. However, the
difference in the signalling pathway between the metabolic and vascular actions of insulin
differs at this key signalling molecule as instead of Akt activating GLUT4 resulting in the
subsequent uptake of glucose by myocytes, Akt activates another branch of signalling by
directly phosphorylating eNOS on the serine 1177 residue [51, 74, 75] which stimulates
eNOS to release NO, resulting in vasodilation (Figure 1.1). This is an important action of
insulin as increased vasodilation results in increased blood flow to skeletal muscle, which not
only increases the delivery and uptake of glucose by skeletal muscle but also increases the
delivery of insulin itself to facilitate glucose uptake and insulin delivery to myocytes [44, 51].
Insulin is able to signal through a pathway other than PI3K to elicit other vascular responses
such as vasoconstriction [2]. Insulin is able to signal through the MAP-kinase (MAPK)
pathway (Figure 1.1) to activate the secretion of endothelin-1 (ET-1), a powerful
vasoconstrictor, in the vasculature [66]. This signalling acts concurrently with insulin’s
ability to promote vasodilation through eNOS in order to maintain vascular function and
provide regulation of blood flow by controlling the dilation and constriction of the
vasculature. Following the activation and auto-phosphorylation of the insulin receptor (IR),
insulin is able to phosphorylate and bind to insulin receptor substrates (IRS). Tyrosine
phosphorylated IRS binds to SH2 domains and activates Sos, which in turn activates the GTP
binding protein Ras and begins a series of kinase phosphorylation cascades involving Raf and
MAPK [41, 55, 76, 77]. It is this activation which stimulates ET-1 to be produced.
However, signalling through the MAP-kinase pathway to produce ET-1 has not been as
extensively studied as insulin signalling through the PI3K pathway to produce NO, so little is
known about the exact details of how ET-1 secretion is regulated [72]. Despite this, these
7 vascular response to insulin [66, 78]. An imbalance of vasodilation or vasoconstriction in the
vasculature may lead to impaired vascular delivery and as a result, the development of insulin
resistance [2, 31, 78-81].
1.2.2 Vascular actions of Insulin
Insulin is reported to have two types of control within the vasculature of skeletal muscle: to
increase artery blood flow and to increase microvascular capillary recruitment [22, 82, 83].
In the past, increased total blood flow has been suggested to be important in insulin-mediated
glucose uptake in skeletal muscle since it was thought to enhance the delivery of insulin and
glucose to the muscle cells [84]. However it has now come to light that the distribution of
blood flow within skeletal muscle may have a more significant effect on glucose uptake than
bulk flow itself [16, 21-23, 32, 44, 56, 85, 86]. These studies suggest that microvascular
blood flow is critical for glucose uptake within the skeletal muscle as opposed to increased
total blood flow. Insulin-mediated vasodilation occurs in distinct stages. Terminal arterioles
are dilated first, resulting in an increased number of capillaries receiving blood flow. This
process is referred to as microvascular recruitment and leads to a redistribution of blood flow
in muscle without altering total blood flow to the muscle. Following this, relaxation of larger
vessels results in an increase in the overall net blood flow to muscle [22, 23, 87]. This
microvascular action of insulin was first characterised in the skeletal muscle of rodents [23]
and again more recently confirmed in the human forearm [85, 88].
A concept championed by Clark and Rattigan et al [23] is that capillary recruitment occurs
via redistribution of microvascular blood flow between two flow routes. Early studies using
the rat perfused hindlimb support the idea of two flow routes being present in skeletal muscle,
nutritive and non-nutritive flow [67, 83, 89]. One flow route has close contact with the
myocytes and is able to exchange nutrients easily so is regarded as the nutritive flow path.
The other flow route has very little to no contact with myocytes and instead has more
interaction with connective tissue and adipocytes. Because of this, it is viewed as
non-nutritive flow. It has been shown that non-non-nutritive vessels have the ability to carry a flow
reserve which allows blood to be redistributed into the nutritive flow paths during activities
8 redistribution of flow into a nutritive flow path where there is more contact with myocytes
allows for a greater uptake of glucose from the blood into muscle cells. Because of this,
insulin has been shown to have the capacity to change and redistribute blood flow from the
non-nutritive to a nutritive flow route so that there is greater contact and opportunity for
glucose to be taken up by the skeletal muscle [22, 67, 89].
In healthy conditions, insulin is believed to increase total blood flow and microvascular
recruitment via a PI3K-dependent pathway in order to enhance glucose uptake by muscle
cells [44]. However, it is difficult to confirm the exact processes that lead to microvascular
recruitment occurring because a functioning intact model with signalling between skeletal
muscle and microvasculature is needed. Therefore insulin-mediated microvascular
recruitment has largely been studied in vivo [22, 23, 32, 90, 91]. Such studies have shown
that insulin has the ability to increase total blood flow and microvascular recruitment in
skeletal muscle, but it is this microvascular recruitment that has been revealed to be
responsible for increasing muscle glucose uptake [23, 32]. Inhibition of PI3K with
wortmannin has been found to block insulin-mediated microvascular recruitment [90].
Insulin-mediated glucose uptake is also found to be inhibited when microvascular recruitment
is blocked by α-methyl serotonin or by the nitric oxide synthase inhibitor
N(G)-Nitro-L-arginine methyl ester (L-NAME) [92-94]. Vasodilators have been shown to increase blood
flow in both normal and insulin resistant skeletal muscle, however this increase in flow was
not shown to enhance glucose uptake [16, 23, 92]. A study by Mahajan et al. [95] comparing
nitric oxide vasodilators showed that the vasodilators bradykinin and methachonine both
increased blood flow, however only methacholine enhanced microvascular recruitment and
skeletal muscle glucose uptake. These results indicate that methacholine acts upon different
specific sites within the muscle vasculature in order to enhance recruitment as opposed to
other vasodilators which do not. Currently methacholine is the only vasodilator that increases
both total blood flow and insulin-mediated glucose uptake in the skeletal muscle [16, 78].
From these data, recruitment of the vasculature appears to be independent of changes in total
blood flow which are also caused by insulin [44, 82, 87]. [82, 87]. It has even been observed
that insulin-mediated microvascular recruitment occurs before changes in total blood flow in
muscle [32]. This raises the possibility that insulin may have the potential to use different
mechanisms to recruit macrovessels which control total blood flow and microvessels which
9 insulin-mediated vascular recruitment are needed to bring more clarity to this area of
research.
1.3 Insulin Resistance
Insulin resistance is characterised by decreased sensitivity of tissues to insulin. Insulin is
therefore unable to suppress hepatic glucose output by the liver or initiate glucose uptake in
skeletal muscle and adipose tissue [13, 37, 48, 52, 96]. This leads to high circulating levels
of glucose in the blood, known as hyperglycaemia, which has been shown to be involved in
the signalling dysfunction and chronic inflammation present in insulin resistant states [2, 13,
97]. This dysfunction in insulin response may be present for a number of years before the
development of abnormal plasma glucose levels which lead to the diagnosis of insulin
resistance and Type 2 Diabetes, as well as other conditions such as hypertension and
cardiovascular disease [91, 98].
1.3.1 Metabolic Insulin Resistance
During the development of insulin resistance it has been proposed that the liver and skeletal
muscle both become resistant to the actions of insulin at an early stage. As insulin resistance
progresses, insulin is unable to suppress glucose output by the liver or stimulate glucose
uptake by the skeletal muscle. This results in the glucose concentrations within the blood to
rise, which in turn stimulates the pancreas to increase insulin secretion in order to try and
maintain euglycaemia. This is often referred to as compensatory hyperinsulinemia. Initially
this increased insulin secretion by the pancreas is able to maintain normal blood glucose
concentrations, however over time either the production of insulin by the pancreas or the
responsiveness to insulin action itself is reduced, resulting in hyperglycaemia that can no
longer be controlled by normal means.
Insulin resistance is characterised by the impaired insulin response or insulin signalling. It
has been identified that skeletal muscle from obese and insulin resistant subjects show
10 pathway as opposed to the MAPK pathway which maintains normal insulin signalling
responses. Selective defects within the PI3K signalling pathway specifically inhibit the
stimulation of glucose uptake by skeletal muscle and adipose tissue, in addition to
insulin-mediated vascular responses [30, 99, 100]. Impairment of insulin signalling within this
pathway may be due to a defect of the insulin receptor itself or in receptor expression, ligand
binding, phosphorylation and tyrosine kinase activity of other downstream signalling
molecules such as IRS, PI3K, Akt or GLUT4 [33, 101]. Reduced signalling through the
PI3K pathway results in reduced activation of GLUT4, which is a major rate-limiting step for
glucose uptake in skeletal muscle and adipose tissue as reduced GLUT4 translocation limits
the amount of glucose that can be taken up by the cell and tissue [56]. In regards to
implications on vascular responses, impaired insulin signalling through the PI3K pathways
also limits the production of nitric oxide in order to stimulate vasodilation within the
vasculature. As insulin signalling through the MAPK pathway remains unaffected this means
that the production of ET-1, and thus vasoconstriction, is unaltered which can results in the
dysfunction of vascular responses within the endothelium often characterised in obese and
insulin resistant subjects.
Insulin resistance has also been characterised by the increased presence of increased fatty
acids and pro-inflammatory factors such as cytokines and macrophages. Obesity and insulin
resistance are associated with increased lipolysis within the adipose tissue, resulting in an
increased production of fatty acids. It has been proposed that increased circulating levels of
free fatty acids (FFA) may contribute towards the development of insulin resistance [91,
102-104]. In healthy states, insulin stimulated the synthesis and storage of fatty acids in adipose
tissue, but in insulin resistant conditions, the adipose tissue becomes insulin resistant itself, so
the uptake of FFA becomes impaired, resulting in the rise of circulating FFA levels in the
plasma [105]. Consequently FFA and triglycerides have been shown to accumulate in
non-adipose tissues, such as skeletal muscle, due to their high levels in the blood. This uptake of
FFA is thought to occur due to altered function of lipid transporter proteins, suggesting an
impairment in fat disposal as much as an increased uptake of FFA and triglycerides by other
tissues [106]. This accumulation of FFA within insulin-sensitive tissues is closely associated
11 FFA can result in impaired insulin signalling by preventing full activation of signalling
molecules in the PI3K pathway, such as IRS, PI3K, PDK or Akt [103, 107].
Exposure to FFA and triglycerides increases levels of diacylglycerols (DAGs) and ceramides,
which can activate kinases such as PKC, IKKβ, and JNK, as well as transcription factors such
as NF-Kβ. Each of these in turn have been found to cause insulin resistance by inhibiting
insulin signalling at various sites [18, 29, 108, 109]. Increased expression of JNK and IKKβ
have been found in the liver [18, 110], as well as skeletal muscle and adipose tissue during
obesity [18, 111]. Evidence to support their activation in the development of insulin
resistance can be given through the use of transgenic animal models. Transgenic knockout of
JNK results in the improvement of insulin sensitivity of high fat fed mice and the
development of obesity [111], whilst transgenic mice with constitutively activated IKKβ
transgene within the liver have impaired hepatic insulin sensitivity, impaired skeletal muscle
insulin sensitivity, hyperglycaemia, and increased liver inflammation [112].
Exogenous infusions of FFA and DAG have been shown to block the activation of IRS in
skeletal muscle of rodent models [103, 107, 113]. The modifications to insulin signalling
include reduced tyrosine phosphorylation of IRS and increased IRS serine phosphorylation.
This decreases the ability of IRS to associate with PI3K, thereby reducing its activity and
resulting in a decreased ability of insulin to stimulate glucose uptake in skeletal muscle.
Muscle samples taken from Type 2 Diabetic and insulin-resistant obese subjects have been
shown to have this decrease in IRS tyrosine phosphorylation and reduced IRS/PI3K
association in response to insulin [114, 115]. As well as their association with the
development of muscle insulin resistance, increased levels of FFA, DAG, ceramide and
kinases are also associated with endothelial dysfunction and inflammation [18, 19, 29, 91,
116-119]. Insulin resistance has also been associated with the accumulation of fat within
other tissues such as the liver and skeletal muscle. This increased fat in non-adipose tissue
can result in lipotoxicity which can further contribute towards the dysfunction of both
12 Insulin resistance has also been strongly associated with the increased production and
initiation of inflammatory factors within the adipose tissue [26, 27, 120-124]. Their
increased expression has been proposed to contribute towards impairing both
insulin-mediated metabolic and vascular responses. A number of inflammatory factors including
iNOS, TNFα, IL-6, and macrophage chemotactic factor MCP-1 have been shown to impair
the normal actions of insulin within both the muscle and vasculature [26, 29, 125-130].
Exogenously infused TNFα has also been shown to impair vascular responses such as
capillary recruitment in non-obese rats [126]. This suggests that the vasculature has the
potential to be highly sensitive to inflammatory responses [22, 23, 131-133]. Although
obesity-associated inflammation has been investigated within the literature, much is still
unknown about the mechanisms surrounding its induction in insulin resistant states. So far
the contribution of inflammatory factors towards the development of vascular insulin
resistance has only been partially investigated, and it is not clear whether microvascular
blood flow responses within skeletal muscle are affected by this increased inflammation
expression. A time course examining the relationship between inflammation and impaired
insulin sensitivity, especially within the vasculature, as a result of diet-induced obesity has
not been researched by others studying blood flow and microvascular recruitment as of yet.
Due to shared insulin-mediated signalling pathways, it is logical that inflammation can have a
significant effect on vascular responses within muscle.
1.3.2 Vascular Insulin Resistance
Obese or Type 2 Diabetic subjects are regularly found to have some form of irregularity in
endothelial or vascular function [16, 91, 134]. Diabetic individuals have shown to have
reduced production and response to NO even before diagnosis, and it is extremely likely that
some impairment to endothelial function has already been established early in the disease
progression [91]. Endothelial dysfunction is defined as the partial or complete loss of
balance between vasoconstriction and vasodilation of blood vessels [91, 135, 136]. It is
considered to be an important event in the development of vascular complications present in
diabetes and the development of insulin resistance. By the time Type 2 Diabetes is
13 Insulin resistance not only results in impaired metabolic actions to stimulate glucose uptake,
but also a reduced ability of insulin to signal through the PI3K pathway to initiate NO
production and vasodilation [13-16, 44, 56, 116, 137]. Although insulin has impaired
signalling through the PI3K pathway, the other branch of insulin signalling in the vasculature
via MAPK remains unaffected or even enhanced in insulin resistance [2]. Therefore, insulin
is able to signal through the MAPK pathway, resulting in increased ET-1 secretion and
heightened vasoconstriction of the vasculature. The imbalance between signalling through
the PI3K and MAPK pathways contributes to both the impaired vascular and metabolic
actions of insulin [81]. Insulin’s ability to increase blood flow and glucose uptake in skeletal
muscle has been found to be inhibited in insulin resistant, obese and diabetic subjects due to
the imbalance and altered vascular responses that occur as a result of the inhibition of insulin
signalling through the PI3K pathway [117].
It has been proposed that the insulin resistance in skeletal muscle is at least partly due to
impairment of insulin-mediated vascular responses [56, 136, 138]. This is because before
insulin can stimulate the PI3K signalling pathway to initiate glucose uptake in muscle cells,
insulin first needs to be delivered to the muscle via the vasculature [49, 56]. An increase in
blood flow and vascular recruitment in skeletal muscle is dependent on the production of NO
in the vasculature for vasodilation [32, 139, 140]. In insulin resistant conditions, there is a
defect in insulin’s ability to signal through the PI3K pathway, which prevents the production
of NO in the vascular endothelium. This results in decreased vasodilation and blood flow
which in turn impairs the delivery of insulin and glucose to the skeletal muscle. Therefore
insulin resistance can be characterised by impairment of PI3K signalling in both metabolic
and vascular insulin target tissues [139, 141]. Expression of pro-inflammatory cytokines
such as TNF-α and accumulation of FFA have been found to alter insulin vasodilator
signalling by reducing the binding and activation of PI3K in response to insulin, resulting in
reduced activation of downstream effectors such as Akt and eNOS in endothelial cells which
14 1.3.3 Inflammation in Insulin Resistance
Obesity associated with Type 2 Diabetes has been shown to coexist with a state of chronic
low grade inflammation, and insulin resistance related to obesity has been found to correlate
with this chronic tissue inflammation [19, 26, 119, 124]. Studies that have specifically
altered the degree of inflammation have noted reciprocal effects on insulin sensitivity. Many
studies investigating genetic knockout models for inflammatory markers such as iNOS and
MCP-1 have shown a significant improvement in whole body insulin sensitivity in response
to high fat feeding compared to wild-type controls [71, 122, 127, 129, 142]. In comparison,
studies have also shown that acute infusion of markers such as TNFα and IL-6 can directly
impair insulin-mediated glucose uptake by the skeletal muscle as well as insulin-mediated
vascular responses in non-obese animals [126, 130, 143, 144]. It is therefore assumed that
this inflammatory state contributes to insulin resistance, however there is some debate as to
whether inflammation aids in the development of insulin resistance, or if insulin resistance
itself initiates inflammation in diet-induced obesity [26]. Numerous studies have attempted
to determine why inflammation occurs in insulin resistant states related to obesity, and what
implication this has on its development and progression. Rodent models fed a high-fat diet to
induce obesity have been used to assess the natural development of inflammation and
impaired insulin response in vascular tissue, liver, adipose tissue and skeletal muscle [26,
117].
Obesity has been associated with high infiltration and accumulation of macrophages within
the adipose tissue. Macrophages have the ability to induce and secrete a range of
pro-inflammatory cytokines which cause tissue inflammation and signal the production of other
pro-inflammatory molecules [19, 26, 27, 119, 124, 145]. Therefore the accumulation of
macrophages into adipose tissue is a potential sign that an inflammatory response has already
been initiated. Monocyte chemoattractant protein 1 (MCP-1) is an adipokine that recruits the
infiltration of macrophages and other pro-inflammatory cells into tissues to elicit an
inflammatory response. It has been found to have significant expression within adipose
tissue in obese states [122]. Studies have shown that skeletal muscle cultured with MCP-1
results in reduced glucose uptake by the muscle cells [146] and that MCP-1 knockout mice
fed a high fat diet show reduced accumulation of macrophage markers within the adipose
15 fed controls [122]. These results suggest that MCP-1 is influential in the induction of
inflammation in obesity due to its ability to recruit macrophages to induce a
pro-inflammatory response, however MCP-1 may also play a direct role towards impairing
insulin-mediated responses. Some of the inflammatory cytokines induced by macrophages
and reported to have strong associations with obesity and insulin resistance include TNF-α,
IL-1β and IL-6 [18, 124, 126, 130].
Cytokines IL-6 and IL-1β are strong pro-inflammatory signals which can be used as markers
and predictors of Type 2 Diabetes in humans [147]. Both have been widely studied and are
closely linked to inflammation and the development of endothelial dysfunction [27, 124, 145,
148]. Visceral fat accumulation, which is highly correlated with obese states and insulin
resistance, has been shown to be an important site for the secretion of IL-6, with its
production being at least three times higher in abdominal adipose tissue that in subcutaneous
tissue [118]. Exogenous infusion of IL-6 in vivo has shown to reduce insulin-mediated
glucose uptake in the skeletal muscle by reducing association of IRS with PI3K by promoting
serine phosphorylation instead of tyrosine phosphorylation on the IRS. IL-6 has also been
reported to inhibit gene transcription of IRS, GLUT4 activation, as well as increase the level
of fatty acyl-CoA in the skeletal muscle [130, 144].
TNF-α is a pro-inflammatory cytokine which is produced by macrophages, but is also found
to be highly expressed in adipose and skeletal muscle of obese and insulin resistant subjects
[18, 102, 149], and is believed to contribute towards these conditions and the development of
Type 2 Diabetes [124]. Treatment with TNF-α in the skeletal muscle and liver results in
decreased tyrosine phosphorylation of IRS and increased serine phosphorylation instead.
Phosphorylation of serine residues on IRS interferes with insulin-stimulated tyrosine
phosphorylation by the IR [150, 151]. This type of modification to IRS prevents further
associations with downstream effectors in the insulin signalling pathway, such as PI3K, in
response to insulin [152]. TNF-α and FFA have been shown to reduce insulin’s ability to
recruitment the microvasculature in the skeletal muscle [13]. Increased levels of TNF-α has
been found to downregulate vasodilator pathways by causing reduced binding and activation
of PI3K in response to insulin [152], resulting in reduced activation of downstream effectors
16 infusion of TNF-α [143, 152] and FFA [103, 107] into rodent models leads to insulin
resistance, decreased glucose uptake and reduced microvasculature recruitment. It has been
found that mice lacking TNF-α or TNF-α receptors have better insulin sensitivity if fed a
high fat diet or are genetically altered obese models [149]. Acute infusion of TNFα has been
shown to directly impair insulin-mediated haemodynamic responses in non-obese rats by
preventing capillary recruitment, thereby resulting in decreased whole body insulin
sensitivity due to the direct impairment of glucose uptake by skeletal muscle [126, 143]. This
demonstration of exogenous TNFα being able to significantly impact vascular responses
without obesity-associated insulin resistance highlights the sensitivity of the vasculature to
inflammatory responses.
Inducible nitric oxide synthase (iNOS) is one of the 3 nitric oxide synthase (NOS) isoforms,
and the only one which is Ca2+-independent [153]. It is also the only NOS isoform expressed when it is specifically activated, in contrast to the other isoforms which are constitutively
expressed [56, 72]. It was first identified in macrophages and was found to contribute to the
cytotoxic actions they have in immune cells, but iNOS is now known to be expressed at low
levels in other tissues of healthy individuals [154]. However high expression of iNOS
appears to be detrimental with induced iNOS expression found in a number of conditions
associated with inflammation such as diabetes, atherosclerosis, obesity and insulin resistance
[149, 155, 156]. Increased iNOS expression is promoted by pro-inflammatory cytokines such
as TNF-α and IL-6, which are also reported to be present in insulin resistant states [72, 157,
158].
High levels of iNOS expression have been observed in skeletal muscle of mice placed on
high fat diets, with similar increases in iNOS expression seen in skeletal muscle of patients
with Type 2 Diabetes [156, 159]. This over-expression of iNOS in genetic and high-fat diet
models of obesity has been shown to play a crucial part in the development of insulin
resistance. Disruption of iNOS in knockout mouse models has shown to be prevented from
developing obesity-induced insulin resistance body wide [142, 149]. Although they develop
obesity if placed on a high fat diet, iNOS knockout mice otherwise show protection from
insulin resistance induced by high fat feeding with improved glucose tolerance and insulin
17 to be intact in these animals, with no alterations in phosphorylation, association or activation
of any of the key signalling molecules [149]. This suggests that in normal high-fat models,
iNOS impairs insulin signalling to PI3K, preventing activation of Akt which is important for
glucose transport signalling, resulting in decreased glucose uptake. A similar increase in
iNOS expression has also been seen in the skeletal muscle of patients with Type 2 Diabetes
which may contribute to the disease state [156, 159]. iNOS is able to produce 1000-fold
more NO than any other NO isoform and once it is expressed, its activity is continuous for
many hours [153]. Therefore, if iNOS expression is induced in inflammatory and insulin
resistant states, it is possible that the excessive NO production interferes with the highly
coordinated actions of the vasculature and contributes towards the endothelial dysfunction
seen in such conditions [158, 160-162]. The rise of pro-inflammatory cytokines associated
with inflammation and insulin resistance may also alter the expression of iNOS in the
vasculature [72], which would affect the regulation of vascular function. Increased iNOS
expression is believed to interfere with the highly coordinated actions of the vasculature [158,
160-162], however its involvement in vasoconstrictor responses is less studied than the
involvement it has in insulin-mediated glucose uptake in insulin resistance [142, 154].
Inflammation has not only been found to contribute to the formation of insulin resistance but
also to endothelial dysfunction of the vasculature [13, 14, 16]. While there have been reports
from high fat-fed mouse models that inflammation is a late development, changes in
inflammatory markers have been shown to also occur early in the time course, albeit much
smaller changes [26]. It is unclear from rat models and human obesity how rapidly
inflammation develops, and thus whether it has the potential to impair microvascular
responses at early stages of insulin resistance. In a study by Kim et. al [117], it was found
that the vascular tissue is affected much sooner in the development of diet-induced obesity
than other tissues involved in glucose metabolism. A number of inflammatory markers have
been shown to have direct effects on vascular responses suggesting they can impair blood
flow as soon as they appear. As discussed, both TNFα and iNOS have both been shown to
alter vascular signalling [72, 126-128, 143, 160, 161]. Acute infusion of TNFα has been
shown to directly impair insulin-mediated blood flow responses by preventing the
recruitment of the microvasculature [126, 143], whilst excessive nitric oxide production from
iNOS has been shown to interfere with the highly coordinated actions of the vasculature [72,
18 thesis) also provide evidence for impaired muscle vascular responses after 4 weeks of high fat
feeding that could be restored by iNOS-specific inhibition, suggesting that even at this early
time point iNOS over-expression potentially impairs vascular reactivity in skeletal muscle.
However despite this a direct link between the induction of microvascular impairment and the
induction of diet-induced inflammation has not yet been clearly identified.
As obesity and inflammation have been closely linked within the literature, it is of no surprise
that a key site of inflammatory induction is within the adipose tissue itself. This is because in
addition to its role in lipid storage, the adipose tissue is highly active endocrine organ that
secretes a number of hormones and adipokines [163-165]. However despite the current
research within the literature, the mechanisms surrounding obesity-induced inflammation still
remain elusive. It has been proposed that the adipose tissue can undergo unhealthy or
unhealthy expansion in response to provide adequate nutrient storage, however the
mechanisms surrounding whether healthy or unhealthy expansion occurs is still not fully
understood [166]. In healthy conditions the adipose tissue undergoes hypertrophy and
hyperplasia to accommodate additional lipid storage. In this state, adipose tissue expansion is
associated with increased angiogenesis to supply adequate oxygen and nutrients to the
expanding tissue. It is hypothesised that at times when excessive lipid storage is needed,
such as during high fat feeding or obesity, adipose tissue expansion occurs at a much higher
rate. This rapid expansion of the adipose tissue results in excessive adipocyte hypertrophy.
It has been found that the additional remodelling that occurs during healthy expansion, such
as the development of new adipocyte cells and vascular growth, either does not occur during
this rapid expansion process or it occurs at a much lower rate [165, 166]. Due to their large
size and inadequate oxygen availability, poorly oxygenated adipocytes can become hypoxic
within the tissue. This triggers the increased expression of Hypoxic Inducible Factor 1α
(HIF-1α) to the hypoxic sites [167-169]. HIF-1α has been identified as an early initiator of
inflammatory responses and can signal for the induction of macrophages and the proliferation
of inflammation factors in the tissue. Very poorly oxygenated adipocytes may become
necrotic which also induces increased inflammatory responses and macrophages locally
within the tissue [166, 170, 171]. Therefore unhealthy expansion and the development of
hypoxia within the adipose tissue is a possible factor underlying the induction of
obesity-induced inflammation in insulin resistant conditions. However further studies are required to
19 1.4 Summary of research aims
A key unanswered question regarding obesity and insulin resistance is the development of
inflammation in this state and whether obesity-induced inflammation contributes towards the
development of both muscle and vascular insulin resistance. A number of inflammatory
molecules, such as TNFα and iNOS, have been shown to alter and impair insulin-mediated
responses within both the muscle and vasculature, however currently the mechanisms
regulating the induction of inflammatory responses within obesity are still not understood.
The vast majority of inflammatory studies in regards to diet induced obesity have primarily
been performed in mouse models, and similar studies in rats are considerably outnumbered.
Therefore investigation of diet-induced obesity on inflammation and insulin resistance in rats
will allow, not only for the investigation of inflammation on physiological responses such as
blood flow, but also contribute to the current literature by providing further information as to
its presence in rats for comparison. Therefore, this project hypothesises that inflammation is a
key contributor to the development of both microvascular and skeletal muscle insulin
resistance in diet-induced obesity in rats. Therefore, the aim of this thesis was to investigate
the influence of obesogenic diets on the induction of adipose tissue inflammation, and the
20
CHAPTER 2
21 2.1 Animals
Male Sprague Dawley rats, approximately 4 weeks of age, were obtained from the University
of Tasmania Central Animal Facility. All animals were housed in temperature and light
controlled conditions (21ºC ± 1ºC) with a 12 hour light/dark cycle. Animals were provided
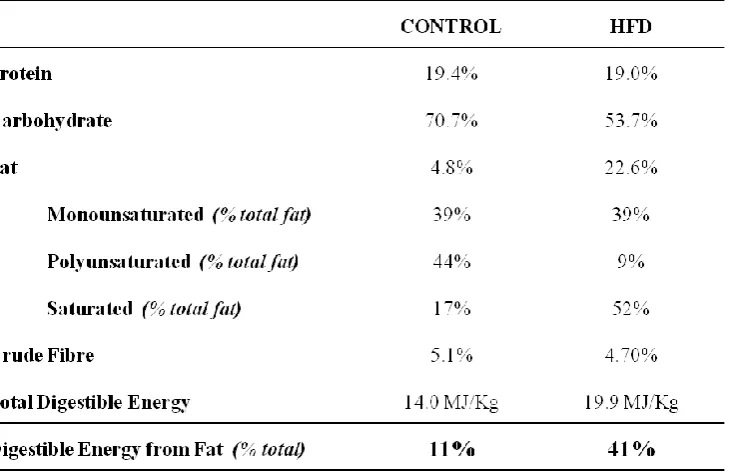
with free access to water and commercial semi purified diets. Details of the various dietary
interventions are provided in each chapter accordingly.
All experiments and procedures were approved by the University of Tasmania Animal Ethics
committee and undertaken in accordance to the Australian Code of Practice for the Care and
Use of Animals for Scientific Purposes (7th Edition, 2004).
2.2 Anaesthetised Rat Experiments
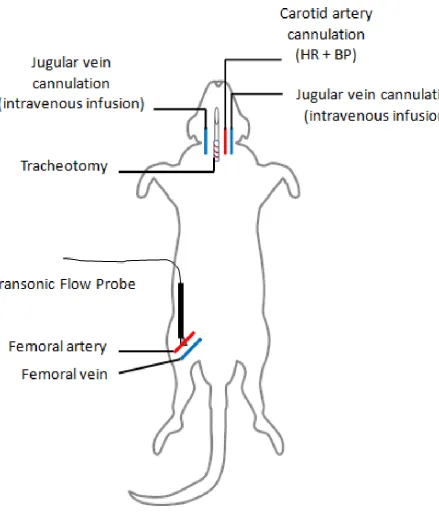
2.2.1 Surgical Procedure
Rats were anaesthetised with an intraperitoneal injection of sodium pentobarbital (50mg/kg
body weight). A tracheostomy tube was surgically inserted to allow for spontaneous
breathing during the experiment. Cannulas were inserted into both jugular veins to allow for
intravenous infusion. Another cannula was inserted into the carotid artery and connected to a
pressure transducer (Transpac IV, Abbott Critical Systems) to allow for the measurement of
blood pressure. Arterial blood sampling was also performed through the carotid cannula line.
The femoral blood vessels of one hindlimb were exposed and the femoral artery was carefully
separated from the femoral vein and nerve. The epigastric vessel was ligated and a flow
probe (0.5 mm VB series, Transonic Systems) was positioned around the femoral artery to
allow for the measurement of total femoral blood flow. Both the vessels and flow probe were
covered in lubricating jelly (Mohawk Medical Supply, Utica). The probe was connected to a
flow meter (model T106 ultrasonic volume flow meter, Transonic Systems) which was
connected to an IBM-compatible computer. Figure 2.1 outlines the surgical procedure
performed.
Blood pressure, heart rate, and femoral artery blood flow were measured continuously using
WINDAQ data acquisition software (DATAQ Instruments). Anaesthesia was maintained by
22 jugular vein. Body temperature of the rat was maintained at 37ºC using a heated pad and
heating lamp. Completion of the surgical procedure was followed by a 60 minute
equilibration period to allow for blood pressure to stabilise before a 2 hour insulin clamp was
performed.
2.2.2 Muscle Glucose Uptake
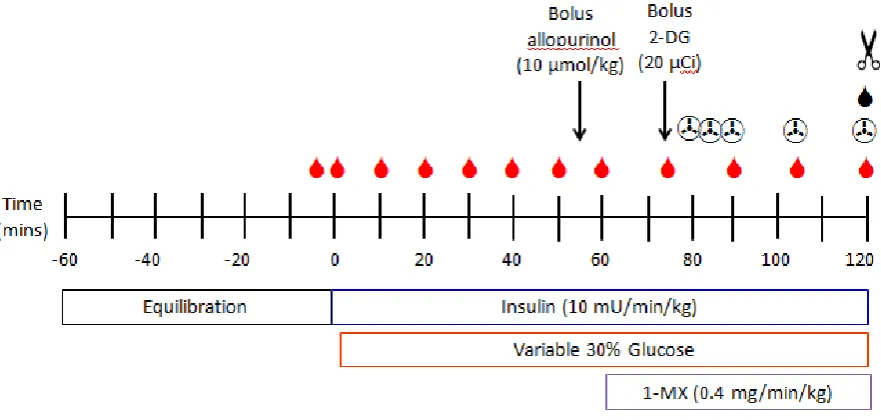
Skeletal muscle glucose uptake was measured by the uptake of 2-deoxy-D-[1-14C] glucose (2-DG, 0.1 mCi/mL, Perkin Elmer) as previously described [172]. In brief, 45 minutes prior to
the end of the hyperinsulinemic euglycaemic clamp procedure a 200µL bolus of 2-DG was
given (20µCi). Arterial plasma samples (25µL) were collected 5, 10, 15, 30, and 45 minutes
after the 2-DG bolus to assess plasma clearance of 2-DG. At the end of the clamp procedure
calf muscle was excised, immediately freeze clamped in liquid nitrogen, and kept at -80ºC
until required. The frozen muscle was ground into a fine powder under liquid nitrogen and
approximately 100mg of powdered muscle was homogenised with 1.5mL of distilled water
using a Heidolph silent crusher. The homogenate was centrifuged at 13,000 rpm at 4ºC for
10 minutes and 1mL of supernatant was assessed for free and phosphorylated 2-DG using an
anion exchange column (AG-1X8, Bio-Rad Laboratories). Biodegradable counting
scintillant (Amersham) was combined with each radioactive sample and radioactivity was
measured using a scintillation counter (Perkin Elmer). From this measurement and the
disappearance of 2-DG in plasma, the rate of glucose uptake by the skeletal muscle (R’g),
23 Figure 2.1 – Diagram of surgical procedure for anaesthetised rat experiments.
24 2.2.3 Skeletal muscle microvascular perfusion
Microvascular perfusion within skeletal muscle was measured by the metabolism of
exogenously infused 1-methyl xanthine (1-MX) as described elsewhere [23, 86]. In brief, a
bolus of allopurinol (10µmol/kg, Sigma Aldrich) was given 5 minutes before 1-MX infusion
in order to partially inhibit xanthine oxidase activity and ensure a constant saturating arterial
level of 1-MX. Infusion of 1-MX (0.4mg/min/kg body weight) occurred for the final 60
minutes of the clamp procedure. At the end of the experiment 100µL of arterial plasma was
added to 20µL of perchloric acid (2M) to precipitate the proteins. Hind-leg venous plasma
was obtained from the femoral vein and 100µL was mixed with 20µL perchloric acid (2M).
Samples were centrifuged for 10 minutes and the supernatant was assessed for 1-MX and
oxypurinol concentration using reverse-phase high-performance liquid chromatography as
previously described [23, 173]. 1-MX metabolism (nmol/min) was calculated from the
difference of arteriovenous plasma 1-MX levels multiplied by femoral blood flow.
2.3 Gene Expression Experiments
2.3.1 Tissue Sample Preparations
Gastrocnemius muscle and epididymal fat pad samples were taken from anaesthetised
Sprague Dawley rats at the end of hyperinsulinemic euglycaemic clamps. Tissue samples
were freeze clamped in liquid nitrogen and stored at -80ºC until required. Frozen tissue
samples were ground into a fine powder in liquid nitrogen and stored at -80ºC until required.
2.3.2 RNA Extraction
Total RNA was extracted from ground tissue samples using the Tri Reagent method (Sigma
Aldrich). Approximately 100mg of ground skeletal muscle and 150-200mg of ground
adipose tissue was used for each extraction. The RNA pellet was resuspended in 10-20µL of
PCR-grade water (RNAse and DNAse free) (Bioline or Qiagen) and RNA concentration was
quantified by measuring spectrophotometer absorbance at 260nm. RNA quality was also
assessed and an A260/280 ratio value of ‘2’ was obtained for all RNA used in the following
25 2.3.3 Polymerase Chain Reaction (PCR)
2.3.3.1 Quantitative PCR
RNA extracted from ground tissue samples was reverse transcribed to obtain complementary
DNA (cDNA) strand. Total RNA was diluted to a concentration of 1µg per reaction before
being reverse transcribed and amplified per set of primers (GeneWorks Australia) using
SuperScript III (Invitrogen). Reverse transcription was performed on a T100 Thermal Cycler
(BioRad) and conditions consisted of 50ºC for 60 minutes, 70ºC for 15 minutes, and then
sample temperature reduced to 4ºC. Samples were held at 4ºC until required.
Real time PCR (qPCR) was performed using SYBR Green (Qiagen) on cDNA obtained
through reverse transcription. Incubation conditions for qPCR were are follows: 95 ºC for
15 minutes for initial denaturation followed by 35 cycles of 95 ºC for 30 seconds, 60 ºC for
60 seconds, and 72 ºC for 120 seconds followed by an extension of 81 ºC for 15 seconds to
acquire fluorescence reading. All samples were run on a Rotor-gene 6000 real time PCR
machine for analysis of gene expression (Corbett Research). Ct vales were obtained with a
fluorescence threshold at 0.05 for all samples. A melt curve of fluorescence versus
temperature (ºC) was performed to check for primer-dimer formation within the samples.
[image:36.595.50.529.547.686.2]Primer sequences for each gene investigated are provided in Table 2.1.
Table 2.1 – Primer sequences for measurement of inflammatory gene expression by q-PCR
26 2.3.4 Calculation of Relative Gene Expression
Quantification of mRNA expression for each gene was essentially as described previously
[174]. Briefly, standard curves for each inflammatory marker and housekeeper gene were
performed by purifying and cleaning PCR product for each marker, establishing a relative
concentration of the cleaned product, and producing a serial dilution. The qPCR protocol
was re-performed on the serial dilution of each marker. The standard curve was created by
plotting the Ct values against log2 copies by linear regression and the following calculation
(y=ax+b) could be determined. The coefficient of determination (R2) of the line, and thus the standard curve, was used to calculate cDNA copy number in the original reverse transcription
reaction, which is proportional to the initial mRNA concentration. This takes into account
small differences in PCR amplification efficiency (ideally with a slope of 1 on the standard
curve) that delta Ct comparisons used in some studies do not take into account. Gene
expression was thus determined from the log of cDNA copy number determined from the Ct
versus log copy number standard curve for each gene, and the absolute copy number
expressed as a ratio to housekeeping gene (ribosomal S9 mRNA) copy number for each
sample. This allowed to correct for differences in mRNA input into the PCR reactions. Note
that this method preserves information about mRNA absolute copy number so that data from
different PCR runs can be compared, whereas delta Ct comparisons must include samples
from different experiments in a single run or establish that amplification efficiency has not
27