1
VALIDATION OF SCORE CARD TO PREDICT
ADHERENCE OF MEDICATIONS IN CHILDREN
AND ADOLESCENT POPULATION WITH
PSYCHIATRIC DISORDERS
Dissertation submitted to the Tamil Nadu Dr.M.G.R Medical University in partial fulfillment of the Degree of MD in Psychiatry
2
CERTIFICATE
I hereby declare that this dissertation titled “Validation of Score Card to Predict
Adherence of Medications in Children and Adolescent Population with Psychiatric Disorders” is a bonafide work done by Dr. Sony Mathews Lukose at the Department of
Psychiatry, Christian Medical College. This work has not been submitted to any University in part or full.
Dr.Anju Kuruvilla Dr. Alfred Job Daniel
Professor and Head Principal
Department of Psychiatry Christian Medical College
3
CERTIFICATE
I hereby declare that this dissertation titled “Validation of Score Card to Predict
Adherence of Medications in Children and Adolescent Population with Psychiatric Disorders” is a bonafide work done by Dr.Sony Mathews Lukose under my guidance
at the Department of Psychiatry, Christian Medical College. This work has not been submitted to any University in part or full.
Dr. Paul Swamidhas Sudhakar Russell Professor of Psychiatry
4
D E C L A R A T I ON
I hereby declare that this dissertation titled “Validation of Score Card to Predict
Adherence of Medications in Children and Adolescent Population with Psychiatric Disorders” is a bonafide work done by me under the guidance of Dr. Paul Swamidhas
Sudhakar Russell, Professor of Psychiatry, Christian Medical College. This work has not been submitted to any University in part or full.
11
ACKNOWLEDGEMENTS
I would like to express my deep felt gratitude:
To my Lord Jesus Christ, Who is my guiding light and led me through these years and helped me to do my post graduate studies at CMC.
To my guide Dr Paul Russell, who offered his support and guidance in choosing the topic and clarified my doubts as well as helped me with the analysis.
To Dr Shonima A V for giving me that push when I thought I couldn‟t cross that final
line and helped me with my write up.
To Dr Minju Sajith who helped me immensely walking the extra mile and guiding me right from the start. She accompanied me for the IRB meeting and has been a constant source of knowledge, practical help, encouragement, support and an excellent co-guide.
To Dr Priya Mammen who supported and encouraged me by helping me in getting more sample of patients than I could have by myself as well as valuable suggestions during the final weeks.
12
To Mr James, Secretary of Department of Psychiatry Unit I, who graciously helped me with the Tamil translations at very short notice.
To Mr Suresh, Secretary of Department of Psychiatry Unit II, who untiringly did the meticulous alignment of the entire thesis.
To Mr Palani (Senior Programmer), Mr Jayapal (Librarian, Department of Psychiatry) and Mr Jayasingh Vijay (Assistant Librarian, Gault Library) who gladly offered me their helping hands in taking print out and photo copies.
To my dear wife Shiney Mathew who has been my incessant support and help, and who motivated me to sit for long hours to complete this thesis. And especially for the temporary sacrifice of her career so that she could give my son all the care and love he deserves.
To my son Jeremy whose presence lifted my spirits whenever I was down as well as to my parents and in laws who lavished their love and affection upon me and cheered me up every time I felt low.
To my friends and colleagues who exhorted me to speed up every time I met them especially Nivedita and Utkarsh for chipping in it at crucial junctures.
13
Table of Contents
1. Introduction ... 15
2. Review of Literature ... 17
2.1 History ... 17
2.2 Definition ... 19
2.3 Types of Non Adherence ... 21
2.4 Prevalence ... 23
2.4.1 Psychiatric illnesses in children and adolescents outside India ... 23
2.4.2 Non adherence in Medical illnesses outside India ... 24
2.4.3Non adherence to medications in Psychiatric illnesses outside India ... 24
2.4.4 Psychiatric illnesses in child and adolescent population in India ... 25
2.4.5Non adherence in Medical illnesses in India ... 26
2.4.6 Non adherence in psychiatric patients in India ... 27
2.4.7 Non adherence in children and adolescent psychiatric population in India ... 28
2.5 Factors ... 29
2.5.1 Gender ... 32
2.5.2 Education ... 32
2.5.3 Socio Economic Status ... 33
2.5.4 Type of Illness... 34
2.5.5 Nature of Illness ... 35
2.6 Measuring Non Adherence ... 36
2.6.1 Morisky Medication Adherence Scale – 8 ... 41
2.6.2 Clinician Rating Scale... 44
3. Diagnostic Accuracy Studies ... 45
3.1 Sensitivity and Specificity ... 46
3.2 Errors ... 47
3.3 Convergent and Divergent Validity ... 48
3.4 Diagnostic Accuracy Studies in Non-Psychiatric Patients ... 49
3.5 Diagnostic Accuracy Studies in Psychiatric Patients ... 51
3. Justification ... 53
4. Aims and Objectives ... 54
4.1 Aim ... 54
14
5. Materials and Methods ... 55
5.1 Setting and Participants ... 55
5.2 Study Population ... 55
5.3 Sample Size ... 56
5.4 Selection Criteria ... 57
5.4.1 Inclusion Criteria: ... 57
5.4.2 Exclusion criteria: ... 57
5.5 Sampling Technique ... 58
5.6 Study Design ... 58
5.7 Measures ... 58
5.7.1 Vellore Score Card for Adherence to medications... 58
5.7.2 Comparing other tools for medication adherence ... 59
5.7.3 Kuppusamy Socioeconomic Scale ... 61
5.7.4 Child Sleep Habits Questionnaire... 63
5.8 Interview and Assessment ... 64
6. Results ... 67
6.1 Sociodemographic data ... 67
6.2 Diagnostic Accuracy ... 71
6.3 Reliability ... 76
6.4 Validity ... 78
6.4.1 Divergent validity ... 78
6.4.2 Predictive validity ... 78
6.4.3Factor analysis ... 79
7. Discussion ... 83
8. Strengths and limitations ... 87
8.1 Strengths ... 87
8.2Limitations ... 87
9. Conclusions ... 89
15
1.
Introduction
Everett Koop has very famously said that for a drug to take effect in a patient it has to be taken first and hence if it isn‟t working then the problem could be that it isn‟t being
taken in the first place.
Diseases or illnesses, implies the need for treatment, either to cure or to alleviate the symptoms caused by it. By treatment again the use of pharmacotherapy is inherently understood. This is so much truer when considering chronic illnesses specifically. Yet studies have shown that even in developed countries about 50% of patients with chronic diseases are irregular in their medications(1,2).
This problem has continued down the centuries to become a common challenge of current physicians, and has brought with it disastrous consequences as seen in the now very common scenario of antibiotic resistance leading to increased use of reserve drugs. This problem of irregular treatment adherence also extends towards non medication(3) related suggestions such as regular exercise and balanced diet which are equally important in establishing good health amongst patients.
16
becomes a serious threat to the quality healthcare outcome. And it is not just the patient who suffers by this. The burden is also borne by the relatives or caregivers of the patient and the society at large by the economic and social burdens imposed inadvertently. Every year about hundreds of billions of dollars are spent for the consequences of medication non adherence (4). But that has not been able to stem this crisis. And importantly it is money that can be diverted to other important needs or requirements, especially so in countries with poor financial resources.
17
2.
Review of Literature
2.1 History
Drug non adherence is a challenge that has been faced by physicians since the ancient days and has been observed as early back as in the times of Hippocrates when he had mentioned in his writings that it was essential to carefully watch on a certain problem with patients where they would commonly lie about complying with what was prescribed to them. And it was this particular behaviour according to Hippocrates that would lead to unfortunate events such as death which could not be justified even if the prescribed medication was difficult to take or bitter.
18
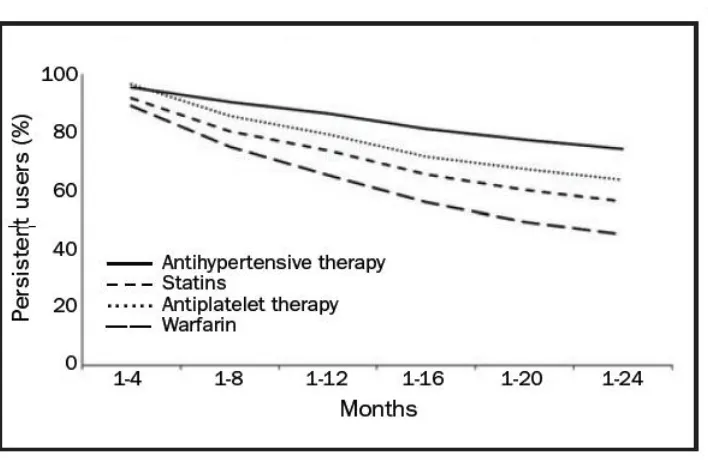
Figure 1: Persistence with secondary prevention medication in the 24 months after ischemic stroke in Sweden. Persistent use of secondary preventive drugs declines rapidly during the first 2 years after stroke (8).
[image:18.595.123.477.113.343.2]19
As difficult as it can be in medical illnesses, the problem of non-adherence appears more challenging in the treatment of psychiatric disorders due to various factors which includes illness variables and social factors at the least(12). The impact of this is a decrease in the quality of life as well as an added burden over the health care system(12). Hence the need to stem this crisis is the need of the hour.
2.2 Definition
The World Health Organization defines therapeutic adherence as “the extent to which a person‟s behaviour – taking medication, following a diet, and/or executing lifestyle changes, corresponds with agreed recommendations from a health care provider.”(2)
Compliance is a word that has been used consistently in this context. Compliance is defined as „The extent to which the patient‟s behaviour matches the prescriber‟s recommendations‟ (Haynes, Taylor and Sackett, 1979). However as mentioned earlier
it does bring a negative aspect towards the therapeutic relationship(9). Due to this aspect, the inability of a patient to follow the prescribed suggestion would lead the patient‟s behaviour to be interpreted as deviant.
20
„The extent to which the patient‟s behaviour matches agreed recommendations from the prescriber.‟(11)
Concordance is a newer term that is being used in relation to medication taking. It was originally defined as “a new approach to the prescribing and taking of medicines. It is
an agreement reached after negotiation between a patient and a health care professional that respects the beliefs and wishes of the patient in determining whether, when and how medicines are to be taken(13). Although reciprocal, this is an alliance in which the health care professionals recognise the primacy of the patient‟s decisions about taking the recommended medications” (Medicines Partnership, 2001). This was brought up
with the conceptualisation thatboth the patient as well as the prescriber had a part to play in the process of taking medications (Horne, 1993; McGavock, 1996).
However as simple as these may sound, these slight changes of words do bring about a significant change. Even the term concordance used is not a word meant to substitute the two earlier terms but is rather a process described to change the dynamics in the patient physician relationship to more of an equal. But it still does not measure the end point of patient behaviour of taking medicines.
21
(Sackett, 1985). Hence the fallible nature of the physician is addressed as well highlighting that the physician is also equally responsible for the instructions to be followed.
2.3 Types of Non Adherence
22
As the above figure indicates these three types of non-adherence can be classified into primary, secondary and tertiary. They may also be called as fulfilment, non-persistence and non-conforming respectively.
The impact of non-adherence also varies in clinical scenarios under which a particular drug is prescribed wherein certain situations like in the use of oral contraceptives, even a single missed dose could change the outcome significantly as against a person with dyslipidemia missing his cholesterol lowering drug(12). Also longer acting drugs allow a certain deviation in dosing in comparison to a shorter acting drug. This concept is understood better in terms of drug forgiveness, which is arrived at by subtracting the dosing interval from the duration of action(14).
23
Figure 3: Gap between prescription and medication use.(14)
2.4 Prevalence
2.4.1 Psychiatric illnesses in children and adolescents outside India
The prevalence of any ICD-10 diagnosis among a random sample of 5-10 year old children in Bangladesh were found to be at 15% with an increased rate of obsessive compulsive disorders as well as increased prevalence of behavioural problems among slum children (15). This study concluded that based on these figures about 5 million children by virtue of extrapolation have psychiatric disorders and in a country with
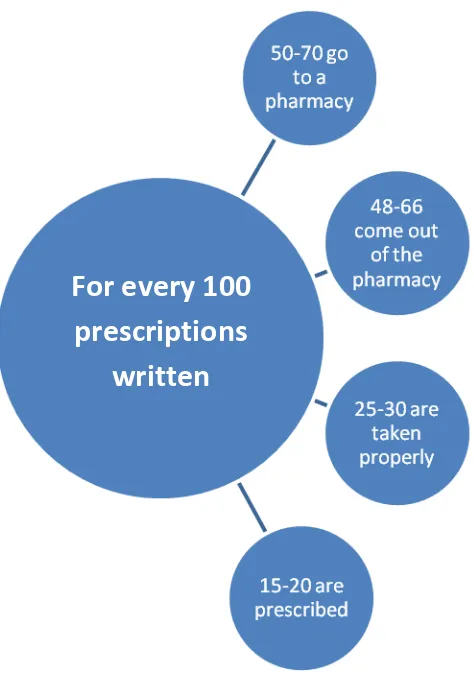
For every 100
prescriptions
24
very few child psychiatrists there would be a significant gap between what was needed and what was available.
2.4.2 Non adherence in Medical illnesses outside India
As mentioned previously WHO estimates that about 50% of patients with chronic diseases are irregular with their medications(2). In fact a recent article mentioned that the problem of non-adherence costs Americans between 100-280 billion US dollars annually(16). Similarly the problem of non-adherence amongst Europeans has been estimated to cost the EU about 1.25 billion Euros annually(17).
In a study conducted in Nigeria about 41% of the participants reported themselves to be non-compliant with their anti hypertensives(18). Another study in Ireland showed about 18% to be consistently non adherent to medications prescribed(19).
2.4.3Non adherence to medications in Psychiatric illnesses outside India
25
In a study by Pogge et al conducted in the U.S, among 86 adolescent psychiatric inpatients, following discharge at 10 months only about 45% were adherent to the prescribed medications(21). Another study conducted in Brazil, which focussed on victimized children, those children who had mood disorders alone were found to have higher rate of adherence of 79.5%. Those with substance abuse disorders alone had poorer compliance at 40%. An intermediate rate of 50% was observed among those having both disorders(22).
2.4.4 Psychiatric illnesses in child and adolescent population in India
Generally data on mental needs of children in India are limited(23). The Indian Council of Medical Research conducted an epidemiological study to study the prevalence rates of psychiatric disorders in child and adolescent population. This was conducted in two centres, namely Bangalore and Lucknow. At Bangalore about 2064 children aged less than 16 years were studied which showed a prevalence rate of psychiatric disorders in child and adolescent population to be at 12.5%(23).
26
Estimates by teachers of the prevalence rates were higher at 10.17% as compared to estimates of parent‟s at 7.48%(24).
A follow up study to the Chandigarh study which looked at the incidence of psychiatric disorders in children revealed an incidence of 18 per 1000. However the authors also suggested that the higher dropout rate in the study could have resulted in a lower than expected results(25).
2.4.5Non adherence in Medical illnesses in India
Adherence to anti TB medications in developing countries has been reported at 40%(26). In a cross sectional study conducted in Mumbai about 84% of patients were adherent to the DOTS scheme(26). In another study conducted among diabetics in Dehradun only 16.6% were adherent to the prescribed medications while only 23.3% were adherent to the prescribed dietary restrictions(27).
27
2.4.6 Non adherence in psychiatric patients in India
Among psychiatric patients about 50% and 75% are non-adherent by the end of the first and second year respectively(30). In a study conducted among schizophrenia patients followed up at a centre in Chennai, about 58% reported non-compliance at some point of their treatment course(31). 31% of schizophrenia patients who attended a walk in clinic in India did not follow through for further detailed evaluations while another 32% would not turn up for follow-ups after the detailed evaluation (32).
Also about 10-60% of patients on treatment for depression were likely to discontinue their medications(33). Whereas among those patients on treatment with mood stabilisers, between 18-52% were non adherent(34). In comparison to non-depressed patients, depressed patients were found to be 3 times more likely to become non adherent to their medications(35).
28
In a study conducted at a tertiary care hospital in Kolkata, nearly 67% of 239 unipolar depressive patients were non adherent with their medications(37). This led them to relatively requiring more medications in comparison to those patients who were adherent to their prescribed treatment.
In another tertiary care centre in Chennai, a study done over 8 months among 200 out patients diagnosed with a psychiatric illness by a psychiatrist revealed that more than 80% of the assessed patients were non adherent with their medications(38).
In a cross sectional study done at IMHANS (Institute of Mental Health and Neurosciences) in Srinagar, only 26% of 200 patients were non adherent. The study was done from 2011 to 2012 with a newly designed questionnaire among out patients, while excluding new patients.
2.4.7 Non adherence in children and adolescent psychiatric population in India
29
Overall there was a paucity of data studying adherence of medications among children with psychiatric disorders in India. In a study by Sitholey et al conducted at Lucknow, among 24 children newly diagnosed with ADHD, 83.3% were non adherent within a month(42).
2.5 Factors
30
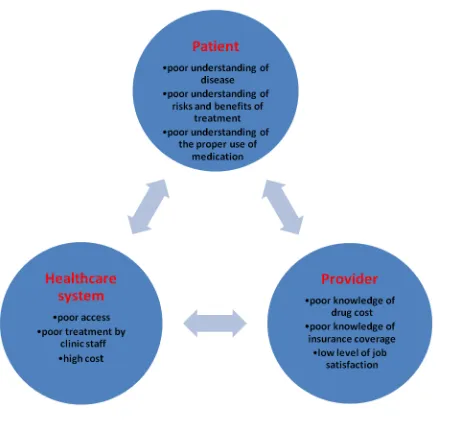
Understanding this model helps in directing specific solutions under those specific factors in a more focussed manner. It is easier for the physician to elicit or clarify for reasons if medication non adherence is suspected for the poorer outcome than expected.
31
Figure : Reasons cited for medication Non adherence (43)
32
We will now look at a few factors that have an impact on medication adherence keeping in mind the score card that is being validated in this study.
2.5.1 Gender
Gender is a factor that can have a bearing on the adherence pattern towards medications. This is especially more so if the said condition is for a behavioural disorder (45). In a study conducted in the United States among 29.5 million adults, it was found that women were more likely to adhere to their medications (46).
2.5.2 Education
Education is a factor that has been looked into and found to be associated with medication adherence behaviours. In a study conducted in Pakistan among diabetic patients, it was found that maternal education had a significant relationship with medication adherence (47). However the direction of this significance was not clearly stated. A similar finding was echoed in a study done in Tanzania, again among diabetic patients (48). In this study it was observed that educational status of the care giver had association with medication adherence.
33
treated for hypertension(18). A study in Finnish adolescents with epilepsy showed that good parental support had a positive effect on medication adherence (49). This could possibly be associated with the parental education though not specified so.
However there are studies that show an opposite trend also with people of lower educational status showing better compliance(50). In a review article published in 2008, it was found that the effect of educational status on medication adherence being equivocal (51).
2.5.3 Socio Economic Status
Treatment implies a cost that has to be borne by the patient for a period ranging from a few days to lifelong. Studies have found that this cost can be a reason for many to poorly adhere to their medications (52). Especially so in case of patients with chronic diseases, cost of treatment can be a burden if their income is inadequate or they have nil or low insurance support to meet their needs (53).
34
Dutta et al in their study looking at socio-demographic factors for non-compliance to treatment, in patients with locally advanced cervical cancer being treated at a rural medical college in West Bengal, found not surprisingly that poor socio economic status was the second most common factor for non-compliance(55).
In another study conducted among patients with affective disorders who were prescribed Lithium carbonate, poor adherence was associated with patient‟s perceptions of the cost involved. This study considered adherence to be defined by serum lithium level within a recommended therapeutic range and attendance for a period of six months prior to the study at 75 per cent or more of regularly scheduled clinic appointments (52).
Also about 10% of patients reported costs as a reason for non-compliance towards inhalers in patients with bronchial asthma. This was in a study conducted at 2 medical colleges in Karnataka in the respective department of respiratory medicine following up patients over a 2 year period (56).
2.5.4 Type of Illness
35
comparing the adherence rates of different durations of treatment of 3, 6 and 12 months, adherence rates were higher for shorter durations at 87%, 78% and 68% for the three regimens, respectively (57).
However certain other studies such as by Sharkness et al showed that over the years the adherence rate improved due to probable improvement of patients denial and a better understanding of the illness and need for treatment (58).
2.5.5 Nature of Illness
Sultan et al in their recently conducted study in 2013 in a medical college in Andhra Pradesh, amongst out patients over a period of 7 months, concluded that the presence of continuous illness like schizophrenia resulted in an increased rate of non-adherence(59). About 45% of patients with schizophrenia in their study were non adherent to their prescribed medications. The reason attributed for this was a lack of understanding of the illness.
36 2.6 Measuring Non Adherence
There are several ways to assess medication non adherence (61). These would include both subjective as well as objective measures. Subjective measures used would include eliciting history from the patient as well as the caretaker, checking patient‟s case note recordings, looking into prescription dispensing, as well as the treating physicians own assessment of the patients medication taking behaviour.
Among these the patient self-report is reported to be most accurate (63) and was also seen to be comparable to of another study assessing medication non adherence in mood disorders (33). In a study conducted in Canada it was found that physicians were unable to predict the medication behaviour in more than 70% of their patients despite having known them for several years (64).
Adherence can also be measured by collateral information gathered from family members, pharmacists as well as by methods such as pill counting and estimation of drug levels in the blood. We shall look into the challenges of these methods in the following paragraphs.
37
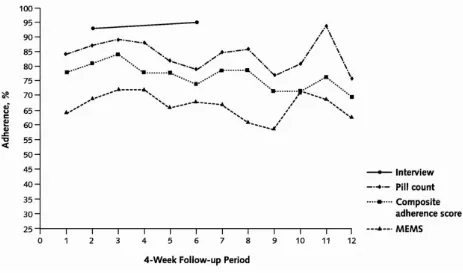
[image:37.595.77.540.254.527.2]problems where the patients can claim to be on regular medications which would however be countered by alternate methods used to confirm such as counting of pills as was seen in the study done among a group of patients with affective disorders (33). There could be both decreased as well as increased doses being taken.
Figure: Comparison of varying adherence rates by using different methods in the same patient (66)
38
The problem of inaccuracy in self-reporting may occur due to patients facing the challenge of being honest with their treating physicians of their drug taking behaviour and thereby causing them displeasure or being embarrassed (66). Or in other cases could be due to plain unawareness.
Though the help of the family members may be roped in dealing with the problem of non-adherence, it is physically impossible to do so all the time. There could also be the physician increasing the risk of strained relations between the patients and their family members.
Counting of pills is the other method that can be used. But again there can be instances when pill numbers may tally with the patient secretly discarding the medications to avoid getting caught. Or it may also occur that the patient may not be taking doses in the manner prescribed(68).
39
drugs which cannot be estimated by such methods or even individual variations of absorption and/or metabolism of drugs in patients especially so in extremes of ages.
All of this suggests that there is not a single way by which medication non adherence can be surely identified. And it would be rather a combination of methods that would serve to identify the problem.
For certain patients the taking of medications would be a stark reminder of the fact that they have an illness. Hence denial would be a reason for such people to be non-adherent to their medications (70,71).
A physician who is perceived to be rigid and cold in his dealings may not go well with patients who expect a friendlier and warm person to help them with their medical problem. And this could also cause difficulty in maintain adherence to medications.
40
And so the challenge to researchers has been as to how to measure adherence to medications has remained (73). And the lack of a valid method to measure non adherence itself has been a stumbling block in medication adherence research.
Direct methods of measuring medication adherence are considered to be the most representative of truth. However to many patients this would be unacceptable being invasive. Besides this may be feasible in situations of a single dosing, intermittent medications or in hospitalised patients (73).
With the advent of microprocessors and the use of electronic devices, or MEMS (medication event monitoring system), which enables both frequency and time of opening of the medication bottle to be measured (73), there have been startling discoveries of „drug holidays‟ and „white coat adherence‟. This was when the patient
would become compliant towards the time of the consultation time (67).
Though methods such as electronic monitoring may be used to enhance adherence, if a patient did not intend to be adherent then he/she would not make the effort to use an electronic dispenser in an expected manner(74).
41
2.6.1 Morisky Medication Adherence Scale – 8
42 Table: Comparison of MMAS-4 and MMAS-8
In 2008 it was further modified into an 8 item questionnaire with the first 7 questions maintaining the dichotomous pattern, while the eighth and final question was a 5 point likert type question. This improved the sensitivity to 93% and the specificity to 53%. This is now a widely used tool for assessing medication non adherence.
Table: Scoring ranges for MMAS-4 and MMAS-8
The researchers, who developed the MMAS-8 while working among hypertensive patients, proposed that the tool was a very simple one to use in practical situations like an outpatient setting and was therefore a relevant tool to aid in identifying patients with medication non adherence (77).
The qualities that make it a preferred tool include it‟s validation into several languages across the world, it‟s use in different settings and diseases (75). In a study conducted in
43
However the MMAS-8 is not a comprehensive measure and only captures non adherence in certain areas (77). It also is unable to predict or assess reasons towards non adherence. And so by this lacking makes it less useful in applying interventions to address such factors.
Another drawback is that it is only able to measure adherence to medications in one particular disease. Several patients may be on prescriptions warranting them to be on multiple medications at the same time. However due to personal reasons or beliefs they may be selective in following the prescribed order and be adherent to some medications while being non adherent to certain other medications (75).
44 2.6.2 Clinician Rating Scale
The Clinician Rating Scale is a simple ordinal scale of 1-7 that helps a physician or researcher to quantify his/her assessment of the patient‟s extent of medication
adherence(79). According to this scale higher scores would point towards greater medication non adherence. Scores of < 5 were considered to be non-adherent(80).
The CRS has shown to be sensitive in two controlled trials looking at compliance therapy where it demonstrated differences in outcome in patients who were receiving compliance therapy as against a non-specific counselling (81,82).
In this researcher‟s study the CRS is being used as a measure of gold standard to
45 3. Diagnostic Accuracy Studies
In our present research we aim to validate a newly developed score card. So let‟s now
look into the relevant aspects of what validation means and its relevance to research. Validation involves the testing as well as the adaptation of instruments that measures patient related outcomes where it has not been tested yet. This would fall into the category of diagnostic accuracy studies, which are designed to gather evidence on how well would a particular test identify or even rule out a particular disease or a condition (83).
46
It would be ideal when comparing two diagnostic tests that they be compared in the same patient. If that would not be possible then at least they ought to be from the same randomized population. This would ensure that the difference observed would be due to the tests and not to the patient (83).
3.1 Sensitivity and Specificity
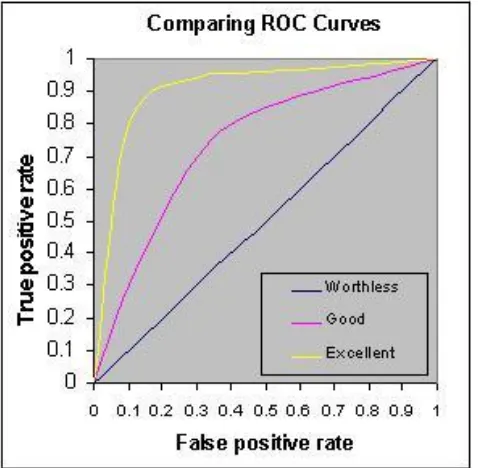
[image:46.595.129.368.435.669.2]Certain methods would summarise the so called accuracy of a study at over a range of different thresholds. These would summarise the accuracy over a range for example as the area under the receiver operator curve (ROC).If a diagnostic accuracy test is to be clinically useful, it should help in influencing the management of the patient.
47
The term sensitivity of a test refers to the ability of the test to identify a positive finding when the targeted condition is actually present. This is also referred to as true positive. In other words, it is the ability of the test to identify a condition in a person when the condition is actually there.
The term specificity refers to the ability of a test to identify if the disease or condition is absent when in actuality it is truly is absent. This is also referred to as true negative. These values can be used to arrive at likelihood ratios, both positive and negative. In simpler terms this would mean the ability of the test identify those people as not having the condition when it is actually absent.
3.2 Errors
There also is the need for proper evaluation process in such studies, to reduce the rate of errors(86). Poorly designed studies may lead to diagnosis being inaccurate, treatment being inappropriate as well as errors of judgement while making clinical decisions. Poor methodological issues may lead to poor quality of reporting (87).
48
Diagnostic accuracy studies may be done for a newly developed instrument or it may also be applied in new diseases where it may not have been applied yet or even in new populations or languages. This also involves test retest reliability, internal consistency as well as validity.
This process involves comparing the new test with another which would be the gold standard and verifies whether the new test will be able to produce desirable results in comparison. This construct is referred to as validity (89).
It needs to be understood that validity is distinct from reliability. While validity refers to whether the desired test measures what it sets out to measure originally, reliability refers to whether the test does so consistently. So putting into perspective, if a clock was unable to show the time it would be invalid. However, if it was on certain occasions slow and on other occasions fast it would be deemed to be unreliable. If a clock was consistently 30 minutes slow then it would be reliable but not valid.
3.3 Convergent and Divergent Validity
49
strength of association between independent measures which are designed so as to measure the same construct. Whereas divergent or discriminant validity refers to the poor association between measures that are designed for unrelated constructs (89).
For a measure with good construct validity, attempts must begin right from the initial stage when the construct is defined and various factors are considered to be representative (89). So if a test would have to measure for example psychosis, then the crucial first step would be to define what psychosis would be. In the absence of a precise definition there would be difficulty in distinguishing it from say anxiety or depression.
Messick in his work described that construct validity had six contributors; content relevance and technical quality, theoretical understanding of scores and associated empirical evidence, structural data, generalizability, external correlates and consequences of score interpretation(91).
3.4 Diagnostic Accuracy Studies in Non-Psychiatric Patients
50
In a study conducted in the United States, a newly developed prospectively applicable method for aiding in the classifying of co morbid conditions which could change the risk of mortality in longitudinal studies was conducted and was found to be simple, readily applicable as well as a valid method of doing so (92).
In another study conducted among general medical populations, the validity as well as the reliability of 3 scales was assessed and found to be internally reliable. It was able to look into the reason behind health care utilisation by the general population (93).
The Brief Pain Inventory is a scale which is used to assess pain in patients who were having malignancy. It was a simple tool that could be used in patients for palliative care. This was validated into the German language and was found to be comparable to the original version (94).
51
3.5 Diagnostic Accuracy Studies in Psychiatric Patients
In a study conducted in the state of Kerala under the National Rural Health Mission (NRHM) a self-administered questionnaires for assessing mental health among adolescents in primary-care setting was validated (96). It was the shorter version of the Teen Screen Questionnaire-Mental Health (TSQ-M). The study revealed the shorter version which was newly developed had for a score of ≥ 6 ,a sensitivity of 76%, specificity of 74%, positive likelihood ratio of 2.99, negative likelihood ratio of 0.33, positive predictive value of 6% and a negative predictive value of 82.1%. This was better than the original scale (96).
In another study conducted in a tertiary care centre in Tamil Nadu, Russell et al evaluated the diagnostic accuracy, reliability and validity of Childhood Autism Rating Scale (CARS) (97). The authors assessed that a score of ≥33 in the CARS achieved a sensitivity of 81.4% (95% CI=71.6-89), a specificity of 78.6%, (95% CI=49.2-95.1), a positive likelihood ratio of 3.8 (95% CI=2.8-5.1), a negative likelihood ratio of 0.24 (95% CI=0.08-0.70), a positive predictive value of 95.9%, and a negative predictive value of 40.7%; therefore it was ideal as a screening cut-off score to identify possible cases of autism (97).
52
of 17.6 % for screening. With a cut-off score of ≥ 22 the sensitivity was 27.3% and specificity 90% for diagnosis. They concluded that it was a psychometrically valid tool for screening depression in adolescents in a primary care setting (98).
In yet another study a Sinhalese translation of the Impact of Event Scale- 8 items version (IES-8) for use in Sri Lanka was validated (99). This was a cross sectional study that was conducted in rural south Sri Lanka to survivors of the tsunami. A cut-off score of 15 gave a sensitivity of 77% for screening purposes.
Mammen et al developed and validated a concise, parent-completed Brief Intellectual Disability Scale (BIDS) for children to be used in countries with low–disability resource and high–disability care burden (100). It was a prospective cross sectional study. They concluded that BIDS scores of ≥5 had sensitivity of 71.43% and
53
3. Justification
54
4. Aims and Objectives
4.1 Aim
The aim of this study is to evaluate the predictive validity of a newly developed score card to assess medication non adherence in children and adolescents with psychiatric disorders attending a tertiary care hospital in Vellore.
4.2 Objectives
1. To measure the predictive ability of the score card by comparing with the gold standard test after a period of 3 months
2. To measure the convergent and divergent validity of the score card
55
5. Materials and Methods
5.1 Setting and Participants
The setting for the study was the Child and Adolescent Psychiatry Unit, Department of Psychiatry, Christian Medical College, Vellore. This is a tertiary care centre in South India without any geographically defined catchment population. The unit has two divisions, one for children with emotional and behaviour problems and the other for children with developmental disorders. The study included children from both the divisions. The study was conducted from January 2015 till the sample size is achieved.
5.2 Study Population
56 5.3 Sample Size
Required sample size to show that the new tool is able to show non-adherence was found to be 150 children, with 80% power and 5% level of significance and a prevalence of about 20% of non-adherence.
Regression methods - Multiple logistic regression
Proportion of disease 0.5 0.2 0.5 0.2
Anticipated odds ratio 2 2 1.5 1.5
Power (1- beta) % 80 80 80 80
Alpha error (%) 5 5 5 5
1 or 2 sided 2 2 2 2
Multiple correlation coefficient of the
exposure variable with the confounders 0.3 0.3 0.3 0.3
Required sample size 99 149 229 383
57 5.4 Selection Criteria
5.4.1 Inclusion Criteria:
1) Age between 3 and 18 years of age.
2) Those with various psychiatric disorders according to International Statistical Classification of Diseases and Related Health Problems 10th Revision.
3) Those who are on psychotropic medications.
4) Patients who are attending the new or review outpatient clinic in CAP unit.
5) Either the patient or the primary caregiver should have a working knowledge of Tamil and English.
5.4.2 Exclusion criteria:
1) Those who are not accompanied by a reliable caregiver to give medication adherence history.
58 5.5 Sampling Technique
All consecutive patients who are registered under the Child and Adolescent Psychiatry unit and who satisfy the selection criteria will be recruited into the study.
5.6 Study Design
This is a prospective longitudinal study where the Vellore score card was validated.
5.7 Measures
5.7.1 Vellore Score Card for Adherence to medications
This is a score card for medication non adherence developed in the Child and Adolescent Psychiatry Department at CMC Vellore. The score card building was based on the odds ratio (OR) and the clarity of the „predictiveness‟ by being picked-up by more than one measure for the medication adherence. The OR was taken as a „risk factor‟ if it was >1 and as „protective factor‟ if it was <1. Each risk factor was given
59
5.7.2 Comparing other tools for medication adherence
Given below in the table are various the tools used for measuring non adherence to medication.
Scale Author Sensitivity Specificity
MMAS Morisky 93 53
CRS Kemp NA NA
MAQ Morisky 81 44
BARS Byerly 73 74
60
Table: MMAS – Morisky' Medication Adherence Scale; CRS – Clinician Rating Scale; MAQ – Medication Adherence Questionnaire; BARS – Brief Adherence Rating Scale; MARS – Medication Adherence Rating Scale
The MMAS and CRS have been discussed earlier. The MAQ was originally developed by Morisky and his colleagues towards assessing medication adherence. This was done in a population of hypertensives and shown to have good predictive validity. It has been used by several researchers as well. However psychometric analyses have shown only mixed results (101).
The BARS was developed by Byerly and colleagues(102). It was introduced with a simple description of a clinical rating scale for adherence that could be done with merely a pencil and a paper. It consisted of only 3 questions which was adapted from a questionnaire which was used in the CATIE trial. These questions assessed the patients knowledge about his medication patterns. The adherence was finally measured via a visual analogue scale.
61
As there is currently no measure that is considered as a gold standard test for measuring non adherence, we have decided to consider the CRS scale as the gold standard test in our study.
5.7.3 Kuppusamy Socioeconomic Scale
In our study we have used the Kuppusamy socioeconomic scale modified for the year 2014 by Sukhvinder Singh Oberoi(104)for the purpose of measuring socioeconomic status.
Education Score
Professional or Honours 7 Graduate or Postgraduate 6 Intermediate or post high school diploma 5 High school certificate 4 Middle school certificate 3 Primary school certificate 2
Illiterate 1
Occupation Score
Professional 10
62
Clerical, shop owner, farmer 5
Skilled worker 4
Semi-skilled worker 3
Unskilled worker 2
Unemployed 1
Monthly family income Score
≥36,997 12
18,498-36,996 10
13,874-18,497 6
9,249-13,873 4
5547-9248 3
1866-5546 2
63
Based on the above scoring system the scores for various socioeconomic classes are as follows.
Socioeconomic Class Score
Upper class 26-29
Upper middle class 16-25
Lower middle class 11-15
Upper lower class 5-10
Lower class <5
5.7.4 Child Sleep Habits Questionnaire
This questionnaire is used in the present study to assess the divergent validity of the score card.Following are a few relevant details regarding its development and use.
64
that cover significant sleep domains in children. This includes both medical as well as behavioural sleep disorders.
The eight subscales include bedtime resistance, sleep-onset delay, sleep duration, sleep anxiety, night wakening, parasomnias, sleep disordered breathing and daytime sleepiness (105). The items under each of these are score on a 3 point scale. Accordingly a higher score indicates sleep pathology. A cut off score of 41 has a sensitivity of 82% and specificity of 72% (106).
The CSHQ is a well validated tool that has been used in different countries and has been translated into several languages.
5.8 Interview and Assessment
65
measure for predictive validity the MMAS-8 was administered by Rater 3. At this time, Rater 1 reassessed 20% of the children with the score card for collecting the data on the test-retest reliability.
The detailed diagrammatic algorithm for the study was as follows.
48 patients approached who satisfied selection criteria
43 consented
Score card, CRS and CSHQ administered to 43 and score
card repeated for 6
MMAS administered to 14 and repeat score card for 8
Missing data for 2. Analysis done for 41
Results and conclusion
Baseline
66 5.9Statistical Analysis
67
6. Results
The results will be discussed under the following headings of participant characteristics, diagnostic accuracy, reliability of measures used and the validity of score card.
About 48 patients who met the selection criteria were approached initially. Among these only 43 consented to the study. Among the 43 who consented 2 had missing data and so were excluded from the final analysis.
6.1 Sociodemographic data
Table1: Patient and family characteristics for the sample
Variable Frequency (percent)
Sex
Male
Female
29 (70.7)
12 (29.3)
Religion
Hindu
Muslim
Christian
37 (90.2)
2 (4.9)
68 Socioeconomic status
Upper class
Upper middle class
Lower middle class
Upper lower class
69 No Co morbidity
Depression ADHD Intellectual Disability Seizure disorder 31 (75.6) 3 (7.3) 4 (9.8) 2 (4.9) 1 (2.4) Parent education Illiterate Primary school Middle school High school Intermediate/diploma
Graduate or post graduate
Professional or honours
70
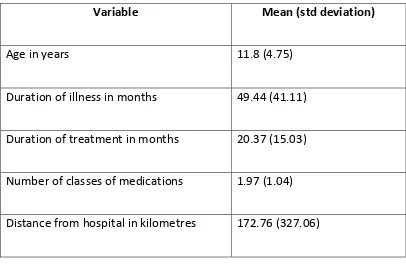
Table 2: Patient and family characteristics for the sample contd...
Variable Mean (std deviation)
Age in years 11.8 (4.75)
Duration of illness in months 49.44 (41.11)
Duration of treatment in months 20.37 (15.03)
Number of classes of medications 1.97 (1.04)
Distance from hospital in kilometres 172.76 (327.06)
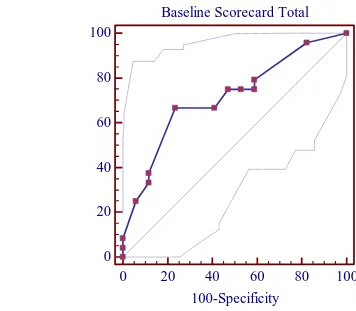
71 6.2 Diagnostic Accuracy
Baseline Scorecard Total
0
20
40
60
80
100
0
20
40
60
80
100
100-Specificity
S
e
ns
it
ivi
[image:71.595.84.440.217.528.2]ty
72
Table 3: Summary of the diagnostic accuracy of the Score Card for the three month Predictive validity based on Clinician Rating Scale as the Gold standard.
Variable scorecard_baseline
Baseline Scorecard Total
Classification variable CRS_di
Sample size 41
Positive group : CRS_di = 1
24
Negative group : CRS_di = 0
17
Disease prevalence (%) 58.5
Area under the ROC curve (AUC) 0.714
Standard Errora 0.0811
95% Confidence intervalb 0.552 to 0.844
z statistic 2.644
Significance level P (Area=0.5) 0.0082
a DeLong et al., 1988
73
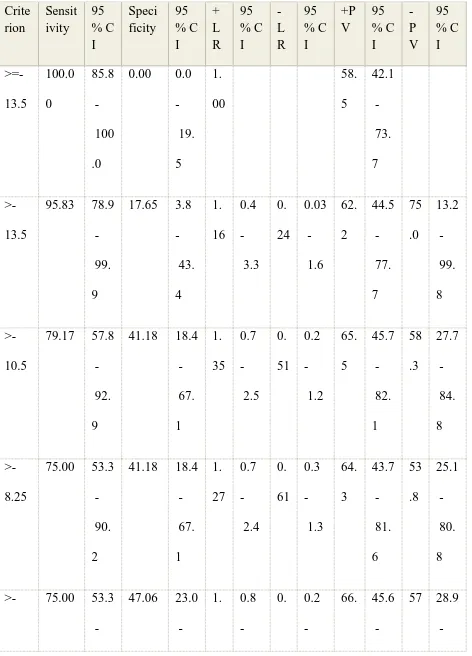
Table 4: Criterion values and coordinates of the ROC curve Crite rion Sensit ivity 95 % C I Speci ficity 95 % C I + L R 95 % C I -L R 95 % C I +P V 95 % C I -P V 95 % C I >=-13.5 100.0 0 85.8 100 .0
0.00 0.0 19. 5 1. 00 58. 5 42.1 73. 7 >-13.5
95.83 78.9 99. 9
17.65 3.8 43. 4 1. 16 0.4 3.3 0. 24 0.03 1.6 62. 2 44.5 77. 7 75 .0 13.2 99. 8 >-10.5
79.17 57.8 92. 9
41.18 18.4 67. 1 1. 35 0.7 2.5 0. 51 0.2 1.2 65. 5 45.7 82. 1 58 .3 27.7 84. 8 >-8.25
75.00 53.3 90. 2
41.18 18.4 67. 1 1. 27 0.7 2.4 0. 61 0.3 1.3 64. 3 43.7 81. 6 53 .8 25.1 80. 8
>- 75.00 53.3
-74
7.75 90.
2
72. 2
42 2.5 53 1.2 7 83. 8
.1 82. 3
>-7.5
75.00 53.3 90. 2
52.94 27.8 77. 0 1. 59 1.0 2.6 0. 47 0.2 1.1 69. 2 47.8 86. 0 60 .0 32.3 83. 7 >-4.75
66.67 44.7 84. 4
58.82 32.9 81. 6 1. 62 1.0 2.6 0. 57 0.3 1.3 69. 6 46.5 87. 1 55 .6 30.8 78. 5 >-3.75 *
66.67 44.7 84. 4
76.47 50.1 93. 2 2. 83 1.9 4.2 0. 44 0.2 1.2 80. 0 55.6 94. 5 61 .9 38.4 81. 9
>-3 37.50 18.8 59. 4
88.24 63.6 98. 5 3. 19 1.8 5.5 0. 71 0.2 2.7 81. 8 46.3 98. 1 50 .0 31.3 68. 7 >-2.25
33.33 15.6
-75 55.
3
98. 5
5.1 2.9 97.
9
66. 9
>-0.75
25.00 9.8 46. 7
94.12 71.3 99. 9 4. 25 2.1 8.6 0. 80 0.1 5.4 85. 7 42.1 99. 6 47 .1 29.5 65. 1
>0 8.33 1.0 27. 0 100.0 0 80.5 100 .0 0. 92 10 0.0 2.5 100 .0 43 .6 27.6 60. 6
>3 4.17 0.1 21. 1 100.0 0 80.5 100 .0 0. 96 10 0.0 50.0 100 .0 42 .5 26.9 59. 3
>6 0.00 0.0 14. 2 100.0 0 80.5 100 .0 1. 00 41 .5 26.3 57. 9
76
The sensitivity, specificity, likelihood ratios and different predictive values for different cut off points on the Vellore score card for medication adherence were tested against the dichotomised (based on the cut off of less than or equal to 5 as poor adherence) CRS which was considered the gold standard. Table 4 summarizes these results. A score of 0 was taken as the cut off score as it had a specificity of 100% making the score card a valid tool to predict non adherence. However its sensitivity was only 8.33% at this cut off. The area under curve (AUC) in the ROC of the score card was 0.714 (z is 2.644, p=0.0082).as noted in figure 1.
[image:76.595.86.507.456.642.2]6.3 Reliability
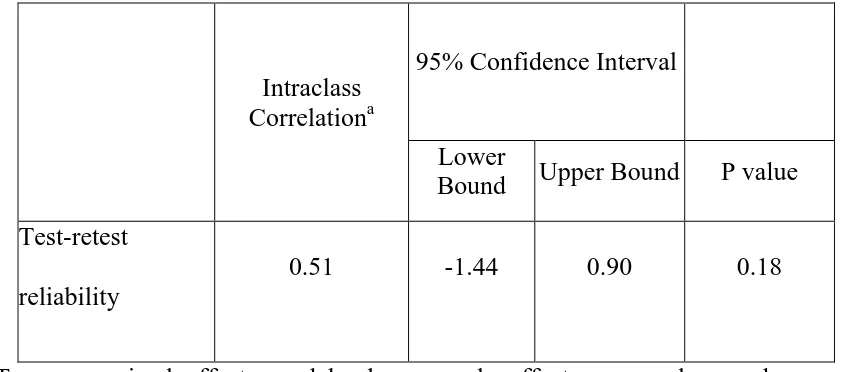
Table 5: Test –retest reliability of the Score Card
Intraclass Correlationa
95% Confidence Interval
Lower
Bound Upper Bound P value Test-retest
reliability
0.51 -1.44 0.90 0.18
a
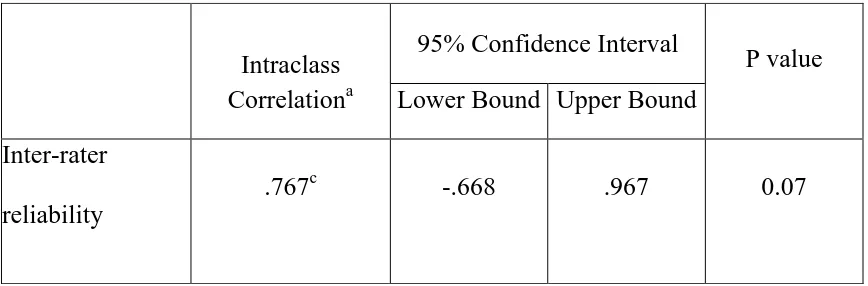
77 Table 6: Inter-rater reliability of the Score Card
a=Two-way mixed effects model where people effects are random and measures
effects are fixed.
The test retest reliability and the inter rater reliability were studied to assess the reproducibility of the score card and the ICC was respectively 0.51 (p=0.18) and 0.77 (0.07). According to Halgren et al the ICC scores for inter rater reliability is excellent
Intraclass Correlationa
95% Confidence Interval
P value Lower Bound Upper Bound
Inter-rater reliability
78 6.4 Validity
6.4.1 Divergent validity
Divergent validity of the Score card against the Children‟s Sleep Habit Questionnaire
(with and without resampling)
Table 7 shows the divergent validity as calculated by correlating the score card with the child sleep habit questionnaire showed no significant association (r= - 0110, p = 0.492). This proves that both the score card and the CSHQ diverge conceptually.
Baseline Score
Card CSHQ
Confidence
Intererval P value
Baseline Score Card
1 .110 95% .492
CSHQ .110 1 95% .492
6.4.2 Predictive validity
There was no statistical difference between the scores of the vellore score card and the modified morisky‟s scale both of which were administered at follow up (chi square –
[image:78.595.62.512.413.601.2]79 6.4.3Factor analysis
Table 8: Total Variance Explained
Component
Initial Eigen values Extraction Sums of Squared Loadings Rotation Sums of Squared Loadingsa Total % of Variance Cumulative % Total
% of Variance
Cumulative
% Total
1 2.433 24.335 24.335 2.433 24.335 24.335 2.028
2 1.787 17.865 42.200 1.787 17.865 42.200 1.986
3 1.416 14.161 56.361 1.416 14.161 56.361 1.615
4 1.172 11.722 68.083 1.172 11.722 68.083 1.272
5 1.086 10.865 78.948 1.086 10.865 78.948 1.184
6 .884 8.842 87.790
7 .571 5.707 93.497
8 .454 4.543 98.040
9 .112 1.117 99.157
10 .084 .843 100.000
Extraction Method: Principal Component Analysis.
81 Table 9: Structure Matrix
Component
1 2 3 4 5
Sex -.634 -.126 -.153 .412 .305
Parents Illiteracy -.023 .147 -.052 .023 .893
Parents Primary School Education
.330 .551 -.241 .422 -.268
Parents Middle School Education
-.076 .239 .741 -.111 -.221
Upper Middle SES .160 -.036 -.104 -.856 -.054
Lower Middle SES .135 -.882 -.109 .275 -.090
Upper Lower SES -.188 .873 .179 .260 .167
Continuous Illness .843 -.091 -.420 -.125 -.269
BPAD -.087 -.065 .866 .127 .133
Depression .845 -.182 -.032 .058 .214
Extraction Method: Principal Component Analysis.
82 Figure 3: Component plot
83
7. Discussion
The Vellore score card for adherence to medications is the first time that a measure has been used to attempt to predict medication non adherence in all patients. Currently existing measures aim to capture the problem after it has occurred leading to significant dysfunction, distress and added costs as has been discussed initially. This specific score card was devised following a previous study undertaken by another researcher who was looking into various factors linked with medication non adherence in children and adolescent population with psychiatric disorders.
As has been well established medication adherence is a well known fact among children as much as it is in the adult population. Hence any relapse is a significant burden on the family as well as the nation‟s resources. In a developing country like India where resources are scarce to come by whether in terms of healthcare, financial or any other, it would be prudent to say that any method to cut short this menace would be welcome. And it is in this gap that the score card falls in place as a method of cutting short this problem. If the score card is able to accurately pick up the possible children who are going to be non adherent to medications, then specific strategies to deal with it can be initiated. Hence this current study attempted to validate the same score card. At present this study is an ongoing study and is yet to be completed.
84
girl child. There may be other reasons such as the boy child being expected to be the income generator for the family in the future. Also the fact that, in the case of a girl child the stigma of having a mental illness could greatly affect the future marriage prospects and hence they would be not be brought to the hospital for such fears may be considered.
Most of the patients were from a upper lower socioeconomic status family which is consistent with the location as well as the overall financial situation of the country. The patients had come from far ranging places which included far extreme places of the country and even neighbouring foreign nations. This could be due to the reason that the hospital where the study was conducted was a premier referral institute which targeted not just the immediate surrounding areas. Also the fact that the health care resources of the country not being well developed, the need to travel far to access quality health care is well understood.
The majority of the patients were from a Hindu background which was also consistent with the sociodemographic profile of the country. Most parents were educated up to high school and belonged mostly to a nuclear family followed by a joint family.
85
other diagnoses included acute psychosis, adjustment disorder, ADHD and autism. This range of illnesses covered could give a better view of the problem as there was no undue focus on any one illness. Also the majority of the sampled patients, which was about 75% did not have any co morbid illnesses which again could show the effect of how a single illness can have in the case of medication adherence.
In comparison to the gold standard which was the clinician rating scale (CRS) the cut off for the Vellore score card was considered at 0. This gave a specificity of 100% as against a sensitivity of 8.33%. This was done as the tool was designed to be a highly specific tool to predict non adherence and be used to devise or implement specific strategies in such children. In a resource strapped country this would help divert the focus to only such patients who would require this and prevent wasting precious resources in others who were less likely to do so.
As was expected the measures of divergent validity which was the child sleep habit questionnaire was shown to have no correlation with the Vellore score card for medication adherence. This shows that the two scales are unrelated and measuring different constructs.
86
fair and good for values between .40 and .59 as well as .60 and .74 respectively. Those values that fall between .75 and 1.0 are deemed to be excellent. From this standard the Vellore score card had excellent inter rater reliability.
87
8. Strengths and limitations
8.1 Strengths
This is the first time that a study is attempting to develop a predictive tool for medication adherence. Also this tool has been developed specifically for non-adherence to medications in children and adolescents with psychiatric medications. The study does not focus onto any particular psychiatric disorder and rather includes all possible disorders.
8.2Limitations
We observed the following limitations to our study.
The current results are based on the limited sample size and hence cannot be used to finally conclude. As the study will be continued, it is to be seen n the future whether there is any significant result that may occur.
88
Currently the reference standards that are being used as gold standard, namely the Clinician rating scale (CRS) for the comparison are measures that are not specific to psychiatric disorders. This may also be a possible area of concern.
89
9. Conclusions
90
10. References
1. Lindberg MJH, Andersen SE, Christensen HR, Kampmann JP. [Compliance to
drug prescriptions]. Ugeskr Laeger. 2008 May 26;170(22):1912–6.
2. Eduardo Sabaté. ADHERENCE TO LONG-TERM THERAPIES - Evidence for Action
[Internet]. World Health Organisation; 2003. Available from:
http://whqlibdoc.who.int/publications/2003/9241545992.pdf
3. DiMatteo MR. Evidence-based strategies to foster adherence and improve
patient outcomes. JAAPA Off J Am Acad Physician Assist. 2004 Nov;17(11):18–
21.
4. Wahl LM, Nowak MA. Adherence and drug resistance: predictions for therapy
outcome. Proc R Soc B Biol Sci. 2000 Apr 22;267(1445):835–43.
5. Boudes P. Drug compliance in therapeutic trials: a review. Control Clin Trials.
1998 Jun;19(3):257–68.
6. Vermeire E, Hearnshaw H, Van Royen P, Denekens J. Patient adherence to
treatment: three decades of research. A comprehensive review. J Clin Pharm
Ther. 2001 Oct;26(5):331–42.
7. Brown MT, Bussell JK. Medication Adherence: WHO Cares? Mayo Clin Proc.
2011 Apr;86(4):304–14.
8. Haddad PM, Brain C, Scott J. Nonadherence with antipsychotic medication in
schizophrenia: challenges and management strategies. Patient Relat Outcome
Meas. 2014;5:43–62.
9. Stimson GV. Obeying doctor’s orders: a view from the other side. Soc Sci Med.
91
10. Barofsky I. Compliance, adherence and the therapeutic alliance: steps in the
development of self-care. Soc Sci Med. 1978 Sep;12(5A):369–76.
11. Royal College of General Practitioners (UK). Medicines Adherence: Involving
Patients in Decisions About Prescribed Medicines and Supporting Adherence
[Internet]. UK: NATIONAL INSTITUTE FOR HEALTH AND CLINICAL EXCELLENCE;
2009. Available from: http://www.ncbi.nlm.nih.gov/books/NBK55435/
12. Düsing R, Lottermoser K, Mengden T. Compliance with drug therapy-new
answers to an old question. Nephrol Dial Transplant Off Publ Eur Dial Transpl
Assoc - Eur Ren Assoc. 2001 Jul;16(7):1317–21.
13. Myfanwy Morgan RH. Concordance, adherence and compliance in medicine
taking [Internet]. UK: NHS National Coordinating Centre for Service Delivery and
Organisation (NCCSDO); 2005 Dec. Available from:
http://www.nets.nihr.ac.uk/__data/assets/pdf_file/0009/64494/FR-08-1412-076.pdf
14. Medication Adherence Clinical Reference - American College of Preventive
Medicine [Internet]. 2011 [cited 2015 Sep 27]. Available from:
http://www.acpm.org/?MedAdherTT_ClinRef
15. Mullick MSI, Goodman R. The prevalence of psychiatric disorders among 5-10
year olds in rural, urban and slum areas in Bangladesh: an exploratory study.
Soc Psychiatry Psychiatr Epidemiol. 2005 Aug;40(8):663–71.
16. The $289 Billion Cost of Medication Noncompliance, and What to Do About It -
The Atlantic [Internet]. [cited 2014 Oct 19]. Available from:
http://www.theatlantic.com/health/archive/2012/09/the-289-billion-cost-of-medication-noncompliance-and-what-to-do-about-it/262222/
17. “Improving the sustainability of healthcare systems through better adherence
92
paper.pdf [Internet]. [cited 2014 Oct 19]. Available from:
http://www.eu-
patient.eu/Documents/Policy/Adherence-compliance-concordance/Adherence%20-%20Joint%20briefing%20paper.pdf
18. Osamor PE, Owumi BE. Factors Associated with Treatment Compliance in
Hypertension in Southwest Nigeria. J Health Popul Nutr. 2011 Dec;29(6):619–
28.
19. Adherence Report Final.pdf [Internet]. [cited 2014 Oct 19]. Available from:
http://www.pfizer.ie/UserFiles/file/news_releases/Adherence%20Report%20Fi
nal.pdf
20. Ghaziuddin N, King CA, Hovey JD, Zaccagnini J, Ghaziuddin M. Medication
noncompliance in adolescents with psychiatric disorders. Child Psychiatry Hum
Dev. 1999;30(2):103–10.
21. Pogge DL, Singer MB, Harvey PD. Rates and predictors of adherence with
atypical antipsychotic medication: a follow-up study of adolescent inpatients. J
Child Adolesc Psychopharmacol. 2005 Dec;15(6):901–12.
22. Scivoletto S, Silva TF, Cunha PJ, Rosenheck RA. The impact of psychiatric
diagnosis on treatment adherence and duration among victimized children and
adolescents in São Paulo, Brazil. Clinics. 2012 Jan;67(1):3–9.
23. Srinath S, Girimaji SC, Gururaj G, Seshadri S, Subbakrishna DK, Bhola P, et al.
Epidemiological study of child & adolescent psychiatric disorders in urban &
rural areas of Bangalore, India. Indian J Med Res. 2005 Jul;122(1):67–79.
24. Malhotra S, Kohli A, Arun P. Prevalence of psychiatric disorders in school
children in Chandigarh, India. Indian J Med Res. 2002 Jul;116:21–8.
25. Malhotra S, Kohli A, Kapoor M, Pradhan B. Incidence of childhood psychiatric