University of Southern Queensland
Faculty of Engineering and Surveying
Recycling of Used Electronics in Singapore
A dissertation submitted by
Tan Heng Tsin Stanley
in fulfilment of the requirements of
Courses ENG4111 and 4112 Research Project
towards the degree of
Bachelor of Engineering (Electrical and Electronics)
Submitted: November, 2007
Abstract
Electronic waste is easily generated as people increasingly use electronic and
electrical equipment in the daily life. Technology advances rapidly and this caused
the life span of electronic products to become increasingly shorter. As a result,
electronic wastes are rapidly generated in our industry and society. Electronic waste
buried in landfills will cause toxins to leach into the environment. If they are
incinerated, they produce noxious gases. In both ways, they pollute the environment
and pose serious health threats to humans and also harm the wildlife. It will only be
sustainable if electronic wastes are recycled.
This research project was carried out to assess the problem of recycling of used
electronics in Singapore and the related environmental concerns. The harmful
effects of electronic wastes as well as the relating problems in other countries are
observed. An understanding is also made on the benefits of recycling of electronic
wastes as well. Related authorities’ and recycling company’s information are
reviewed to understand the generation, the disposal, the collection and the recycling
of used electronics in the country. In an attempt to identify better solutions which
could be effective to address the used electronics problems in Singapore,
information is researched on global recycling of electronic waste.
Case studies were conducted to understand the management used in handling of
used electronics in the companies. This provided a chance to observe the practices
and subsequently identification of problems in a company. A survey of consumers
was carried out to understand their attitudes and behaviours. This helped to identify
the problems faced in the community to which used electronics were not actively
recycled.
University of Southern Queensland
Faculty of Engineering and Surveying
ENG4111 Research Project Part 1 &
ENG4112 Research Project Part 2
Limitations of Use
The Council of the University of Southern Queensland, its Faculty of Engineering and Surveying, and the staff of the University of Southern Queensland, do not accept any responsibility for the truth, accuracy or completeness of material contained within or associated with this dissertation.
Persons using all or any part of this material do so at their own risk, and not at the risk of the Council of the University of Southern Queensland, its Faculty of Engineering and Surveying or the staff of the University of Southern Queensland.
This dissertation reports an educational exercise and has no purpose or validity beyond this exercise. The sole purpose of the course “Project and Dissertation” is to contribute to the overall education within the student’s chosen degree program. This document, the associated hardware, software, drawings, and other material set out in the associated appendices should not be used for any other purpose: if they are so used, it is entirely at the risk of the user.
Professor Frank Bullen
Dean
Faculty of Engineering and Surveying
Certification
I certify that the ideas, designs and experimental work, results, analyses and
conclusions set out in this dissertation are entirely my own effort, except where
otherwise indicated and acknowledged.
I further certify that the work is original and has not been previously submitted for
assessment in any other courses or institution, except where specifically stated.
Tan Heng Tsin Stanley
Student Number: 0050003071
__________________________________
Signature__________________________________
DateAcknowledgements
This project was developed with the guidance, encouragement and support of many
people.
I would like to thank Mr. David Parsons, my project supervisor, for his guidance
and invaluable advice throughout the course of study. I appreciate his enthusiasm
and encouragement.
Special thanks to Assoc Prof Ron Ayers for his guidance and advice on the survey
and to those who participated in answering the questionnaire as well as friends who
helped out in the data collection for the case studies.
I would also like to thank my family and my girlfriend for their support and
encouragement throughout my graduate study.
Tan Heng Tsin Stanley
2007
Table of Contents
Abstract... iii
Certification...v
Acknowledgements ... vi
List of Figures...x
List of Tables ... xii
Chapter 1:
Introduction...1
1.1 Project Background ... 1
1.2 Outline of the Report... 2
Chapter 2:
Literature Review ...3
2.1 Introduction ... 3
2.2 Background of Recycling of Used Electronics ... 3
2.3 Electronic Waste in Other Countries... 6
2.4 The Benefits of Recycling... 10
2.5 Summary ... 13
Chapter 3:
Methodology ...14
3.1 Introduction ... 14
3.2 Goal Definition... 14
3.3 Scope Definition... 14
3.4 Assumptions Used in Case Studies ... 16
Chapter 4:
Singapore’s Recycling...17
4.1 Introduction ... 17
4.2 Singapore’s Situation ... 17
4.3 Factors Leading to Used Electronics Generation ... 19
4.4 Waste Management ... 24
4.5 Conclusions ... 30
Chapter 5:
The Process of Recycling in Singapore...31
5.1 Introduction ... 31
5.2 The Collection of Used Electronics ... 31
5.3 Electronic Waste Recycling Companies in Singapore... 36
5.4 Conclusions and Recommendations... 41
Chapter 6:
Management of Electronic Waste in Other
Countries ...43
6.1 Introduction ... 43
6.2 Management in the United States (US)... 43
6.3 Management in Australia, Europe and Japan... 47
6.4 Conclusions and Recommendations... 50
Chapter 7:
Case Studies on Companies in the Local
Industry ...52
7.1 Introduction ... 52
7.2 Methodology ... 52
7.3 Case Study Number 1... 54
7.4 Case Study Number 2... 60
7.5 Evaluation of Results ... 67
7.6 Conclusions ... 69
Chapter 8:
Survey of Consumers ...70
8.1 Introduction ... 70
8.2 Methodology ... 70
8.3 Results and Observations of the Survey... 71
8.4 Key Findings and Recommendations... 82
8.5 Conclusions ... 84
Chapter 9:
Conclusions ...85
9.1 Introduction ... 85
9.2 Summary of Achievements ... 85
9.3 Recommendations for Future Work... 86
9.4 Final Conclusions... 87
List of References ...88
Bibliography ...93
Appendix A –
Project Specification...94
Appendix B –
List of Computers of Manufacturing
Company #2 ...96
Appendix C –
Survey questionnaire...114
List of Figures
Figure 2.1: Young et al. Manufacturing and the Environment (1997, Vol 13, No.7,
p.488)... 6
Figure 2.2: An investigator taking a soil sample along a riverside in Guiyu, China. 8 Figure 2.3: Copper laminate (left) and IC lead frames (right) collected for recycling. ... 10
Figure 2.4: Operational flow chart of recycling (CH E-Recycling Pte Ltd, 2007). . 11
Figure 2.5: PGMs recovery and refining (Cimelia Resource Recovery Pte Ltd, 2007)... 12
Figure 2.6: Copper sand (left) and bricks (right) (CH E-Recycling Pte Ltd, 2007). 12 Figure 4.1: Singapore’s manmade offshore landfill - Semakau Landfill... 18
Figure 4.2: Domestic market composition by market segment, 2003 – 2006 (IDA). ... 19
Figure 4.3: Export market composition by market segment, 2003 – 2006 (IDA). .. 20
Figure 4.4: Home computer penetration in Singapore (IDA). ... 21
Figure 4.5: Number of computers at home (IDA)... 22
Figure 4.6: Percentage of computer users (IDA). ... 23
Figure 4.7: NEA’s representation of recycling rates by waste streams in 2005. ... 28
Figure 5.1: Recycling bin for paper, plastic bottles and metal cans... 35
Figure 5.2: Recycling process of Centillion Environment & Recycling Limited, 2007... 37
Figure 5.3: Chemical process of Centillion Environment & Recycling Limited, 2007... 38
Figure 5.4: CRT recycling of Centillion Environment & Recycling Limited, 2007. ... 39
Figure 5.5: Incinerator of Centillion Environment & Recycling Limited, 2007... 40
Figure 8.1: The percentage of the different age groups of the respondents. ... 72
Figure 8.2: The different job types of the respondents. ... 73
Figure 8.3: The percentage of the presence of environmental policy in the workplace. ... 73
Figure 8.4: Percentage of policy that addressed electronic waste... 74
Figure 8.5: Source of awareness of electronic waste recycling. ... 75
Figure 8.6: Ways of dealing with unwanted electronic products... 76
Figure 8.7: Attitude of respondents towards buying of electronic products. ... 77
Figure 8.8: Reasons for not recycling unwanted electronics. ... 78
Figure 8.9: Perception of recycling. ... 79
Figure 8.10: Responsibility for the management of electronic waste. ... 80
Figure 8.11: The amount consumers are willing to pay to recycle an electronic product... 81
Figure 8.12: Consumers’ willingness to be involved in recycling in the future. ... 82
List of Tables
Table 4.1: Singapore’s annual statistics, 2007. ... 18
Table 4.2: NEA’s solid waste management data for 2004, 2005 and 2006. ... 26
Table 4.3: NEA’s representation of waste stream data for the year 2006... 29
Table 7.1: The computers and printers used in the Production Department of
Manufacturing Company #1... 54
Table 7.2: The CRT and LCD monitors in the Production Department of
Manufacturing Company #1... 55
Table 7.3: The parts that were not in operation in the Production Department of
Manufacturing Company #1... 56
Table 7.4: The parts that were sent for recycling or dumped in the Production
Department of Manufacturing Company #1. ... 57
Table 7.5: The weight of different computer parts and printers... 58
Table 7.6: The computers and printers used in the Production Department of
Manufacturing Company #2... 61
Table 7.7: The parts that were not in operation in the Production Department of
Manufacturing Company #2... 62
Table 7.8: The parts that were sent for recycling or dumped in the Production
Department of Manufacturing Company #2. ... 63
Table 7.9: Employment Statistics for 2006. ... 68
Chapter 1: Introduction
1.1 Project
Background
Electronics have become very much an integral part of our daily life. We are
increasingly engaged in using electronic products as technology advances rapidly.
We can expect the pace of innovations to get even faster. This in turn leads to a
shorter life span of electronic products as they become obsolete. As such, more
electronic wastes are generated in our industry and society. These wastes will only
add to the load on the incineration plants and landfills.
Unlike other rubbish, dumping electronic wastes in landfills poses a serious
environmental threat. Electronic products like computers and cell phones contain
toxins that can leak into the groundwater when buried. These harmful chemicals can
poison wildlife and pose a health threat to humans as well. It is therefore not a
viable solution. The best way to deal with all these concerns is to recycle electronic
wastes. Besides, there are many benefits about recycling of electronic wastes.
This research project aimed to understand the problem of recycling of used
electronics in Singapore and the related environmental concerns. In understanding
the local recycling of used electronics, available government data and recycling
companies’ information are reviewed. Analyses are done to critically assess current
Singaporean practice and actions are recommended for the future handling of the
issue. In an attempt to better understand the situation, observations are made on the
effectiveness and benefits of recycling electronic waste.
Specific problems areas, particularly the problems of collection, are identified and
subsequent opportunities for improvement are suggested. This included an attempt
to evaluate what proportion of used electronics is currently recycled. Going into a
wider scope in understanding the problem, information are researched on global
recycling of used electronics through reviewing published materials. This aimed to
find good systems that are used to address electronic wastes and relating them to the
local situation.
Case studies are done on manufacturing companies to understand the practices used
to manage used electronics. This included finding out the possible rate and
magnitude that could be generated in the company and in turn in the industries as a
whole. A survey of consumers is done to understand the attitudes and behaviours of
the consumers and to find out the barriers in the community in recycling of used
electronics. This included determining the extent to which they are involved now in
recycling or would be willing to be involved in the future.
1.2
Outline of the Report
This dissertation begins with a brief presentation of the project background in
Chapter 1. Chapter 2 reviews in detail the literature on the recycling of used
electronics. The growing problem and the harmful effects of electronic waste are
discussed. This included an understanding on the benefits of recycling of electronic
wastes as well. In Chapter 3, the goal and scope definition of the project is covered.
Chapter 4 understands the local situation, in particular the waste management and
the factors leading to used electronics generation. Subsequently, the collection of
used electronics and electronic waste recycling companies in Singapore are
observed and discussed in Chapter 5. Chapter 6 covers the management used in
dealing with electronic waste in other countries. This included relating good
systems to local situation.
In Chapter 7, the case studies are presented and discussed. This provides an
understanding of the practices made in the companies in handling used electronics
and the rate and magnitude of these wastes that could be generated in the company
and the industries. In Chapter 8, the results for the survey of consumers are
presented. Observations and discussions are made. This included recommendations
for improvements as well. Chapter 9 concludes the research project. Summary of
achievements are presented and recommendations for future work are made.
Chapter 2: Literature Review
2.1 Introduction
This chapter introduces the background of recycling of used electronics. The related
problems of electronic wastes are observed. This included an understanding of the
various difficulties faced in recycling of electronic wastes. This is followed by
observations made in other countries.
Subsequently, the various benefits of recycling of electronic waste are observed and
discussed. And finally, the key points are summarised.
2.2
Background of Recycling of Used Electronics
Discarded used electronics or electronic waste (commonly termed in short as
e-waste), are usually obsolete or irreparable electronic products. In the European
Commission, Directive 2002/96/EC Waste Electrical and Electronic Equipment
(WEEE), electrical and electronic equipment is considered as “equipment which is
dependent on electric current or electromagnetic fields in order to work properly,
and equipment for the generation, transfer and measurement of such currents and
fields” [WEEE Art.3 (a)].
They are data processing, telecommunications or entertainment products which are
used in private households or in businesses. These include cathode ray tube (CRT)
monitors and televisions, personal computers (PCs), cell phones, laptop computers,
printers, scanners, personal digital assistants (PDAs), digital cameras, MPEG-1
Audio Layer 3 (MP3) players, gaming consoles, etc. They contain toxic metals such
as lead, mercury, cadmium, chromium, zinc, nickel and beryllium, as well as
hazardous chemicals such as brominated flame retardant. Polluting polyvinyl
chloride (PVC) plastics are also commonly used to make these products.
Electronic products like desktop computers are commonly used in both companies
and at homes and they contain large amount of hazardous substances. The Straits
Times – Digital Life, Singapore (April 10, 2007) reported that a CRT monitor can
contain as much as 2 kg of lead. It was noted that high levels of lead exposure can
damage the vital organs, leading to coma or death from lead poisoning. Keyboards
which also have Printed Circuit Boards (PCBs) hence contain selenium, a
bio-accumulative toxin which can cause chemical pneumonia and tachycardia, a rapid
beating of the heart.
As for the Central Processing Unit (CPU), besides the large amount of PCBs in it,
parts like the switches and housing of the CPU, contains neurotoxin mercury which
attacks the central nervous systems and cause mental disturbances and
neuromuscular changes such as twitching and muscle weakness. In addition,
cadmium is also used in semi-conductors which affect the lungs and kidneys.
Electronic products like computers contain so much hazardous materials that even a
mouse’s plastic casing contains poly-brominated flame retardants which are a
persistent organic pollutant that can disrupt thyroid function.
As observed, electronic products of all kinds do contain a lot of hazardous
substances and chemicals. It was noted that these substances and chemicals can be
very harmful to humans, likewise to the wildlife, if the toxins escape into the
environment. It is therefore important that electronic products are properly managed
and safe disposals are carried out when products reached its end of life.
Electronic waste consists of large amount of plastics and metals which are
non-biodegradable. If buried in landfills, the toxins will leach into the environment.
Similarly, if they are sent to the incineration plants, they produce noxious gases
when burnt. It was observed that in both situations, they pollute the environment
and pose serious health threats to humans and also harm the wildlife. In December
2006, the UOB Kay Hian Research Pte Ltd estimated 70 % of the heavy metals
found in landfills come from electronic waste.
These further emphasised the need to dispose electronic products in a safe way and
the only method to do it is to recycle. In Singapore, The Waste Minimisation Unit,
now known as the Waste Minimisation Section under National Environment
Agency (NEA), was set up in February 1992 to promote recycling and lead waste
minimisation. NEA’s Waste Minimisation Section encourages the public to follow
waste management practice by the 3Rs, Reduce, Reuse and Recycle.
As observed, recycling is especially important for electronic waste and therefore
more efforts will be needed to ensure that these wastes are properly collected and
safely processed. In recent years, Singapore saw a rise in the number of electronic
waste recycling companies. For instance, local company CH E-Recycling (CHE)
Pte Ltd (www.che.com.sg), established in March 2005 has grown and even acquired
International Organization for Standardization (ISO) certifications, namely ISO
9001 and ISO 14001. They collect unwanted electronics from both consumers and
companies.
Although recycling services are available in quite a number of avenues, not many
among the consumers are aware and collection of used electronics proved to be
difficult. Recycling company CHE reported in The Straits Times – Digital Life,
Singapore (April 10, 2007) that most of the materials collected comes from
electronics manufacturers. In the same article, it was reported that consumers in
Singapore are found to be unaware of the various green disposal avenues available
to them. As observed, this would certainly be the main barrier to achieve high
recycling outcome for electronic waste.
Campaign is a good way to raise awareness and to collect used electronics for
recycling. In 2007, Hewlett Packard (HP) (www.hp.com) organised a campaign in
Singapore to mark Earth Day and gave vouchers in exchange for selected models
brought in for recycling. The campaign not only promotes electronic waste
recycling but also helps aware the public that electronics harm the environment if
they are not safely disposed. However, it was noted that the general response from
consumers to recycle electronic waste remains weak. As the lifespan of these
products get shorter, more electronic waste would be generated in the society and
industry. As observed, the environmental effects of electronic waste cannot be
ignored and the only solution to the problem is to recycle them. The various
problem areas should be identified and subsequently addressed so as to achieve a
high recycling outcome for electronic waste.
As observed, electronic wastes have a link with the government, the manufacturers
and the consumers such that each group has responsibilities and a role to play to
cope with the related problems. Efforts from the recycling companies are certainly
crucial to achieve high environmental outcome for electronic waste. Figure 2.1
shows the model used by Young et al. (cited in Askiner and Surendra 1998) to
illustrate the interactions among the different groups who are responsible for
environmental concerns. From the model, it was observed of how one group can
affect the other and this understanding is important in order to achieve good
cooperation to effectively deal with electronic waste problems.
Figure 2.1: Young et al. Manufacturing and the Environment (1997, Vol 13, No.7, p.488).
2.3
Electronic Waste in Other Countries
Electronic waste is a growing problem and this is not only happening in Singapore
but in other countries as well. In the United States (US), electronic wastes are the
[image:18.595.144.515.353.594.2]obsolescence of electronic products. In the year 2004 to 2005, it had grown by
almost 8 % even when the overall municipal waste stream volume is declining,
according to the Environmental Protection Agency (EPA), US. The EPA also
estimates that 2.63 million tons of electronic wastes are generated in the US in the
year 2005. Of this quantity, only 12.5 % was collected for recycling and the
remaining 87.5 % went to landfills and incinerators. It was noted that these figures
have yet to include the millions of stockpiled televisions, PCs, monitors, etc, which
are stored in basements, garages and closets awaiting decisions by the owners.
In fact, technology company Hewlett-Packard (HP) carried out a research in 2005
and found that nearly three out of four American consumers have used or unwanted
electronics in their homes which they do not know how to dispose of. On the other
hand, environmental organisation, Earth 911 (earth911.org), estimates that United
States (US) will need to dispose, in 2007, 500 million obsolete computers that are
stored over the years. It was noted that collecting of used electronics can be very
difficult when there is little awareness among the consumers.
In Australia, electronic waste is also growing fast and it is more than three times
faster than general municipal waste according to the Australian Bureau of Statistics
(ABS), 2006. This is due to the fact that Australians are some of the highest users of
new technology internationally. Over 2.4 million PCs and more than 1 million
televisions are bought annually. ABS reported in the same year, in 2006, that
Australia is one of the top ten countries using information and communication
technology. It was ranked tenth in the world for spending per capital and fifth in the
world for spending as a percentage of gross domestic product. As observed, it is
therefore inevitable that electronic waste in high technology countries, like United
States (US) and Australia, is one of the fastest growing waste types.
As electronic waste grows, it is important that they are well managed and safely
processed. In United States (US), the Computer TakeBack Campaign (CTBC), US,
estimates that the 12 % of electronic wastes that are recycled in US are handled by
most firms which do not operate under strict controls and they acted irresponsibly.
Only valuable metals are removed from the wastes and the remaining scraps are
sent to incinerators and landfills. It was of concern to know that workers
dismantling these wastes are inadequately protected from harmful chemical
compounds which posed very negative health effects.
It has been reported that many recyclers are exploiting cheap labour by sending
electronic waste to developing countries like China, India and Pakistan for
disassembly and processing. The Basel Action Network and Silicon Valley Toxics
Coalition (cited by Marta and David 2006) estimated in a report in 2002 that as
much as 50 % to 80 % of the electronic waste collected for recycling in the west of
the United States was shipped to China. These wastes are being handled under
horrific conditions that harmed the workers, the people and the environment. In
Guiyu, China, the unwanted parts are thrown into former irrigation ditches, massive
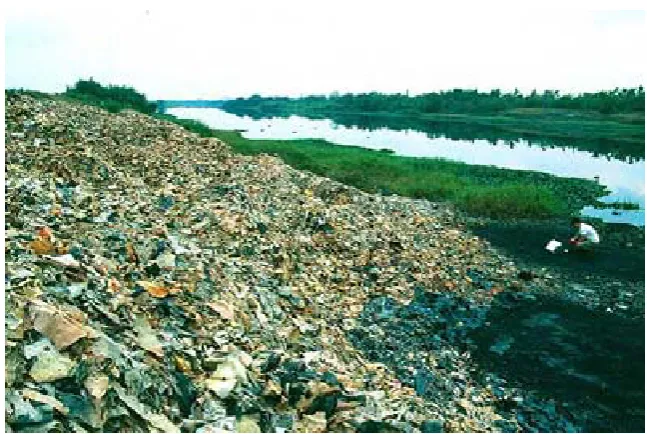
amounts are dumped along river ways and scraps are burned in open fires. Figure
2.2 shows an investigator of Basel Action Network taking a soil sample along a
riverside in Guiyu, China, where loads of electronic wastes are dumped.
Figure 2.2: An investigator taking a soil sample along a riverside in Guiyu, China.
As can be seen, shipping electronic wastes overseas will not be a solution if the
wastes are not properly processed in an environmentally sound manner. It is
certainly incorrect to pass the problem onto another country and in most cases the
poorer countries were at a disadvantage. It is also a serious concern that the workers
are harmed as improper protection was provided.
[image:20.595.165.489.391.608.2]CTBC also list the prison systems of the US as one of the problems of improper
handling of electronic wastes. The prisons are involved in electronics recycling
operations and there were inmate labourers who worked without much health and
safety protections. In recent years, complaints had brought these hidden sweatshops
into public view. As there were no proper recycling procedures, captive labourers
and staff supervisors were at a high risk of injuries. In 2005, Bureau of Prisons
(BOP) admitted in a report that prisoners and staffs in at least three recycling
factories were exposed to toxics.
As observed, there are indications of improper handling of electronic wastes in
different parts of the world. The improper processing harmed the workers and
subsequently the environment and the people. It is both important that safe
processing and safe disposal are carried out when dealing with electronic waste.
This applies the same to Singapore.
Electronic waste is difficult to manage due to its large volume and the cost of
managing it is always a concern for the governments, manufacturers and consumers.
CTBC noted that in the United States (US), public policy has failed to effectively
address the problems of electronic waste and many brand owners and manufacturers
in US are dodging responsibilities to manage their products after useful life. As a
result, the costs are passed onto taxpayers who are paying greatly to clean up the
wastes.
As observed, the cost of managing electronic waste should be properly addressed,
not only to avoid incurring a higher amount for cleaning up but more importantly to
effectively solve the problem. On the whole, it was observed that electronic waste
can be problematic and damaging. It is an important issue and should be properly
managed in all countries, including Singapore. This meant to collect and safely
recycle electronics to protect the environment.
2.4
The Benefits of Recycling
There are a few green ways to handle used electronics. They could be to upgrade,
refurbish, reuse and donate. If all options are not viable, it should be sent to recycle.
In fact, electronic wastes should be properly collected from different sources and
sent for recycling. Recycling of electronic waste is beneficial to the environment as
it helps to protect the environment from the toxins of the wastes as well as it saves
resources from depleting.
The recovery process is so good that precious metals like platinum, gold and silver
can be recovered! The Straits Times – Digital Life, Singapore (April 10, 2007),
reported that Nokia found that more than 90 % of a cell phone can be recycled. In
the course of the process, precious metals such as gold and platinum group of
metals (PGMs) can be extracted from the cell phone as well. This great benefit is
another encouraging reason to recycle electronic wastes. In fact, it has also helped
recycling companies to profit in the process.
The electronic wastes collected in the factories of recycling companies include
Integrated Circuit (IC) lead frames, copper laminates, Printed Circuit Boards
(PCBs), PCB trimmings, electronic components, computers, printers, laptops, cell
phones, televisions, etc. These consist of both consumers’ waste and electronic
waste generated by electronics companies in the course of their manufacturing
process. Figure 2.3 shows the copper laminates and IC lead frames that are
collected for recycling. The wide arrays of wastes collected are subsequently sent
for processing.
Figure 2.3: Copper laminate (left) and IC lead frames (right) collected for recycling.
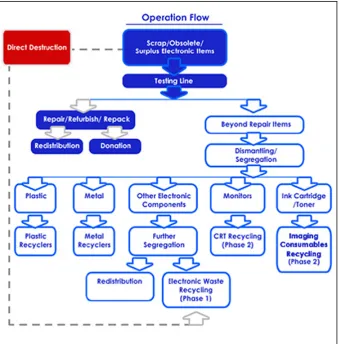
[image:22.595.195.463.624.724.2]Figure 2.4 shows a typical operational flow chart of an electronic waste recycling
company. At the factory, electronic products like computers and monitors are first
tested for their functionality. Options for repairing and refurbishing for reuse are
considered as they can be redistributed or donated to charitable organisations. If
they are beyond repair, they will be sent accordingly for dismantling, de-soldering
and segregation into different categories of products or materials for processing. It
was noted that as a usual practice, proprietary technological products are sent for
direct destruction.
Figure 2.4: Operational flow chart of recycling (CH E-Recycling Pte Ltd, 2007).
Electronic waste recycling uses filtration systems and chemical processes. Precious
metals, platinum group of metals (PGMs) and base metals can be recovered in the
process and they are separated accordingly. Precious metals that can be recovered
include platinum, palladium, gold, silver, copper, aluminium as well as other rare
metals. Processed metals are further refined and subsequently sent to smelting
[image:23.595.159.501.271.616.2]plants. PGMs requires further refining to be converted into by-products, such as
gold potassium cyanide, platinum and palladium targets and salts, which are sold
for reuse by the electronics industry. Figure 2.5 shows PGMs recovery and refining
at Cimelia Resource Recovery Pte Ltd.
Figure 2.5: PGMs recovery and refining (Cimelia Resource Recovery Pte Ltd, 2007).
As part of the recycling process, plastics from the cases of hardware are fed into
plastic recyclers. These plastics are shredded into pellets and sent to plastic
moulders. In general, electronic waste recycling includes cathode ray tubes,
assorted plastics, copper recovery, ferrous and non-ferrous metals. As CRTs in
monitors and television are leaded glass, a hazardous material, it needs to be
processed differently with special equipment. Recycling companies are able to
optimise granulated fibre and construction materials like bricks can be produced.
Figure 2.6 shows copper sand and bricks which are some of the materials produced.
Figure 2.6: Copper sand (left) and bricks (right) (CH E-Recycling Pte Ltd, 2007).
These days, electronic waste recycling companies engage technologies and
automations to carry out the recycling processes. Besides being efficient and
[image:24.595.233.425.188.294.2] [image:24.595.195.459.565.663.2]effective, this has helped to minimise workers’ exposure to hazardous substances.
Nevertheless, care should be taken at all times and personal protection is necessary
while handling these materials.
As observed, there are many benefits about electronic waste recycling. It protects
the environment, saves resources in which precious materials can also be recovered
and useful products can be produced. In fact, LEADOUT (cited in Marta and David
2006) reported that by using recycled materials it can saves as much as 60 % to 80
% of the energy used to produce the same virgin materials. It was also estimated
that recycling of electronic waste would make it possible to save approximately 2.8
million tons of oil equivalent per year.
2.5 Summary
Electronic waste is easily generated as people increasingly use electronic and
electrical equipment. Land filling them is not viable as they contain toxins that will
leach into the environment when buried. Incinerating them will produce poisonous
gases that pollute the air. Therefore, it is critical that these wastes are recycled.
There are various indications of electronic waste problems around the world and
they can be very damaging. Electronic waste is growing and therefore good waste
management is important to address the related concerns. This would require the
cooperation of the government, the manufacturers, the consumers and the recyclers
to effectively deal with the problems.
Electronic wastes are very hazardous and have to be handled with care even during
the course of recycling. Recycling electronic waste helps to protect the environment
as well as saves large amount of resources. On the whole, recycling of electronic
waste is certainly beneficial to all if carried out properly.
Chapter 3: Methodology
3.1 Introduction
In understanding the various problems of recycling of used electronics in Singapore,
research was done by reviewing available government and related companies
information. In an attempt to further understand the problem, case studies and a
survey were done. This helped to understand the industries’ workplace
environmental policies and also the consumers which in turn were useful to assess
the current practice and subsequent recommendations for improvements.
3.2 Goal
Definition
The goal definition of this particular project is to identify specific problem areas of
recycling of used electronics in Singapore and understand the related environmental
concerns. The results of the case studies and survey are to be used for identifying
opportunities for improving current Singaporean practice at a community level for
future handling of the issue. This included recommending good systems found in
other countries as well.
3.3 Scope
Definition
The method of research done to gain an understanding of the local situation was
through reviewing of available government information and statistical data.
Statistical data represents better and is useful for analysis. Area of research included
the related Singapore’s authorities and the major ones that were used in this
dissertation included the Ministry of the Environment and Water Resources, The
National Environmental Agency (NEA), Infocomm Development Authority of
Singapore (IDA), Statistics Singapore and Ministry of Manpower of Singapore
government, these few authorities have helped to establish an understanding of the
related concerns.
Research was also done on local recycling companies through reviewing
information available on the companies’ website and also from published articles on
the local newspapers. Major research done was on local electronic waste recycling
company Centillion Environment & Recycling Limited. Similarly, information
available by the recycling companies in Singapore was limited and there were no
specific data of the amount of electronic waste that were collected and processed or
incinerated. This proved difficult to accurately assess the situation to evaluate the
proportion of used electronics that are currently recycled.
In addition to studying the situation in Singapore, the area of research was extended
globally to the United States, Australia, Europe and Japan. This aimed to find good
systems that are used in other countries to deal with electronic waste problems and
to relate these systems to local situation.
The case studies were done to understand how companies in the local industry
managed their used electronic products. 2 manufacturing companies in the
electronics sector were studied. Although the understanding was aimed at electronic
products in general but in these 2 case studies only computers and printers were
considered. The scope was shrunk due to time and accessibility reasons. On the
other hand, instead of the whole company, only a department was studied in each
case. This was because the two companies are generally large and access to
information was difficult and time consuming.
In an attempt to better understand the problem of electronic waste recycling, a
survey of consumers was conducted in Singapore. This was to find out their
attitudes and behaviour and also included an understanding of workplace
environmental policies in Singapore. As surveying of industry people proved time
consuming and difficult, the scope was focused mainly on consumers in the
community. The work involved preparing a well structured set of questions to ask
for the various targeted area of understanding. The survey also aimed to determine
the extent to which consumers are involved now in recycling and would be willing
to be involved in the future. The initial target was to achieve about 100 responses
but was later lowered due to time constraint and 75 responses were successfully
received for analysis.
3.4
Assumptions Used in Case Studies
In the case studies, various assumptions were used mainly because specified data
were not available to analyse the company as a whole. Data collection was based
only on a department and only computers and printers were considered. The
different stages of obsolesce of electronic products in the companies also posed a
difficulty in understanding the situation as data for a limited period of time was
collected.
Chapter 4: Singapore’s Recycling
4.1 Introduction
This chapter introduces and understands the situation in Singapore and the related
issues that stress the importance of recycling in the country. The consumption of
electronic products in the domestic and export market are observed. Other related
factors leading to the generation of used electronics in the country are also
discussed. Finally, studies are made on the waste management data and the related
recycling rates.
As there is little amount of government information available, particularly on
electronic products and wastes, some broad data are used to understand the situation
and identify the problems and subsequent areas of improvement.
4.2 Singapore’s
Situation
Singapore is a city state with limited land space. The total land area is only 704.0
square kilometres and the total population in 2007 is 4.6806 million. This makes
Singapore the second most densely populated country in the world after Monaco.
Singapore’s population density per square kilometres is 6,369. As a land scarce
country with such a high population, management of land use is very crucial to stay
sustainable in the long term. Hence, land allocation for landfills is also very costly
to the country and its people.
The last landfill on the mainland at Lorong Halus is closed in April 1999. Semakau
Landfill, shown in figure 4.1, was developed to meet Singapore's need. It is a
manmade offshore landfill which cost S$610 million. The ground covers an area of
350 hectares and has a capacity of 63 million cubic metres. It was projected in 2006
by the National Environment Agency of Singapore (NEA) to have a remaining
lifespan of 35 to 40 years. This was not surprising considering the high population
and the volume of waste that will be generated increasingly over the years.
Figure 4.1: Singapore’s manmade offshore landfill - Semakau Landfill.
Taking into account that the current annual population growth which is at 4.4 % and
the high literacy rate of the population, it was expected that more people will be
engaged in using electronic products in their daily life. This would certainly lead to
the increase in the volume of used electronics. As the world gets more
interconnected, there will be an increasing need to engage in telecommunication
services. This will inevitably brought about the generation of used
telecommunication devices. One such major contributor to used electronics is the
cell phone. The number of mobile phone subscribers per 1,000 population in
Singapore is an amazing 1,034. If this relates to the same number of cell phones, it
will be a disturbing sign as the life span of cell phone is relatively short compared to
other electronic products. It can be seen how the various factors add to the
importance of waste management in Singapore. The mentioned statistics are
summarised in table 4.1.
Statistics
2007
Total population (‘000) 4,680.6
Annual population growth (%) 4.4
Land area (sq km) (For year 2006)
704.0
Population Density per sq km (For year 2006)
6,369
Literacy rate (%)
(among residents aged 15 yrs & over)
95.4
Mobile phone subscribers per 1,000 population 1,034
(Source: Statistics Singapore, 2007)
Table 4.1: Singapore’s annual statistics, 2007.
[image:30.595.136.522.590.746.2]4.3
Factors Leading to Used Electronics Generation
Singapore’s manufacturing sector accounts for 20 % to 25 % of the country’s
economy. The manufacturing sector consists of Electronics, Chemicals, Precision
Engineering, Transport Engineering, General Manufacturing and Biomedical
Manufacturing. Among these industries, Electronics contributes the single largest
portion to the total industrial output. In 2005, it was a huge 35.8 %.
The following figure 4.2 is a chart by the Infocomm Development Authority of
Singapore (IDA). It shows the domestic revenue and the different market segments
from 2003 to 2006. IDA’s goal is to “cultivate a vibrant and competitive infocomm
industry in Singapore” and it oversees the infocomm technology development,
deployment and usage. IDA’s hardware segment products include computers,
printers, cell phones, modems, digital entertainment products, personal
communication accessories, mobile enhancement products, wireless networking
products, etc.
(Annual Survey on Infocomm Industry for 2006, IDA 2007, p.6)
Figure 4.2: Domestic market composition by market segment, 2003 – 2006 (IDA).
In 2006, the overall domestic market grew by 3.9 % but the hardware segment
contribution saw a fall of 4 %. The revenue of the hardware segment is S$4.59
[image:31.595.140.519.412.648.2]billion for 2005 and S$4.11 billion for 2006. This actual decrement in revenue
could mean that less hardware were sold in 2006. The difficulty here in
understanding the amount of products that were being consumed domestically is
that a fall in revenue does not necessarily corresponds to a fall in quantity and a fall
in quantity does not necessarily corresponds to a fall in mass. This is due to
different profit margins, costs and physical attributes of electronic products.
However, the overall growth of the domestic market indicates the activeness in the
industry. This might lead to more purchases of hardware for new setups or for
renewal purposes.
Assuming the short lifespan of these products to be 2 years, estimation could be
made that a large portion of the 29 % of the hardware segment sold in 2005 will see
a need to be disposed in 2007. On the other hand, it meant that in 2007, there might
be a rise in demand in the hardware segment. This has lead to a pattern of rise and
fall in demand being seen in the hardware segment, in figure 4.2, that a rise occurs
in alternate years, in 2003 and 2005, and therefore a fall occurs in 2004 and 2006.
(Annual Survey on Infocomm Industry for 2006, IDA 2007, p.6)
Figure 4.3: Export market composition by market segment, 2003 – 2006 (IDA).
In the above figure 4.3, the total export revenue of the infocomm industry is studied.
This is intended to gain some understanding of the relative potential amount of
[image:32.595.132.524.425.657.2]The export revenue has increased by 31.4 % in 2006 to reach S$28.98 billion from
S$22.06 billion in 2005. This growth was largely driven by the hardware segment,
which is observed to be the biggest contributor to the annual infocomm export
revenue since 2003. This expanding export in the hardware segment signifies the
potential increase in electronic wastes in the industry. Proper waste management
should be in place to take care of the wastes generated by the manufacturers in the
factories.
In the next portion of this section, the number of computers was gauged in the
households and the percentage of computer users for different age groups were
observed. This is to better understand the usage behaviour and the extent of usage
of computers among the resident population in Singapore. This information could
then be used as a guide to estimate the amount of used computers that will be
generated as a result. These used computers will eventually add onto the bulk of
electronic wastes. Annual surveys were done by IDA in Singapore. In 2006, the
data collection was done via face-to-face interviews conducted from October to
November. A total of 2,500 households and 2,810 individuals were interviewed.
[image:33.595.158.497.435.657.2](2006 Annual Survey on Infocomm Usage in Households and by Individuals, IDA 2007, p.2)
Figure 4.4: Home computer penetration in Singapore (IDA).
Figure 4.4 above shows the home computer penetration in Singapore. From the
survey, an estimated 78 % of the total households in Singapore had at least one
computer (desktop/laptop) at home in 2006. This is a 4 % increase from 2005 after
staying stagnant at 74 % for 3 years since 2003. Looking at the results over the
years, it is definite that the penetration rate will continue to rise, therefore indicating
an increased engagement in technological products.
The following figure 4.5 shows the results of the survey for the number of
computers in the households in Singapore. The chart shows a representation of 3
different categories, ‘no computers’, ‘1 computer’ and ‘2 or more computers’. As
for households with 2 or more computers, there was an increase by 10 percentage
points from 28 % in 2005 to 38 % in 2006. It is noted that the percentage of
households with 2 or more computers were increasing since year 2000 and the
largest annual increment was in 2006.
(2006 Annual Survey on Infocomm Usage in Households and by Individuals, IDA 2007, p.3)
Figure 4.5: Number of computers at home (IDA).
These days, a computer acts as a ‘main brain’ for almost all personal electronic
products ranging from MP3 players to sophisticated pocket PCs. Once an electronic
device is linked up, a computer can be used for data storing, viewing, downloading,
transferring, printing and editing. From this understanding, it is expected that an
increase in computers in the households will most likely indicate an increase in
other electronic products and computer peripherals that will eventually see more
used electronics originating from the domestic over the years.
[image:34.595.149.508.338.573.2]Next, the percentages of computer users for different age group were identified in
figure 4.6. There were 4 different age groups used in 2006. They were ‘10 to 14
years’, ‘15 to 59 years’, ‘60 years and above’ and lastly ‘15 years and above’ which
were represented in all other years as well. It is deduced from the survey that
computer usage is more common among the young. 85 % of the population aged 10
to 14 years is computer users, compared to 68 % for the 15 to 59 years age group
and 28% for the 60 years and above age group. This is because computers are used
in schools in modern education for students starting at a young age. On the whole,
the proportion of computer users aged 15 years and above remained at 65 % in 2006.
This figure will bound to increase as the years passed by based on the high
percentage of young computer users.
(2006 Annual Survey on Infocomm Usage in Households and by Individuals, IDA 2007, p.5)
Figure 4.6: Percentage of computer users (IDA).
A point of concern here is that elderly computer users might face a difficulty in
recycling when their computers have reached its end-of-life and needed to be
disposed. Various possible barriers to recycling could be the physical ability of the
elderly to move the heavy parts, the accessibility and the cost of recycling services.
If recycling proves difficult, the unwanted computers were usually left unattended
or stored at home. As seen, a rather significant 28 % among the elderly population,
60 years and above, are computer users. To achieve satisfactory waste management,
concerns for the elderly should be addressed in all areas.
[image:35.595.126.531.334.497.2]4.4 Waste
Management
The total amount of waste being disposed in Singapore had increased at an alarming
rate over the past 30 years. NEA categorised waste disposed as the sum of the total
waste incinerated and the total waste land-filled. Back in 1970, it was 1,300 tons a
day but by the year 2000, it had already gone up to 7,600 tons a day (Ministry of the
Environment and Water Resources). Finally, successful results of waste
management were seen in 2004 when the amount being disposed in a day fell to
6,795 tons (Ministry of the Environment and Water Resources). Even at this rate,
NEA estimates that a new incineration plant would be needed in every 5 to 7 years.
In addition, a 350 hectare landfill would be required in every 25 to 30 years.
Some calculations were made to understand the rate and comparisons were made to
the population growth. Due to limited available data, the amount being disposed in
a day in 2000 to 2003 is assumed to be constant at 7,600 tons, 0 % increment.
The overall increase in the amount being disposed in a day (1970 to 2003):
62 . 484 100 1300 1300 7600 = × ⎟ ⎠ ⎞ ⎜ ⎝ ⎛ −
% increase over 33 years
From Statistics Singapore, the population in 1970 is 2.0745 million and the
population in 2003 is 4.1861 million.
The overall increase in population (1970 to 2003):
79 . 101 100 0745 . 2 0745 . 2 1861 .
4 × =
⎟ ⎠ ⎞ ⎜ ⎝ ⎛ −
% increase over 33 years
15 . 2 100 1 100 100 79 . 101
33 × =
⎟⎟ ⎠ ⎞ ⎜⎜ ⎝ ⎛ − +
% increment in a year
By comparison, it is observed that from 1970 to 2003, the overall increase in
percentage in the amount being disposed in a day, 484.62 %, were far much higher
than the overall increase in percentage in the population, 101.79 %. This indicates
that there is a high possibility that the overall amount of waste disposed can be
reduced further, much more than the amount achieved in 2004. It is also noted that
the annual average percentage increase in population is much lower than the current
growth rate from 2006 to 2007, which is 4.4 %. This is a worrying prospect for the
country if waste management is unable to effectively reduce the amount of waste
disposed at a higher rate of population growth.
Table 4.2 shows NEA’s solid waste management over the past 3 years from 2004 to
2006. Firstly, the total waste generated is understood to be the sum of the total
waste recycled, total waste incinerated and total waste land-filled (as defined in
point 1 of table 4.2). Secondly, as in the earlier portion of this section, waste
disposed is categorised as the sum of the total waste incinerated and the total waste
land-filled. Some calculations were made to understand these 2 terms.
Total waste generated in 2006:
2.66 (total waste recycled) + 2.33 (total waste incinerated)
+ 0.23 (total waste land-filled) = 5.22 million tons
Total waste disposed in 2004:
1.41 (total domestic waste disposed)
+ 1.07 (total non-domestic waste disposed) = 2.48 million tons
is equal to:
2.26 (total waste incinerated)
+ 0.22 (total waste land-filled) = 2.48 million tons
Total waste disposed in 2004 in a day:
6795 365
10 48 .
2 × 6 =
tons (as stated in the earlier portion of this section)
From table 4.2, it is observed that the total non-domestic waste disposed had
increased from 1.07 million tons in 2004 to 1.13 million tons in 2005. However, this
figure dropped in 2006 to 1.10 million tons. Looking at the total domestic waste
disposed, the figure had stayed constant at 1.41 million tons in 2005 but rose to 1.46
million tons in 2006. The total waste disposed for both domestic and non-domestic
had actually increased over the 3 years from 2.48 million tons in 2004 to 2.54
million tons in 2005 (2.42 % increase) and finally to 2.56 million tons in 2006 (0.79
% increase). This is a relatively small increase comparing with the total amount of
waste generated. However, it is discouraging as it is not long after some results
were seen in 2004 before the amount starts increasing again. This is not a good
indication of the waste management and it meant more should be done to lessen the
amount of waste incinerated and land-filled.
[image:38.595.145.511.223.616.2](Key Environmental Statistics 2007, Ministry of the Environment and Water Resources 2007, p.6)
Table 4.2: NEA’s solid waste management data for 2004, 2005 and 2006.
A more appropriate way to analyse waste management here is to use percentage
base on the overall waste generated for comparisons over the years. The actual
weight is useful in understanding the volume that goes to the incineration plants and
landfill such that concerns like the sustainability of these facilities could be
analysed. In 2005, the total waste incinerated has dropped from 47 % in 2004 to 45
%. In contrast, the actual physical weight of the total waste incinerated has actually
grown from 2.26 million tons in 2004 to 2.27 million tons in 2005. This is due to
the total waste generated that saw a rise over the years. The percentage of total
waste incinerated stood stagnant at 45 % in 2006. Again, the actual physical weight
is noted to have increased to 2.33 million tons.
The total waste generated has increased from 4.79 million tons in 2004 to 5.01
million tons in 2005, a 4.6 % increase. In 2006, the figure has gone up by 4.2 % to
5.22 million tons. These percentage increases are very much in line with the 4.4 %
population growth which indicates a rather acceptable amount of waste generation.
Another factor to be concerned with is the total waste land-filled. The total waste
land-filled has increased from 0.22 million tons in 2004 to 0.27 million tons in 2005.
A positive result is seen in 2006 when the figure fell to 0.23 million tons. This
meant that the projected life span of the landfill could be prolonged if wastes are
properly managed. Wastes that are land-filled consist of construction and
demolition waste, used slag and treated sludge but exclude incineration ash
generated from waste disposed through incineration (as defined in point 2 of table
4.2).
The ultimate focus of waste management is the total amount of waste recycled. The
amount of waste recycled will in turn affect the amount of waste incinerated and
land-filled. The essential process of recycling that forms the overall recycling rate
differentiates good waste management from bad ones. In 2004, the overall recycling
rate was 48 %. It has increased by 3 percentage points to 51 % in 2006. This is a
positive outcome. Although results were seen, it was felt that the situation is still not
considered comfortable. New estimates by NEA in 2007 still reflect the need for
additional incineration plants, only to be reduced from one in every 5 to 7 years to
one in every 7 to 10 years. If the total waste land-filled continues to fall at the rate
14.8 %, seen in 2005 to 2006, the projected life span of Semakau Landfill will be
increased from 25 - 30 years to 35 - 40 years, an approximated extension of 10
years.
In figure 4.7, the different waste streams and the amount recycled in 2005 are
shown on a chart. It is noted that an individual category for electronic waste is not
available here. As observed in the earlier chapters, the compositions of electronic
wastes are mainly metal, plastic and glass. Therefore, attention was placed on these
3 types of material so as to achieve an assumption of what amount of electronic
waste was recycled.
(The Singapore Green Plan 2012, Ministry of the Environment and Water Resources 2006, p.43)
Figure 4.7: NEA’s representation of recycling rates by waste streams in 2005.
As observed from figure 4.7, there are 2 categories of metal that are represented on
the chart. They are ferrous metal and non-ferrous metal. The overall amount of
ferrous metal that was recycled in 2005 is very high. This is the same case for
non-ferrous metal. However, the overall amount of plastic and glass that were recycled
in the same year is significantly small.
In another representation by NEA, for 2006, the recycling rates by waste streams
were put up on a table in table 4.3. The recycling rates for the different waste
streams were placed in descending order. These different waste streams make up
[image:40.595.125.539.215.524.2]the total waste generated in 2006. As observed from the table, ferrous and
non-ferrous metal were among the top few materials with high recycling rates that are
over 80 %. It is expected that the amount of plastic and glass recycled in 2006
remained significantly low. Table 4.3 shows the rate to be 12 % for plastics and 10
% for glass. This meant that a major portion of the waste were incinerated or
otherwise land-filled.
(Key Environmental Statistics 2007, Ministry of the Environment and Water Resources 2007, p.7)
Table 4.3: NEA’s representation of waste stream data for the year 2006.
The lack of available government information posed a difficulty here to understand
the source of generation of the waste streams, particularly if they were from
electronic wastes and if they were generated domestically or non-domestically. It
therefore also fails to indicate if there is a problem in managing used electronics
either in the industries or with the domestic. This can be important for proper
management of electronic wastes especially when it is almost certain that electronic
wastes will continue to rise through the years. Nevertheless, the significantly low
recycling rates of plastic and glass clearly indicates that there is a lot more room for
improvement regardless of the source of waste generation.
[image:41.595.152.506.217.519.2]Another concern regarding good waste management is the controlling of the
possibility of exportation of used electronics. In 2003, Singapore’s neighbour,
Indonesia banned the import of used electrical and electronic products to protect
their local industry and their environment. This has caused a fall in businesses in
Singapore for the used electronic goods dealers as shipping to a further poor
country in the region might not be as profitable. Although business opportunities
through exportation are limited, it does not mean that export of used electronic
products is forbidden in Singapore.
4.5 Conclusions
Various factors are pointing to the inevitable increase in electronic wastes in the
industry and society as Singapore progresses with the world. Singapore’s constraint
of a densely populated, highly urbanised city with limited land space makes proper
waste management an imperative. More importantly, electronic wastes are harmful
and they require proper disposal.
Although there is a good representation of recycling rates for different waste
streams but there is not any tabulated figure for electronic wastes with the
government. This might meant a lack of emphasis in NEA and likewise for the
community. In a world that the importance of recycling of electronic wastes is
gaining awareness, a separate set of data for electronic wastes should be available
with NEA for monitoring the management in Singapore. This would be useful to
effectively deal with concerns of electronic wastes ranging from possible
exportation to assisting the elderly properly dispose their unwanted electronic
products.
Chapter 5: The Process of Recycling in Singapore
5.1 Introduction
This chapter understands the collection of used electronics in the country and the
related problems are identified and discussed. This included an understanding on
the current extent of involvement by the government, the manufacturers and the
recycling companies.
Electronic waste recycling companies and their recycling processes are observed
and discussed. This generally provides an understanding on the technologies used
and the effectiveness of the processes. And finally, conclusions are made of the
current situation and subsequent recommendations for improvements are also
suggested.
5.2
The Collection of Used Electronics
The generation of electronic wastes can be from all sources in the country. This
meant that not only companies in the electronics sector but all other companies
including those in the industrial areas, in the business districts and even those in the
neighbourhoods are possible generators of electronic wastes. It was noted that
internet cafes which are increasingly common in neighbourhoods are capable of
generating large amount of waste computers.
Besides generation from companies, electronic waste also comes from organisations
like hospitals, institutions, as well as charities. These basically include medical
equipment, computers and non-working electronic products that were donated to the
charities. In addition, households are a large source of electronic wastes as a wide
range of electrical and electronic equipment is use by the residents. It is therefore
important that all sources of electronic wastes are properly disposed and collected
for recycling.
Companies that require disposal of electronic products can either send them to the
recycling companies or request for collections. There is a list of electronic waste
recycling companies available on National Environment Agency’s (NEA) website
and these companies accept a wide range of electronic products. Among the 8
companies listed, 3 indicated that they provide collection services and 1 stated that
their company does it on contractual basis. It was observed that the number of
recycling companies in Singapore is not a lot and only half of these companies
provide collection services. Moreover, those that do collect electronic waste only
provide their services for commercial and industrial areas and fees are charged
accordingly. On the whole, based on the circumstances, it was observed that the
responsibility in ensuring proper disposals of electronic waste lies mainly on the
companies and the various organisations.
On the other hand, residents as consumers can contact the Town Council for
removal services of bulky electrical and electronic items from their households.
There is also a list available on NEA’s website that the residents may contact for
their unwanted electronic products to be collected for reuse or recycling through
various companies. There are a total of 19 companies listed. It was noted that these
are not recycling companies but rather service providers as collectors and traders of
used electrical and electronic equipment. These service providers do not charge a
fee to collect. Moreover, reimbursements are done according to items and there are
also companies who do not set a minimum quantity to provide collection services. It
was observed that, on overall, the assistance and services provided for the residents
to dispose electronic waste for recycling or reuse are much better than those
provided for companies and they are generally adequate.
However, it was noted to be a problem that information is only available on the
internet and there were little publicity about collection of electronic waste from the
households. It was thought and expected that most residents would not search for
recycling avenues on the internet prior to disposing of their electronic wastes. And
one would probably do when he or she is an environmentally conscious consumer
who is committed to protect the environment. This lead to the understanding of
consumers’ awareness, on the harmful effects of electronic waste and also the
benefits of recycling of these wastes, could be the key to achieve high recycling
outcome. Conversely, it meant that in this case, where much reliance is on the
residents to source for green avenues for disposals, would most likely result in
residents’ unawareness or feeling it to be a hassle which would eventually, create
large amount of improper disposals of unwanted electronics.
In Singapore, there are also rag-and-bone men, junk dealers, who go around the
neighbourhoods to do collections from door to door of old items and offering little
amount of money in return. The items that they collect include used electrical and
electronic equipment but only functional ones are accepted. These collections are
subsequently sold to second hand dealers. Generally, used electronic goods dealers
place their products to be sold in the local second hand market. There are some who
does dismantling of used electronics as well and subsequently selling the parts to
recycling companies.
The practices of the rag-and-bone men was considered to be not beneficial to the
situation as only functional electronics would be collected. In fact, most consumers
who have unwanted electronics, which are still useful, would normally sell them
directly to second hand dealers like Cash Converters or advertise them on the
internet to sell to other users which in these ways will fetch them a better price.
Usually, only the older functional electronics get sold to the rag-and-bone men by
the residents. It can be seen that the presence of the rag-and-bone men does
practically no help to deal with electronic wastes generated by residents.
Residents and companies can also donate to charitable organisations used electronic
products. One of these organisations is The Salvation Army (SA). SA accepts all
kinds of electronics including spare parts as donations. Donors can drop their
unwanted items at SA’s donation bins and there will usually be a large amount of
non-functional electrical and electronic items that are collected. SA subsequently
sorts out the non-functional devices and sends them for recycling. Useful items
which are in functional conditions are resold at inexpensive costs at Red Shield
Industries (RSI) Family Thrift Stores and the proceeds are used to support SA’s
social and community activities. It can be seen that charities are capable of
generating large volumes of elect