INTRODUCTION
Organisms with high fecundities and high morta-lities of early life stages have the potential to exhibit temporal genetic variation. Adult populations may consist of a mixed structure built on an annual or seasonal basis due to heterogeneous recruitment (Hendry & Day 2005). When a given pattern of spa-tial variation is inconsistent over time, the inference of the genetic structure of the population may be inaccurate (Waples 1998). Many studies examining spatial differentiation assume temporal homogeneity and include sampling on just 1 occasion. Most genetic temporal studies of marine fish are based on the comparison of gene frequencies from 2 to 3 tem-poral samples, and few studies have involved sys-tematic surveys of several cohorts (Lenfant & Planes 2002). Hence, the inclusion of temporal sampling of
recruits may be an effective solution to elucidate population structure.
The term ‘chaotic genetic patchiness’ was introduced by Johnson & Black (1982) to describe unpatterned ge-netic heterogeneity among local populations on a small spatial scale. There is a consensus in most studies showing genetic patchiness on a microgeographical scale that such genetic heterogeneity is likely to result from temporal variation in the genetic composition of the recruits (Johnson & Black 1982, Hedgecock 1994, David et al. 1997, Li & Hedgecock 1998, Planes & Lenfant 2002). The unpredictability associated with re-production in the marine environment results in a large variance of the contribution of individuals to each co-hort. Under the hypothesis of ‘sweepstakes reproduc-tive success’ (Hedgecock 1994), chance events deter-mine which adults are successful in each spawning event. Many individuals fail to contribute to
recruit-© Inter-Research 2006 · www.int-res.com *Email: pujolar@biology.ucsc.edu
Genetic patchiness among recruits in the European
eel
Anguilla anguilla
J. M. Pujolar
1, 2,*, G. E. Maes
1, F. A. M. Volckaert
11Laboratory of Aquatic Ecology, Katholieke Universiteit Leuven, Ch. de Bériotstraat 32, 3000 Leuven, Belgium 2
Present address: Department of Ecology and Evolutionary Biology, Earth & Marine Sciences Building, University of California, Santa Cruz, California 95064, USA
ABSTRACT: Heterogeneity in genetic composition among recruits of marine species is mostly due to a large variance in reproductive success mediated by oceanographic processes. Temporal genetic varia-tion in a populavaria-tion of the European eel was quantified over 2 time scales among glass eel (1) inter-annual samples (cohorts), and (2) intra-inter-annual samples within cohorts (‘arrival waves’). A total of 789 glass eels comprising 11 different arrival waves were collected at Den Oever in The Netherlands over the period 2001 to 2003. All samples were screened for genetic variation using 10 allozyme and 6 micro-satellite loci. The main result from this study is the highly significant genetic differentiation among arrival waves, despite the low FSTvalues (FST = 0.0036). Heterogeneity in genetic composition was
observed both among cohorts and among samples within cohorts. Genetic differentiation partitioned within cohorts was more than 10-fold the differences among cohorts. Genetic heterogeneity is likely to result from a large variance in the contribution of individuals to each cohort determined by genetic drift. Although natural selection and gene flow could also play a role in the observed genetic pattern, we sug-gest that large variances in reproductive success are a contributing factor to the recruit differentiation. If only a subset of the adults contribute to the new recruits, effective population size in European eel might be much lower than the census size. A low effective population size combined with fluctuating oceanic conditions might have contributed to the current dramatic decline in abundance of European eel.
KEY WORDS: Allozymes · Arrival waves · European eel · Genetic patchiness · Microsatellites
ment, which results in (1) a reduction in the effective population size, and (2) changes in allele frequencies when differences in genetic composition are present among spawning groups. Hedgecock (1994) attributed the variation in reproductive success of adults to spatio-temporal variation in oceanographic conditions, occur-ring within and among seasons. In each generation, a small fraction of individuals replaces the entire popula-tion by a sweepstakes-chance matching of reproduc-tive activity with oceanic conditions linked to spawn-ing, fertilization, larval development and recruitment. The random variation in parental contribution to the next generation leads to the variation in genetic compo-sition of recruits observed in genetic patchiness.
There is growing evidence of temporal genetic het-erogeneity among recruits of marine organisms, attrib-utable to a large variance in reproductive success. Sev-eral studies on sea urchin populations revealed significant differences among recruit samples (Ed-mands et al. 1996, Moberg & Burton 2000). Li & Hedgecock (1998) reported temporal heterogeneity among larval samples in a Pacific oyster Crassostrea gigaspopulation, which appeared to reflect inter-fam-ily variance in reproductive success. In fish, Planes & Lenfant (2002) observed significant differentiation among and within cohorts in a white sea bream Diplo-dus sarguspopulation, with genetic relatedness data suggesting that temporal changes were due to large variance in parental success.
Alternatively, temporal variation among recruits may be the consequence of selection on larval popula-tions and a differential survival of genotypes after recruitment (Johnson & Black 1982). In such a situa-tion, genetic polymorphism often shows clines corre-lated with varying environmental factors such as tem-perature or salinity (Koehn et al. 1980, Larson & Julian 1999). Large-scale migration could be another factor leading to temporal variance in allele frequencies. Gene flow of larvae from different spawning popula-tions with variable allelic composition might generate temporal genetic heterogeneity (Kordos & Burton 1983, Ruzzante et al. 1996, Larson & Julian 1999).
The dependence of recruitment on oceanic condi-tions holds particularly true for the European eel (Anguilla anguilla L.; Anguillidae; Teleostei), a cata-dromous fish species with a particularly complex life cycle, which moves between marine and continental environments. After spawning in the Sargasso Sea, lar-vae (leptocephali) arrive on the European and North African shores following the Gulf Stream and North Atlantic Drift Current. Upon reaching the continental shelf, larvae metamorphose into glass eels and some move into freshwater systems. The arrival of glass eels occurs throughout the year in pulses or groups known as ‘arrival waves’ (Boëtius & Boëtius 1989, Tesch 2003).
After a period of intensive feeding of (on average) 7 to 8 yr for males and 11 yr for females, they metamor-phose into silver eels and migrate back to the Sargasso Sea, where they spawn once and die (Tesch 2003).
The long spawning migration, the mating and spawning process, the development of eggs and lar-vae, and the long migration of eel larvae are all under the influence of oceanic factors and climate variation. Large-scale environmental fluctuations of particular interest are the North Atlantic Oscillation (NAO) and the El Niño-Southern Oscillation (ENSO), which have been shown to affect both marine and terrestrial com-munities (Stenseth et al. 2002). In the case of eels, sig-nificant negative correlations have been determined between glass eel recruitment abundance and the NAO winter index (NAOI) for European and American eels, and the ENSO index for Japanese eel Anguilla japonica(Knights 2003).
Recruitment abundance of European eel has declined dramatically in recent decades, jeopardizing the future of the species (Dekker 2003). A better understanding of crucial aspects of its biology, includ-ing partitioninclud-ing of genetic stocks, may promote effec-tive measures to protect the species. Early genetic studies using allozyme and mitochondrial DNA mark-ers (reviewed in Dannewitz et al. 2005) reported no evidence of spatial substructuring, which supports the panmixia hypothesis, namely that all European eel comprise a single, randomly mating population. The existence of a single panmictic population was chal-lenged by evidence for a weak but significant popula-tion structure (Daemen et al. 2001, Wirth & Bernatchez 2001, Maes & Volckaert 2002), with both allozyme and microsatellite loci showing Isolation-by-Distance (IBD) pattern. The lack of temporal replication made it diffi-cult to test the stability of genetic structure over time in these studies. In this sense, Dannewitz et al. (2005) conducted the most extensive study to date on Euro-pean eel, with a total of 41 sampling sites, 12 of which included inter-annual samples. Overall genetic differ-entiation among samples was low, but highly signifi-cant and comparable to earlier studies. Nevertheless, hierarchical analyses revealed no geographical or IBD pattern, with temporal genetic variation within sites clearly exceeding the geographical component.
European eel by partitioning the amount of genetic dif-ferentiation into an inter- and intra-annual component. We also tested whether the variance in reproductive success was due mostly to random drift, gene flow or selective processes.
MATERIALS AND METHODS
A total of 789 glass eels were collected at Den Oever (52° 56’ 20” N, 05° 02’ 70” E) in The Nether-lands over the period 2001 to 2003. Samples con-sisted of 11 different arrival waves from 3 different cohorts: 2 arrival waves from 2001, 5 arrival waves from 2002 and 4 arrival waves from 2003. Table 1 details sampling date, sample size and morphometric characteristics of all samples, including length, weight and condition index.
All individuals were analyzed for allozyme variation using Cellulose Acetate Gel Electrophoresis (CAGE) (Harris & Hopkinson 1976, Richardson et al. 1986). Tis-sue extraction, electrophoresis and procedures for visualizing proteins, and buffer systems (Tris Glycine [TG] and Tris Malate [TM]) are described in Maes & Volckaert (2002). We examined 7 enzymatic systems: aspartate aminotransferase (AAT-1*, AAT-2*, AAT-3*, EC 2.6.1.1, TM), alcohol dehydrogenase (ADH*, EC 1.1.1.1, TG), glucose-6-phosphate isomerase (GPI-1*, GPI-2*, EC 5.3.1.9, TG), isocitrate dehydrogenase (IDHP*, EC 1.1.1.42, TM), malate dehydrogenase (MDH-2*, EC 1.1.1.37, TM), mannose-6-phosphate isomerase (MPI*, EC 5.3.1.8, TG) and phosphogluco-mutase (PGM*, EC 5.4.2.2, TG). Genetic nomenclature followed the suggestions of Shaklee et al. (1990). Allele assignment was carried out comparing the relative dis-tance with the most common allele (*100).
The same individuals analyzed with allozymes were screened for microsatellite variation, except for those
samples consisting of 100 individuals, in which a sub-sample of 60 individuals was used. DNA purification and PCR amplification are described in Pujolar et al. (2005). Genotypes were examined at 6 dinucleotide repeat microsatellite loci: Aan 01, Aan 03, Aan 05 (Daemen et al. 2001); Aro 063, Aro 095and Ang 151 (Wirth & Bernatchez 2001). PCR products were visual-ized on an automated sequencer (LICOR 4200), using a molecular ladder (Westburg) in order to quantify allele sizes. Fragment data were analyzed using Gene Ima-gIR version 4.03 (Scanalytics).
All individuals were measured for standard length (L, mm) and body weight (W, mg). Ricker’s (1975) condition index factor [CI = 1000(W/Lb)] was calculated for each
individual, where b is the slope from the log length-log weight regression for all samples. Differences in morphometric measures among inter- and intra-annual samples were tested by a nested ANOVA. Regression analyses (Spearman’s correlation) were performed between morphometric measures and the NAOI (from www.cgd.ucar.edu/cas/jhurrell/indices.html) and the Den Oever glass eel recruitment abundance index (DOI) (Dekker 2004). The NAOI was lagged by 1 yr to relate spring glass eel recruitment in 1 yr to oceanic data pertaining to the preceding year.
Within-sample genetic variation was assessed by observed (Ho) and expected (He) heterozygosity per
locus and level of polymorphism (P0.95) using
GE-NETIX version 4.05 (Belkhir et al. 2005) and allelic richness using FSTAT (Goudet 1995). A possible corre-lation between genetic variability (expected heterozy-gosity and allelic richness at allozyme and microsatel-lite loci) and the NAOI/DOI was tested using a regression analysis (Spearman’s correlation). Devia-tions from Hardy-Weinberg equilibrium, linkage dise-quilibrium, and differences in allele and genotype fre-quencies among samples were tested using GENEPOP version 3.4 (Raymond & Rousset 1995). Partitioning of genetic differentiation into an inter-and intra-annual component was per-formed using a hierarchical locus-by-locus AMOVA with 10 000 permuta-tions as implemented in ARLEQUIN version 2.001 (Schneider et al. 2000). Significance levels for multiple simulta-neous comparisons were adjusted using the sequential Bonferroni tech-nique (Rice 1989). Pairwise multilocus comparisons among samples were calculated by Cavalli-Sforza & Ed-wards’ (1967) chord distance and a multivariate ordination was conducted by multidimensional scaling (MDS) analysis using STATISTICA version 6.0 (StatSoft).
Sample Sampling date N L W CI
[image:3.612.60.359.588.723.2]Isolation by Time (IBT) was tested by correlating pairwise temporal distance (measured as the differ-ences in days among samples) versus Cavalli-Sforza & Edwards’ (1967) chord distance using a Mantel test (Mantel 1967) as implemented in GENETIX. Average relatedness of all individuals to each other (rxy) (Queller & Goodnight 1989) was calculated within samples at 6 microsatellite loci using the program IDENTIX (Belkhir et al. 2002). The significance of the values of relatedness was tested using 1000 permuta-tions of alleles among individuals to know the propor-tion of pair-wise relatedness values attributable to sig-nificant half-sib or full-sib relationships compared to random sharing of alleles. Regression analysis (Spear-man’s correlation) was performed between average relatedness and genetic variability estimators (ex-pected heterozygosity and allelic richness at micro-satellite loci) and the NAOI. All statistical analyses were performed in STATISTICA.
RESULTS
Morphometric data
Significant differences were found when comparing L and W of all samples of glass eel arrival waves in the 2001, 2002 and 2003 cohorts (Fig. 1). A nested ANOVA showed slightly larger differences in L among cohorts (p < 0.001) than among arrival waves within cohorts (p = 0.001). Highly significant differences were ob-served in W, both within and among cohorts (p < 0.001). The CI also showed significant differences within and among cohorts (p < 0.001). When compar-ing the 3 samples from 2002 and the 3 samples from 2003 with similar sampling dates, differences among cohorts exceeded differences within cohorts in L (among cohorts: p < 0.001; within cohorts p = 0.034) but not in W (among cohorts: p = 0.018; within cohorts: p < 0.001). All morphometric measures showed highly significant negative correlations with the NAOI (L: r = –0.153, p < 0.001; W: r = –0.477, p < 0.001; CI: r = –0.530, p < 0.001). The DOI showed a highly significant positive correlation with L (r = 0.480, p < 0.001) and W (r = 0.237, p < 0.001) but not with CI (r = 0.008, p = 0.822).
Allozyme data
The 7 enzymatic systems resolved were coded by 10 polymorphic loci. Overall tests for Hardy-Weinberg proportions with all polymorphic loci, and for linkage disequilibrium among all loci, showed no significant departures from expected values. Mean Hoand Heper
sample ranged from 0.123 (± 0.171) to 0.166 (± 0.173) and from 0.118 (± 0.151) to 0.161 (± 0.157), respectively. All loci were moderately polymorphic in all samples (P0.95 = 0.4 to 0.6), and allele richness per sample
ranged from 2.288 to 2.769. Differences in mean Ho
and He, P0.95 and allele richness among samples
were not statistically significant. Regression analysis showed significant negative correlations between the NAOI and He(r = –0.100; p = 0.005) and allelic richness
(r = –0.388; p < 0.001). The DOI was negatively corre-lated with He(r = –0.320; p < 0.001) but positively
cor-related with allelic richness (r = 0.057; p = 0.156). Genetic differentiation based on the distribution of allele frequencies over all samples was low (FST =
0.0009) and not significant (p = 0.094). Hierarchical ANOVA showed that differences among samples within cohorts (FSC = 0.0006) explained a larger
propor-tion of the total genetic variapropor-tion than differences among cohorts (FCT = 0.0003), although values were
not statistically significant. No correlation was
ob-80
78
76
74
72
70
68
66
64
400
345
290
235
180
Arrival Date
25 May 15 May 9 May 30 Apr 16 Apr
10 Apr 2 Apr
Length (mm)
W
e
[image:4.612.304.539.335.698.2]ight (mg)
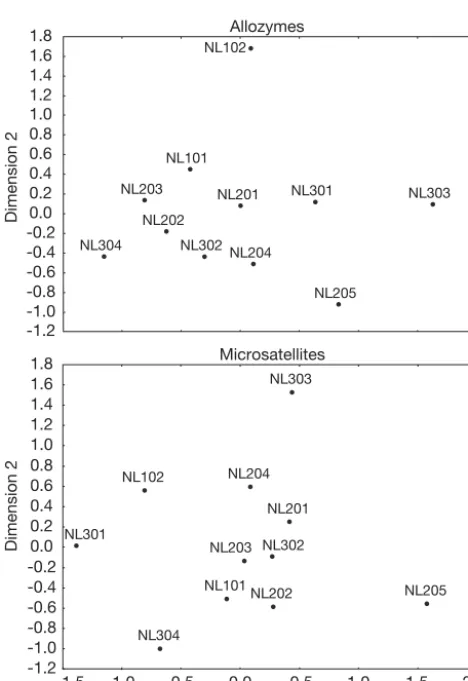
served between temporal distance and Cavalli-Sforza & Edwards’ (1967) chord distance (r = 0.238, p = 0.125). Within cohorts, a significant positive correlation be-tween temporal and genetic distance was observed in the 2002 cohort (r = 0.636, p = 0.048), while a negative correlation was observed in the 2003 cohort (r = –0.163, p = 0.758). The absence of a consistent IBT pattern was supported by MDS (Fig. 2), which did not show any clustering of temporal samples within cohorts. When comparing the 2002 and 2003 samples with similar sampling dates (NL201 vs. NL301, NL203 vs. NL302 and NL204 vs. NL303), only samples NL201 and NL301 (corresponding to 2–3 April) clustered together.
Microsatellite data
Only 2 out of 66 (3.33%) tests for Hardy-Weinberg equilibrium revealed significant deviations at the 5% significant level after sequential Bonferroni correction
(k = 11). Disequilibria were attributed to a deficit of heterozygotes at locus Aro095 in samples NL301 and NL302. Dannewitz et al. (2005) suggested that locus Aro095 showed evidence for null alleles, but the authors proved that null alleles did not affect the results obtained after repeating all analyses with and without this locus. Overall, tests for linkage disequilib-rium among all loci showed no significant departures from expected values. All 6 microsatellite loci were highly polymorphic in all samples. Hoand Heranged
from 0.659 (± 0.257) to 0.747 (± 0.250) and from 0.702 (± 0.314) to 0.747 (± 0.265), respectively. Allele richness per sample ranged from 10.160 to 11.115. Values of genetic variability (heterozygosities, P0.95 and allele
richness) were not statistically significant across sam-ples. Genetic variability was positively correlated with the NAOI (He: r = 0.226, p < 0.001; allelic richness: r =
0.053, p = 0.142) but negatively correlated with the DOI (He: r = –0.303, p < 0.001; allelic richness: r =
–0.204, p < 0.001).
Overall, genetic differentiation among samples was highly significant (p < 0.001), although the overall multilocus FST value was low (FST = 0.0036). Genetic
differentiation partitioned significantly among sam-ples within cohorts (FSC = 0.0033, p = 0.004), which was
about 10 times larger than the differentiation among cohorts (FCT = 0.0003, p = 0.603). Temporal distance
showed no correlation with genetic distance (r = 0.081, p = 0.556). Within cohorts, temporal and genetic dis-tance were positively correlated in 2002 (r = 0.435, p = 0.208) and negatively correlated in 2003 (r = –0.087, p = 0.870), although associations were not statistically significant. There was no evidence for temporal group-ing based on MDS on all samples (Fig. 2), and samples from different cohorts clustered together. When com-paring the 2002 and 2003 samples with similar sam-pling dates, only samples NL203 and NL302 (corre-sponding to 16–17 April) clustered together.
Average relatedness values over all individuals within each sample varied from –0.0468 to 0.0183 (Table 2). All samples showed low values of related-ness, although individuals with high values (rxy> 0.5) were observed in all samples. Within samples, the val-ues of genetic relatedness appeared significantly dif-ferent from zero for the NL202 sample, for the 2002 cohort (pooling all 2002 samples) and for all pooled samples. The 2002 and 2003 cohorts showed a similar pattern, with maximum and mean relatedness decreasing throughout the season. A highly significant negative correlation was observed between temporal distance (difference in days among samples) and max-imum relatedness in 2002 (r = –0.968, p = 0.006), which was not significant in 2003 (r = 0.590, p = 0.410). The association between temporal distance and mean relatedness was also negative but not significant (2002:
Allozymes
NL101 NL102
NL201
NL202 NL203
NL204
NL205 NL301
NL302
NL303
NL304
-1.2 -1.0 -0.8 -0.6 -0.4 -0.2 0.0 0.2 0.4 0.6 0.8 1.0 1.2 1.4 1.6 1.8
Microsatellites
NL101 NL102
NL201
NL202 NL203
NL204
NL205 NL301
NL302 NL303
NL304
-1.5 -1.0 -0.5 0.0 0.5 1.0 1.5 2.0
Dimension 1 -1.2
-1.0 -0.8 -0.6 -0.4 -0.2 0.0 0.2 0.4 0.6 0.8 1.0 1.2 1.4 1.6 1.8
Dimension 2
[image:5.612.56.290.330.671.2]Dimension 2
Fig. 2. Anguilla anguilla. Multidimensional scaling analysis of the matrix of pairwise Cavalli-Sforza & Edwards’ (1967) chord distance based on 10 allozyme and 6 microsatellite loci. Sample abbreviations as in Table 1. Stress: allozymes = 0.120;
r = –0.442, p = 0.457; 2003: r = –0.720, p = 0.280). A highly significant negative correlation was observed between average relatedness and He(r = –0.756; p <
0.001), which was negative but not significant between average relatedness and allelic richness (r = –0.005; p = 0.888). Genetic relatedness was negatively correlated with the NAOI (r = –0.296; p < 0.001) and positively correlated with the DOI (r = 0.027; p = 0.453).
DISCUSSION
Evidence for genetic patchiness among recruits
Temporal genetic variation in European eel was quantified by integrating 2 time scales: (1) among cohorts sampled over 3 consecutive yr, and (2) among arrival waves within cohorts. The fundamen-tal result is the highly significant genetic differen-tiation at microsatellite loci among arrival waves, despite the low FST values. Heterogeneity in genetic
composition was observed both among cohorts and among samples within cohorts. Nevertheless, genetic differentiation partitioned within cohorts was over 10-fold the differences among cohorts. Hierarchical FST and MDS described a pattern of genetic
patchi-ness among temporal samples, in which samples did not cluster either by cohort origin or arrival time within the year. In comparison with microsatellites, allozymes showed no significant genetic differenta-tion, although differences within cohorts were higher than differences among cohorts. It might be that allozyme variation is too low for allozymes to detect genetic differentiation.
Many studies attribute genetic patchiness on a small spatial scale to the annual recruitment of genetically variable cohorts within a site (reviewed in Planes & Lenfant 2002). Genetic patchiness among annual ar-rival waves mostly originates from a large variance in parental contribution. Due to the unpredictability of the oceanic environment, reproduction by marine species may be viewed as a sweepstakes event, in which not all but only a fraction of the adult population actually con-tributes to the next generation (Hedgecock 1994). The extent of how many and which individuals are success-ful is determined by chance. Hedgecock (1994) pro-posed that genetic patchiness reflects the family struc-ture of the larval pools. In our study, average genetic relatedness showed a similar pattern in all samples, which consisted of individuals with high values of relat-edness mixed with a large group of non-related individ-uals. The value of genetic relatedness for the 2002 co-hort and for the total samples appeared significantly different from zero, suggesting that at least some indi-viduals within or among arrival waves are related, even if the values of relatedness observed are far from the 0.5 value expected for full siblings. As a consequence of the catadromous life-history of the European eel, larval mixing may occur either after spawning in the Sargasso Sea or during the extensive larval migration to the Eu-ropean continental shelf, which explains the low mean relatedness observed for most samples. Maximum and mean relatedness decreased throughout the season in both the 2002 and 2003 cohorts, suggesting that arrival waves occurring late in the season are more mixed up and include a larger proportion of individuals from other spawning events. Mixing of individuals might be accentuated in the case of glass eel arrivals in northern Europe. Boëtius & Boëtius (1989) showed that eel larvae metamorphosing in northern Europe do not ascend im-mediately up rivers but are forced to stay offshore, where they are supposed to starve. In The Netherlands, this period has been estimated to last about 3 mo (De-saunay & Guérault 1997), which could increase the mixing of individuals before immigration into estuarine waters.
Oceanic influence on recruitment
Hedgecock (1994) attributed the large variance in reproductive success of adults to spatio-temporal vari-ation in oceanic conditions, occurring within and among seasons. Climate and oceanic processes influ-ence a range of ecological processes including larval survival, which depends on primary production, zoo-plankton bloom and current patterns at the oceanic scale (Hurrell et al. 2003). Interannual variation in lar-val survilar-val can be explained by the match between Sample rxy Max. rxy Min. rxy
NL101 –0.0395 (0.231) 0.950 –0.522 NL102 0.0183 (0.232) 0.905 –0.448 NL201 0.0181 (0.241) 0.944 –0.593 NL202 –0.0119 (0.238)** 1.000 –0.487 NL203 –0.0133 (0.218) 0.883 –0.448 NL204 –0.0251 (0.244) 0.720 –0.798 NL205 –0.0266 (0.231) 0.590 –0.443 NL301 0.0046 (0.242) 1.000 –0.798 NL302 –0.0308 (0.221) 0.619 –0.428 NL303 –0.0032 (0.274) 0.845 –0.887 NL304 –0.0468 (0.210) 0.652 –0.421 2001 cohort –0.0184 (0.230) 0.954 –0.548 2002 cohort –0.0232 (0.237)*** 1.000 –0.892 2003 cohort –0.0253 (0.242) 1.000 –0.915
[image:6.612.62.286.129.309.2]All cohorts –0.0240 (0.239)*** 1.000 –0.915 Table 2. Anguilla anguilla. Values of average relatedness (rxy) within samples including maximum and minimum re-latedness based on 6 microsatellite loci. Standard deviations
phytoplankton production and spawning timing. The strength of the match determines the quality of food available for larvae, and in turn the number of individ-uals that survive in a year-class (match-mismatch hypothesis; Cushing 1990). Alternatively, physical lar-val retention rather than production may explain recruitment variation as argued for the member-vagrant hypothesis (Sinclair 1988).
The NAO is a large-scale environmental fluctuation which has been shown to affect terrestrial and marine ecosystems (Stenseth et al. 2002). During a positive NAOI period, less plankton is available due to higher-than-average temperatures and a delay in primary production the following spring, which in turn results in a lower food availability for larvae (Hurrel et al. 2003). A positive NAOI period is also characterized by stronger oceanic winds and currents and an increase in the amount of storms (Stenseth et al. 2002), which have the potential to displace larvae from favorable environ-ments or retention zones. Following a positive NAOI period, a higher larval mortality would be expected due to either poor feeding conditions or changes in water circulation, which in turn would cause a lower recruitment. In marine ecosystems, the NAO has been linked to fluctuations in recruitment abundance for many species including the short-finned squid Illex illecebrosusin the northwest Atlantic Ocean and sev-eral fish stocks (cod Gadus morhua, herring Clupea harengus, capelin Mallotus villosus and sardine Sar-dina pilchardus) in the Barents Sea (Alheit & Hagen 1997, Dawe et al. 2000, Ottersen et al. 2001, Hjermann et al. 2004). Similarly, Knights (2003) reviewed a signif-icant negative correlation between the NAOI and the DOI. In the period 1960 to 1990, the length and number of glass eels immigrating to Den Oever followed a syn-chronized pattern, triggering considerable speculation that the decline of the European eel stocks was caused by oceanic climate. Nevertheless, after an all-time low in 1991 for abundance and length, both the NAOI and length recovered to average values, while abundance dropped to a new all-time low in 2001 (Dekker 2004). The latest recruitment information for the period 2002 to 2003 shows a return to the former pattern, with a decrease in the NAOI associated with a slight increase in both length and abundance (Dekker 2004). This is congruent with the significant correlations observed in our study among all size estimators (L, W and CI) and the DOI and NAOI.
The 2001 cohort (associated with the lowest DOI/highest NAOI) showed the lowest genetic vari-ability at allozymes and the largest variance in genetic variability at both allozyme and microsatellite loci. Similarly, the 2001 cohort showed the largest variance in genetic relatedness, so that sample NL101 pre-sented the overall lowest relatedness of all samples,
while sample NL102 presented the overall highest relatedness. It can be argued that a higher mortality in the larval phase following unfavorable oceanic condi-tions (after spawning in the Sargasso Sea or in the migration across the Atlantic Ocean) may cause a large variance in the number of individuals constituting each larval wave, which in turn could lead to a large vari-ance in genetic variability (depending on the larval wave size) and genetic relatedness (depending on the proportion of high- and low-related individuals elimi-nated). At the moment, although highly speculative, the DOI/NAOI link points to a direct (larval retention) or indirect (food availability) oceanic contribution to the genetic heterogeneity observed among recruits. Further validation is needed in the coming years to confirm the synchronicity of ocean climate, feeding conditions and recruitment abundance.
Alternative hypothesis
As pointed out in previous studies, together with a high variance in reproductive success, natural selec-tion and gene flow might account for the genetic het-erogeneity among recruits. Most likely, all 3 processes might play a role. In the case of natural selection, dif-ferent selective histories of the larval pools might explain differences in the genetic composition of recruits (David et al. 1997). In the case of eel larvae, the larval pool could be completely mixed and genetically homogeneous in the Sargasso Sea, and then spatially or temporally diverse selective forces could result in genetic differences among recruits. Under selection, genetic composition mostly shows clines in allele fre-quencies that parallel environmental gradients. This has been shown in the fruit fly Drosophila melanogaster, where latitudinal clines in allozyme fre-quencies at ADH and G6PDH provided evidence for temperature-derived selection (Oakeshott et al. 1982, 1983). In the blue mussel Mytilus edulis, an allele fre-quency cline at the LAP locus was observed between high and low salinity locations (Koehn et al. 1980). In fish, LDH in mummichog Fundulus heteroclitus showed a steep latitudinal cline along the Atlantic coast that appeared to result from natural selection and historical subdivision (Bernardi et al. 1993). Genetic polymorphism may also show homogeneity of allelic frequencies attributable to balancing selection, as sug-gested in oysters (Karl & Avise 1992) and Atlantic cod Gadus morhua(Pogson et al. 1995). Thus, the temporal genetic patchiness observed in a single European eel population, with recruit composition varying over time, seems to suggest a lack of consistent selection.
among recruits. Kordos & Burton (1993) reported a high genetic variation among annual blue crab Call-inectes sapidusrecruitments from the Texas coast. The observed homogeneity among winter samples con-trasted with a marked differentiation among summer samples from the same locations, which was explained in part from changes in larval-source populations caused by seasonal changes in oceanographic condi-tions. Flowers et al. (2002) argued that distinguishing between genetic patchiness due to gene flow among populations, or genetic drift within populations, is often impossible because the 2 processes occur simul-taneously in most marine species’ planktonic larval dispersal. The gene flow hypothesis implies the exis-tence of different source populations, which contra-dicts field observations of a single reproductive area for European eel (Tesch 2003).
Many populations are composed of a mixture of indi-viduals that reproduce at different times, which may of-ten be heritable (Hendry & Day 2005). Temporal assorta-tive mating may limit gene flow between early and late spawners, producing an IBT pattern. In our study, no sig-nificant correlation was observed by plotting pairwise genetic distance values against temporal distance mea-sured as difference in days between samples, suggesting that differentiation among arrival waves was not attrib-utable to an IBT pattern. Similarly, no IBT pattern was observed within cohorts, although an intra-annual IBT pattern would have been difficult to detect since the maximum difference between early and late arrival waves within a season was 2 mo. Failure to observe an IBT pattern does not preclude its existence on a broader geographical scale after correcting for spatial variation.
CONCLUSIONS
In summary, the pattern of temporal genetic patchi-ness observed among arrival waves in a population of European eel suggests that each arrival wave repre-sents an isolated reproductive event involving a restricted number of adults. Although natural selection and gene flow might also play a role, we suggest that large variance in reproductive success is a contributing factor to recruit differentiation. Our results corroborate previous observations on the mediating influence of oceanic conditions on eel population dynamics. A direct implication of our results is that a large variance in reproductive success can limit effective population numbers to fractions of actual abundances. If only a subset of the adults contribute to spawning, the effec-tive population size in European eel should be consid-erably lower than the census size. Using a Bayesian approach to infer demographic parameters from mi-crosatellite data, Wirth & Bernatchez (2003) suggested
a contemporary effective population size of about 5 × 10³ to 104 eels. Together with oceanic factors, a low
effective population size might have contributed to the current decline in the abundance of European eel. Fisheries management should integrate long-term monitoring of eel recruitment and adult catches with oceanic-climate studies. Replication of the current study on a broader geographical scale would allow us to shape the pattern of population structure reported. This example of genetic heterogeneity in European eel glass eels highlights the importance of studying early-life stages as a basis for understanding patterns of genetic variation in adults.
Acknowledgements.We thank the personnel at the Nether-lands Institute of Fisheries Research RIVO in IJmuiden for assistance with sampling and W. Dekker for providing glass eel recruitment abundance data. We thank X. Irigoyen for comments on the manuscript. Research was funded by the EU contract EELREP (Q5RS-2001-01836). J.M.P. received a post-doctoral fellowship from the Ministerio de Educación, Cultura y Deporte (Spain). G.E.M. received a PhD fellowship from the I.W.T. (Institute for the Promotion of Innovation by Science and Technology in Flanders).
LITERATURE CITED
Alheit J, Hagen E (1997) Long-term climate forcing of Euro-pean herring and sardine populations. Fish Oceanogr 6: 130–139
Belkhir K, Castric V, Bonhomme F (2002) IDENTIX, a soft-ware to test for relatedness using permutation methods. Mol Ecol Notes 2:611–614
Belkhir K, Borsa P, Goudet J, Bonhomme F (2005) GENETIX v 4.05, logiciel sous Windows pour la génétique des popula-tions. Laboratoire Génome et Populapopula-tions. CNRS UPR 9060, Université Montpellier II
Bernardi G, Sordino P, Powers DA (1993) Concordant mito-chondrial and nuclear DNA phylogenies for populations of the teleost fish Fundulus heteroclitus. Proc Natl Acad Sci USA 90:9271–9274
Boëtius I, Boëtius J (1989) Ascending elvers, Anguilla anguilla, from five European localities. Analyses of pig-mentation stages, condition, chemical composition and energy reserves. Dana 7:1–12
Cavalli-Sforza LL, Edwards AWF (1967) Phylogenetic analy-sis models and estimation procedures. Evolution 32: 550–570
Cushing DH (1990) Plankton production and year-class strength in fish populations: an update of the match/ mismatch hypothesis. Adv Mar Biol 26:249–293
Daemen E, Cross T, Ollevier F, Volckaert FAM (2001) Analy-sis of the genetic structure of European eel (Anguilla anguilla) using microsatellite DNA and mtDNA markers. Mar Biol 139:755–764
Dannewitz J, Maes GE, Johansson L, Wickström H, Volckaert FAM, Jarvi T (2005) Panmixia in the European eel: a mat-ter of time. Proc R Soc Lond B 272:1129–1137
Environmen-tal effect on recruitment of short-finned squid (Illex illece-brosus). ICES J Mar Sci 57:1002–1013
Dekker W (2003) Did lack of spawners cause the collapse of the European eel, Anguilla anguilla. Fish Manage Ecol 10: 365–376
Dekker W (2004) Slipping through our hands. Population dynamics of the European eel. PhD dissertation, Univer-sity of Amsterdam
Desaunay Y, Guérault D (1997) Seasonal and long-term changes in biometrics of eel larvae: a possible relationship between recruitment variation and North Atlantic ecosys-tem productivity. J Fish Biol 51:317–339
Edmands S, Moberg PE, Burton RS (1996) Allozyme and mito-chondrial DNA evidence of population subdivision in the purple sea urchin, Strongylocentrotus purpuratus. Mar Biol 126:443–450
Flowers JM, Schoeter SC, Burton RS (2002) The recruitment sweepstakes has many winners: genetic evidence from the sea urchin Strongylocentrotus purpuratus. Evolution 56:1445–1453
Goudet J (1995) FSTAT version 1.2: a computer program to calculate F-statistics. J Hered 86:485–486
Harris H, Hopkinson DA (1976) Handbook of enzyme elec-trophoresis in human genetics. North Holland Publishing, Oxford
Hedgecock D (1994) Does variance in reproductive success limit effective population sizes of marine organisms? In: Beaumont A (ed) Genetics and evolution of aquatic organ-isms. Chapman & Hall, London, p 122–134
Hendry AP, Day T (2005) Population structure attributable to reproductive time: isolation by time and adaptation by time. Mol Ecol 14:901–916
Hjermann DO, Stenseth NC, Ottersen G (2004) Indirect cli-matic forcing of the Barents Sea capelin: a cohort effect. Mar Ecol Prog Ser 273:229–238
Hurrell JW, Kushnir Y, Ottersen G, Visbeck J (2003) An overview of the North Atlantic Oscillation. In: Hurrell JW, Kushnir Y, Ottersen G, Visbeck J (eds) The North Atlantic oscillation: climatic significance and environmental impact. American Geophysical Union, Washington, DC, p 1–36 Johnson MS, Black R (1992) Chaotic patchiness in an
inter-tidal limpet, Siphonariasp. Mar Biol 70:157–164
Karl SA, Avise JC (1992) Balancing selection at allozyme loci in oysters: implications from nuclear RFLPs. Science 256: 100–102
Knights B (2003) A review of the possible impacts of long-term oceanic and climate changes and fishing mortality on recruitment of anguillid eels of the Northern Hemisphere. Sci Total Environ 310:237–244
Koehn RK, Newell RIE, Immerman F (1980) Maintenance of an aminopeptidase allele frequency cline by natural selec-tion. Proc Natl Acad Sci USA 77:5385–5389
Kordos LM, Burton RS (1993) Genetic differentiation of Texas Gulf Coast populations of the blue crab Callinectes sapidus. Mar Biol 117:227–233
Larson RJ, Julian RM (1999) Spatial and temporal genetic patchiness in marine populations and their implications for fisheries management. CalCOFI Rep 40:94–99 Lenfant P, Planes S (2002) Temporal genetic changes among
cohorts in a natural population of a marine fish, Diplodus sargus. Biol J Linn Soc 76:9–20
Li G, Hedgecock D (1998) Genetic heterogeneity, detected by PCR-SSCP, among samples of larval Pacific oysters ( Cras-sostrea gigas) supports the hypothesis of large variance in reproductive success. Can J Fish Aquat Sci 55:1025–1033 Maes GE, Volckaert FAM (2002) Clinal genetic variation and
isolation by distance in the European eel Anguilla anguilla. Biol J Linn Soc 77:509–522
Mantel N (1967) The detection of disease clustering and a generalized regression approach. Cancer Res 27:209–220 Moberg PE, Burton RS (2000) Genetic heterogeneity among adult and recruit red sea urchins, Strongylocentrotus fran-ciscanus. Mar Biol 136:773–784
Oakeshott JG, Gibson JB, Anderson PR, Knibb WR, Cham-bers GK (1982) Alcohol dehydrogenase and glycerol-3-phosphate dehydrogenase clines in Drosophila melano-gasteron different continents. Evolution 36:86–96 Oakeshott JG, Chambers GK, Gibson JB, Eanes WF,
Will-cocks DA (1983) Geographic variation in G6pd and Pgd
allele frequencies in Drosophila melanogaster. Heredity 50:67–72
Ottersen G, Planque B, Belgrano A, Post E, Reid PC, Stenseth NC (2001) Ecological effects of the North Atlantic Oscilla-tion. Oecologia 128:1–14
Planes S, Lenfant P (2002) Temporal change in the genetic structure between and within cohorts of a marine fish,
Diplodus sargus, induced by a large variance in individual reproductive success. Mol Ecol 11:1515–1524
Pogson GH, Mesa KA, Boutilier RG (1995) Genetic population structure and gene flow in the Atlantic cod Gadus morhua: a comparison of allozyme and nuclear RFLP loci. Genetics 139:375–385
Pujolar JM, Maes GE, Vancoillie C, Volckaert FAM (2005) Growth rate correlates to individual heterozygosity in European eel, Anguilla anguilla L. Evolution 59:189–199 Queller DC, Goodnight KF (1989) Estimating relatedness
using genetic markers. Evolution 43:258–275
Raymond M, Rousset F (1995) GENEPOP (version 1.2): popu-lation genetics software for exact tests and ecumenicism. J Hered 86:248–249
Rice WR (1989) Analyzing tables of statistical tests. Evolution 43:223–225
Richardson BJ, Baverstock PR, Adams M (1986) Allozyme electrophoresis: a handbook for animal systematics and populations studies. Academic Press, San Diego, CA Ricker WE (1975) Computation and uses of central trend lines.
Can J Zool 62:1897–1905
Ruzzante DE, Taggart CT, Cook D (1996) Spatial and tempo-ral variation in the genetic composition of a larval cod (Gadus morhua) aggregation: cohort contribution and genetic stability. Can J Fish Aquat Sci 53:2695–2705 Schneider S, Roessli D, Excoffier L (2000) ARLEQUIN: a
soft-ware for population genetics data analysis. Genetics and Biometry Lab, Department of Anthropology, University of Geneva, Geneva
Shaklee JB, Allendorf FW, Morizot DC, Whitt GS (1990) Gene Nomenclature for protein-coding loci in fish. Trans Am Fish Soc 119:2–15
Sinclair M (1988) Marine populations: an essay on population regulation and speciation. University of Washington Press, Seattle, WA
Stenseth NC, Mysterud A, Ottersen G, Hurrell JW, Chan K, Lima M (2002) Ecological effects of climate fluctuations. Science 297:1292–1296
Tesch FW (2003) The eel. Blackwell Science, Oxford Waples RS (1998) Separating the wheat from the chaff:
pat-terns of genetic differentiation in high gene flow species. J Hered 89:438–450
Wirth T, Bernatchez L (2001) Genetic evidence against pan-mixia in European eel. Nature 409:1037–1040
Wirth T, Bernatchez L (2003) Decline of north Atlantic eels: a fatal synergy? Proc R Soc Lond B 270:681–688
Editorial responsibility: Simon Archer (Contributing Editor), Guildford, UK


![Hexaaquacadmium(II) bis{4 [2 (4 hydroxyphenyl) 2 propyl]phenolate} dihydrate](data:image/gif;base64,R0lGODlhAQABAIAAAP///wAAACH5BAEAAAAALAAAAAABAAEAAAICRAEAOw==)