Economics of Solar Energy for Diurnal Electrical
Demand in South-East Queensland
Fouad Kamel
Faculty of Engineering & Surveying Electrical, Electronic & Computer Engineering
University of Southern Queensland Toowoomba, Queensland e-mail: kamel@usq.edu.au
Abstract The study presents a life-time cost analysis for a
combined solar system comprising a 1kW-peak grid-connected photovoltaic unit and an evacuated-tube solar water heater, 1.37
m2 collector area and a 120 Liter storage tank operated at
Toowoomba Queensland. The work represents technical and economic assessment of the technology at local conditions. Present solar kWh price indicate the ability of the system to provide competitive prices to cover demand peaks in Queensland. Additionally, the solar system – being located on site – offers the advantage of avoiding transmission and distribution losses throughout the electrical network.
Keywords Solar Energy, Electrical Energy Generation and
Distribution, Evacuated Tubes Solar Water Heaters, Peak Electrical Demand, Photovoltaic, Solar Water Heaters,
I. INTRODUCTION
Electricity resources and infrastructure, a backbone of the contemporary human societies and economy, is currently undergoing major stresses due to constantly increased demand. Those stresses are demonstrated in high spiking peak demands and electricity prices as shown in Fig. 1 and 2 [1]. Main reasons for those spikes might be referred back to increased energy demand in several sectors of the economy implying full reliance on electricity in most to all of the human needs especially in domestic usages.
Ref. [2] is describing electricity consumers pay significant (and largely unseen) price for building sufficient electricity generation and networks to meet the short peaks, which can occur for only a relatively small number of hours each year. More than 5% of the network infrastructure is only used for 0.2% of the time and this under-utilized capital investment in the network is paid for by all consumers, whether they ever use it or not, due to the nature of retail and networks charges.
Obviously, those stresses might be encountered by implementing well known energy-handling methods such as raising public awareness about the issue, demand side response DSR measures, utilization of diverse and on-site available renewable energy sources such as solar or wind energy, energy efficiency measures etc.
Electrical Energy Demand Queensland 14 May 2008
0 1000 2000 3000 4000 5000 6000 7000 8000 9000 10000
12:00:00 AM
3:00:00 AM
6:00:00 AM
9:00:00 AM
12:00:00 PM
3:00:00 PM
6:00:00 PM
9:00:00 PM
12:00:00 AM
De
m
a
nd (
M
W
)
0 10 20 30 40 50 60 70 80 90 100
E
n
er
g
y
P
ri
ce
($
/M
W
h
)
QLD Energy Demand Energy Price
[image:1.595.308.556.224.392.2]
Figure 1. Demand and Price of Electricity for 14 May 2009 Queensland [1]
Average peak price (7:00am to 10:00pm EST weekdays excluding NEM holidays) Qld 2008-09 $/MWh
0 50 100 150 200 250 300 350 400
May June July Aug Sept Oct Nov Dec Jan Feb Mar Apr May
Day from 22 May 2008 to 21 May 2009
$/
M
W
h
Figure 2. Fluctuation of Average regional peak price in Queensland [1].
[image:1.595.310.556.431.571.2]This research is presenting the economics of photovoltaic (PV) and solar water heaters (SWH) and the suitability for covering peak electrical demands in Queensland. Those technologies can only achieve effective contribution with conscious electric energy users realizing the importance of a renewable-energy-assisted electrical system.
II. SOLAR ENERGY TECHNOLOGIES USED
The research incorporates a 1 kW-peak grid-connected photovoltaic and an evacuated tube collector (ETC) solar water heater (SWH) for supplying user’s electrical and thermal demands respectively. The small SWH contains 20-tubes on an 1.37m2 aperture collector area fitted to a 120 liter water tank.
Grid-connected photovoltaic generators can effectively provide users with adequate electricity at solar day times, while at night and solar-weak times the user is withdrawing electricity from the utility distribution grid. Ref. [5] reported on photovoltaic power systems effective load carrying capacity (ELCC) as the amount of electricity PV can reliably supply as a proportion of its maximum output power. ELCC for PV is estimated to be 50-60% in Queensland. And [6] reported on economic impacts of PV embedded generation and residential air conditioning on electricity infrastructure, that I kW of air conditioning is estimated to impose a cost of $1,627 in infrastructure impacts, while 1 kW of PV is estimated to provide a benefit of $750 when installed in residential areas with an evening peak and $1,500 when installed in commercial and industrial areas with a mid-afternoon peak.
Solar Water Heating systems are efficiently capable of providing economically and environmentally viable and sustainable thermal energy. For the purpose of this research evacuated-tube collector (ETC) solar water heaters (SWH) are chosen to tackle thermal loads for domestic and industrial applications. As reported in [7], [8] and [9] ETC-SWH systems are best suited to provide thermal energy at relatively high temperatures 80-90 °C and elevated efficiency of 50–60 %.
III. SCOPEOFCOMBININGPHOTOVOLTAIC SYSTEMSWITHSOLARWATERHEATERS
Basic energy knowledge is indicating that whenever thermal energy is needed the best is to be provided by a prime energy source, e.g. a bio-fuel, fossil-fuel or thermal solar energy. In such cases reasonable conversion efficiencies e.g. 30-60% could be achieved. Electricity on the other side is considered a high-grade energy source because; its generation from fossil fuels for example, is usually accomplished at an efficiency of around 30%. It is then transmitted and distributed at a further 80% to reach the end-users at a final efficiency of 30 x 80 % = 24 %. This means it has already lost at least 76 % of the original value to reach the user in electric form instead of the thermal form. Transforming it back again into heat, at an efficiency around 50 %, makes the final transforming efficiency from heat back into heat of 24 x 50 % = 12 %. This means, throwing away around 88 % of the prime energy source such as oil, gas or coal. In other words, the economically and environmentally expensive fossil fuels get used at 12 % usage while 88 % get thrown away in form of thermal waste associated with all well known adverse implications. Therefore, it is advisable to consistently engage photovoltaic
systems with solar water heaters capable to supply thermal demands, in order to make sure photovoltaic electricity is being used specifically for electrical loads.
While grid-connected photovoltaic systems provide the ability of feeding end-users and the electrical network with solar electricity, solar water heaters provide the ability of supplying and storing thermal energy for heating and cooling purposes, otherwise produced by electricity. Thermally activated chillers using solar energy are an example of established technologies for domestic and commercial applications.
Although electricity is being typically used at present for heating water during low demand periods (at night), when electricity tariffs are low, solar water heaters are offering waiving considerable part of that demand at improved efficiencies and less environmental impact. The electrical capacity relieved could be directed to supply present peak demands at improved plant capacity factors, reduced energy prices and enhanced reliability. Modern energy management regimes and smart-grid techniques are providing tools for adjusting demands to avert peak periods.
IV. NET PRESENT VALUE, BENEFITS AND SYSTEM LIFE
-CYCLE ANALYSIS
The analysis describes the economic performance in a life-cycle analysis of a domestic solar system consisting of a 1 kW peak grid-connected photovoltaic (GC-PV) system feeding-in user’s electrical loads and exporting excess electricity to the grid and evacuated tube collector (ETC) solar water heater (SWH) covering hot water demand on user’s premises. Savings from the generated photovoltaic electricity and from the thermal energy produced by the SWH in kWh are deducted from total consumer’s energy demand and accounted to pay back the solar system. The study is based on operational data at Toowoomba Queensland; average solar irradiation of 2008 kWhm-2year-1. Fig. 3 shows the average monthly energy yield of the combined solar system. Impact of the installed solar system on energy consumption of an average domestic user is shown in Fig. 4.
Monthly average Energy Yield of Solar System at T oowoomba Qld
1kW p GC-PV and 1.37 m2 solar Thermal - Total 2718 (kW h/year)
0 50 100 150 200 250 300
E
n
e
rgy
Y
iel
d (
kW
h
)
GC-PV-ac (kWh) 147.2 128.3 134.3 115.0 102.6 100.0 103.3 125.9 140.0 135.6 131.2 142.0
Solar Thermal (kW h) 132.3 111.4 111.3 103.5 72.72 51.06 66.77 98.23 110.1 115.4 111.5 127.3
Total (kW h) 279.5 239.7 245.6 218.5 175.4 151.0 170.1 224.1 250.1 251.0 242.7 269.3
[image:2.595.307.559.514.654.2]Jan Feb Mar Apr May Jun Jul Aug Sep Oct Nov Dec
Electrical Energy Demand (kW h/year)
of Average One-Family House at T oowoomba Qld
4736 kW h Before and 2018 kW h after
-100 0 100 200 300 400 500 600 700 800 E ner gy D e mand ( kW h )
Demand Before (kW h) 282 271 265 305 655 745 702 454 319 230 229 279
Demand After (kW h) 2 31 19 87 480 594 532 230 69 -21 -14 10
Jan Feb Mar Apr May Jun Jul Aug Sep Oct Nov Dec
[image:3.595.40.287.52.192.2]Figure 4. Electric energy savings from the PV-SWH combined system.
Fig. 4 shows that such a simple solar system is able to strongly reduce electrical energy consumption of an average domestic user. The system demonstrates the ability to reverse electrical withdrawal, in solar-rich months, to export excess electricity to the supplier.
Lifecycle analysis has been used here as described by [10] to evaluate the payback time of the solar system. In this technique cost and benefits for each operational year are projected and then discounted back to the year of installation to obtain the "net present value NPV". Usually, the payback time is computed as the time at which first cost and annual expenses with compounded interest equal the total savings of energy cost with compounded interest. In the following the Net Present Value of lifetime system cost and benefit will be calculated and compared. Break-even conditions are satisfied when the system capital investment is exactly met by the savings or benefits generated over system lifetime.
[image:3.595.328.537.84.212.2]Market-available system cost has been used for this analysis as AUD$8,000 for the 1 kW peak grid-connected PV system and AUD$2,500 for the 1.37 m2 120 liter tank evacuated tube solar heater. Following assumptions have been made to calculate the Net Present Value of lifetime system cost and benefit: Interest rate 7% p.a., lifetime of the system 5-30 years, marginal tax bracket 0 % (no governmental subsidies), savings escalator 0.10, i.e. 10% p.a., operation, maintenance and insurance first year = 0.2% of invested capital and operation, maintenance and insurance increase = 5%/year.
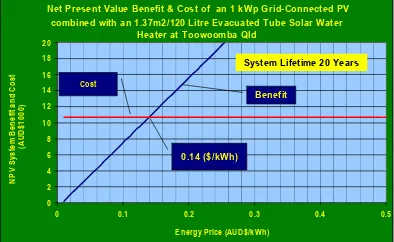
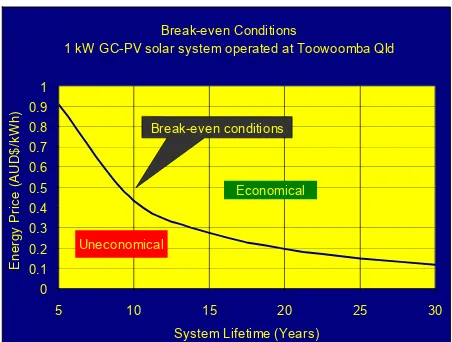
Fig. 5 - 10 show the results of the lifecycle cost analysis for the solar system at different energy prices for the combined system GC-PV operating alongside the evacuated tube SWH. The points of intersection between the system cost and benefits represent breakeven conditions at which the total system cost equal the total benefits generated by the system operation during its entire preset lifetime. Fig. 11 through 13 are summarizing breakeven conditions at different life-time options, from 5 to 30 years, for the combined GC-PV-thermal, the GC-PV-only and the SWH-only system respectively. The figures depict solar systems are paying back the investment at a certain energy cost and a preset system life-time. At market energy prices below that level the expected benefits are lower than the system cost and consequently, on just immediate economic considerations, the system might not be justified. At higher energy prices the economic benefits generated are
higher than the incurred cost i.e. the system is paying back itself before the expected lifetime.
Net Present Value Benefit & Cost of an 1 kW p G-C PV combined with an 1.37m2/120 Litre Evacuated Tube Solar W ater
Heater at Toowoomba Qld
0 2 4 6 8 10 12 14 16 18 20
0 0.1 0.2 0.3 0.4 0.5
Energy Price (AUD$/kW h)
N P V S y st em B e n e fi t a n d C o s t ( (A U D $1 00 0
) System Lifetime 5 Years
Benefit
[image:3.595.331.534.240.367.2]0.656 $/kWh) Cost
Figure 5. Cost and benefit 5 years life time.
Net Present Value Benefit & Cost of an 1 kWp Grid-Connected PV combined with an 1.37m2/120 Litre Evacuated Tube Solar Water
Heater at Toowoomba Qld
0 2 4 6 8 10 12 14 16 18 20
0 0.1 0.2 0.3 0.4 0.5
Energy Price (AUD$/kWh)
N P V S ys te m B e n efi t a n d C o st (A UD$ 1 00 0 )
System Lifetime 10 Years
0.314 ($/kWh)
[image:3.595.334.532.394.520.2]Cost Benefit
Figure 6. Cost and benefit 10 years life time.
Net Present Value Benefit & Cost of an 1 kWp G-C PV combined with an 1.37m2/120 Litre Evacuated Tube Solar Water
Heater at Toowoomba Qld
0 2 4 6 8 10 12 14 16 18 20
0.0 0.1 0.2 0.3 0.4 0.5
Energy Price (AUD$/kWh)
NPV Syst em B e nef it an d Cost (AUD $1000)
System Lifetime 15 Years
Benefit 0.197 ($/kWh) Cost
Figure 7. Cost and benefit 15 years life time.
Net Present Value Benefit & Cost of an 1 kWp Grid-Connected PV combined with an 1.37m2/120 Litre Evacuated Tube Solar Water
Heater at Toowoomba Qld
0 2 4 6 8 10 12 14 16 18 20
0 0.1 0.2 0.3 0.4 0.5
Energy Price (AUD$/kWh)
N P V S yst e m B en e fit an d C o st (A U D $10 00)
System Lifetime 20 Years
Benefit
0.14 ($/kWh) Cost
[image:3.595.334.531.546.667.2]Net Present Value Benefit & Cost of an 1 kWp Grid-Connected PV combined with an 1.37m2/120 Litre Evacuated Tube Solar Water Heater at
Toowoomba Qld
0 2 4 6 8 10 12 14 16 18 20
0 0.1 0.2 0.3 0.4 0.5
Energy Price (AUD$/kW h)
NP
V
S
yst
em
Ben
e
fi
t
an
d
Co
st
(A
UD
$10
00)
Benefit
0.106 ($/kWh)
System Lifetime 25 Years
[image:4.595.319.545.52.223.2]Cost
Figure 9. Cost and benefit 25 years life time.
Net Present Value Benefit & Cost of an 1 kWp Grid-Connected PV combined with an 1.37m2/120 Litre Evacuated Tube Solar Water Heater at
Toowoomba Qld
0 2 4 6 8 10 12 14 16 18 20
0 0.1 0.2 0.3 0.4 0.5
Energy Price (AUD$/kWh)
N
P
V
S
yst
em
B
a
n
e
fi
t an
d
C
o
st
(A
U
D
$1000)
System Lifetime 30 Years
Benefit
0.084 ($/kWh)
Cost
Figure 10. Cost and benefit 30 Y life time.
Break-even Conditions
1 kWp GC-PV & Evacuated Tube SWH combined solar system operated at Toowoomba Qld
0 0.1 0.2 0.3 0.4 0.5 0.6 0.7 0.8 0.9 1
5 10 15 20 25 30
System Lifetime (Years)
E
n
er
gy
Pr
ic
e (
A
U
D
$/k
W
h) Break-even conditions
Uneconomical
Economical
Figure 11. Break-even conditions of the 1 kW GC-PV operating alongside a 1.37m2/120 Litre evacuated tube SWH system.
Break-even Conditions
1 kW GC-PV solar system operated at Toowoomba Qld
0 0.1 0.2 0.3 0.4 0.5 0.6 0.7 0.8 0.9 1
5 10 15 20 25 30
System Lifetime (Years)
E
ner
gy P
ri
ce (
A
U
D
$
/k
W
h
)
Break-even conditions
Uneconomical
Economical
Figure 12. Break-even conditions of the 1 kW GC-PV system.
Break-even Conditions
1.37m2/120 Litre Evacuated Tube SW H at Toowoomba Qld
0 0.1 0.2 0.3 0.4 0.5 0.6 0.7 0.8 0.9 1
5 10 15 20 25 30
System Lifetime (Years)
En
er
g
y Pr
ic
e
(
A
UD$/
kW
h
)
Break-even conditions
Uneconomical
Economical
Figure 13. Break-even conditions of the 1.37m2/120 Litre evacuated tube SWH system.
V. DISCUSSION
The analysis demonstrate that the system consisting of just the solar water heater provides the shortest payback time and the lowest kWh cost compared to the two other alternatives, the combined system and the GC-PV-only system. However the combination of both the GC-PV with the SWH still gives economic advantages in terms of lower ¢/kWh and shorter payback time compared to the GC-PV-only system. Solar favorable locations are expected to show better economics with lower cost of energy and shorter payback time.
The cost of the produced energy can be calculated from the total present cost of the system divided by the total energy expected to be produced from the system over its lifetime. The payback time, in contrast, is calculated taking into consideration the total present cost of the system as well as the total revenues created from the system during its lifetime (discounted to the present). The point at which the cost equals the benefits is considered the break-even point as illustrated in Fig. 5 - 10.
[image:4.595.58.266.54.187.2] [image:4.595.59.265.204.340.2] [image:4.595.317.546.263.423.2] [image:4.595.58.267.377.528.2]utility grid and export excess energy feeding the electrical supplier.
A look at peak demand prices in Fig. 2 show an average of around AUD$40/MWh (4 ¢/kWh) wholesale price (transmission and distribution cost not yet included); peaks at times are exceeding AUD$400/MWh (40 ¢/kWh). Historical reports are indicating energy prices incidents of as high as AUD$6,622/MWh ($6.62/kWh) [11]. Fig. 11 shows the ability of the combined solar system to provide energy price at end-user premises of ¢14/kWh ($140/MWh) for 20 years life-time. Likewise, an electricity market energy price of about ¢20/kWh is able to make the system break even in just 15 years. The same readings could be made for the SWH-PV combined system in Fig. 12, and for the sole SWH Fig. 13. This indicates that solar systems are today already able to cover diurnal peak demands at competitive market prices. Base load is left to be covered by low-cost power plants throughout the year, since those are producing the most economic operation.
VI. CONCLUSIONS
The analysis presented in this paper describes the economics of a combined solar system including a grid-connected photovoltaic (GC-PV) unit covering electrical loads alongside a solar water heater system covering thermal loads. The results show such a system presenting realizable economic benefits at present equipment and energy prices. The calculations demonstrate a system consisting of just a solar water heater is providing the shortest payback time and the lowest cost per kWh compared to the two other alternatives, the combined system and the GC-PV-only system. Once the generated benefits over the system lifetime have exceeded the incurred cost the system would have paid itself back and start generating just benefits at little maintenance running cost. The higher the energy prices at the site of operation the higher the benefits and consequently the shorter the payback time. Solar systems at present prices indicate the technical and economic ability to reduce peak electrical demands on the national grid.
VII. REFERENCES
[1] AEMO: ‘Australian Energy Market Operator Price & Demand Data
Sets’, 2009
[2] EUAA: ‘Demand Side Response in the National Electricity Market Case Studies End-Use Customer Awareness Program’, Energy Users Association of Australia, 2005
[3] RET: ‘Energy White Paper, National Energy Policy - Framework 2030
Strategic Directions Paper’, Department of Resources, Energy and Tourism, Australian Government, 2009
[4] Kamel, F.: ‘SOLAR ENERGY TO MITIGATE ELECTRICAL
DIURNAL PEAK DEMAND IN QUEENSLAND’, ANZSES Solar 09, the annual conference , Townsville, Queensland, Australia 2009, 29th September – 2nd October 2009 pp. 10
[5] Mills, D.: ‘Photovoltaic Power Systems Effective Load Carrying
Capacity’, Discussion Paper presented at the PV Solar Future Workshop, Brisbane, hosted by Ergon Energy and the Queensland Environmental Protection Agency, 14 November 2008 Dr David Mills Sustainability Innovation Department of Environment and Resource Management, 2008
[6] Mills, D.: ‘Economic Impacts of PV Embedded Generation and
Residential Air Conditioning on Electricity Infrastructure’, Discussion Paper presented at the PV Solar Future Workshop, Brisbane, hosted by Ergon Ener, 2008
[7] Kamel, F.: ‘Assessment of domestic evacuated tube direct solar water heater’, Proceedings of the International Solar Energy Society Conference ISES 2001 – Bringing the Solar to the Earth, Adelaide, Australia 25 Nov–2 Dec. 2001 2001, pp. pp 6
[8] Kamel, F.: ‘Optimum operating temperature for evacuated tube solar
collectors’, ANZSES Solar Energy Conference Solar Harvest, Newcastle, Australia 25 Nov.–2 Dec. 2002, 2002;, pp. pp 6
[9] Kamel, F.: ‘Modelling and assessment of an experimental combined
evacuated-tubes-direct-flat-plate solar heater’, ANZSES Solar 2005:Renewable Energy for a Sustainable Future, 2005, pp. pp 7
[10] Mierzejewski, T.: ‘Analysis For Residential / Commercial Photovoltaic Systems Intertied With New Zealand Electricity Networks’, NZ Energy Efficiency and Conservation Authority 1998
![Figure 1. Demand and Price of Electricity for 14 May 2009 Queensland [1]](https://thumb-us.123doks.com/thumbv2/123dok_us/209548.56055/1.595.310.556.431.571/figure-demand-price-electricity-queensland.webp)