University of Southern Queensland
Faculty of Engineering and Surveying
A Comparison of DGPS Correction Sources in South
Eastern Queensland
A dissertation submitted by
Mr. David Gordon Rolph
In fulfilment of the requirements of
Bachelor of Spatial Science (Surveying)
ABSTRACT
University of Southern Queensland
Faculty of Engineering and Surveying
ENG4111 & ENG4112 Research Project
Limitations of Use
The Council of the University of Southern Queensland, its Faculty of Engineering and Surveying, and the staff of the University of Southern Queensland, do not accept any responsibility for the truth, accuracy or completeness of material contained within or associated with this dissertation.
Persons using all or any part of this material do so at their own risk, and not at the risk of the Council of the University of Southern Queensland, its Faculty of Engineering and Surveying or the Staff of the University of Southern Queensland.
This dissertation reports an educational exercise and has no purpose or validity beyond this exercise. The sole purpose of the course pair entitled "Research Project" is to contribute to the overall education within the student's chosen degree program. This document, the associated hardware, software, drawings and other material set out in the associated appendices should not be used for any other purpose: if they are used, it is entirely at the risk of the user.
Professor R Smith
Dean
Certification
I certify that the ideas, designs and experimental work, results, analysis and conclusions set out in this dissertation are entirely my own efforts, except where otherwise indicated and acknowledged.
I further certify that the work is original and has not been previously submitted for assessment in any other course or institution, except where specifically stated.
David Gordon Rolph
Student Number: Q10216081
___________________________
Signature
__________________________
ACKNOWLEDGEMENTS
I would like to thank the Department of Main Roads, and the Department of Natural Resources Mines and Water. Without the logistical support of the Department of Main Roads, and the data provided by the Department of Natural Resources Mines and Water this project would not have been possible.
I would also like to thank the staff at the University of Southern Queensland, in particular Mr. Glenn Campbell for providing some helpful advice.
Finally I would like to thank family and friends for providing support and advice for the duration of this research.
TABLE OF CONTENTS
ABSTRACT ...II
CERTIFICATION ... IV
ACKNOWLEDGEMENTS... V
TABLE OF CONTENTS... VI
LIST OF FIGURES ... IX
LIST OF TABLES ... IX
NOMENCLATURE AND ACRONYMNS... X
CHAPTER 1: INTRODUCTION... 1
1.0 BACKGROUND TO THE RESEARCH... 2
1.1 RESEARCH AIM... 2
1.2 RESEARCH OBJECTIVES... 2
1.3 SCOPE... 3
1.4 PROJECT LIMITATIONS... 4
1.5 SUMMARY... 4
CHAPTER 2: LITERATURE REVIEW... 6
2.0 INTRODUCTION... 7
2.1 DIFFERENTIAL GLOBAL POSITIONING SYSTEMS... 7
2.2 DGPSSYSTEM ARCHITECTURES... 7
2.3 DGPSCORRECTION SOURCES... 9
2.4 AUSTRALIAN MARITIME SAFETY AUTHORITY BEACON SERVICE... 10
2.5 OMNISTAR ... 12
2.6 VIRTUAL REFERENCE STATION DGPS ... 13
2.7 POST PROCESSED FROM SINGLE REFERENCE STATION... 14
2.8 POST PROCESSED FROM A VIRTUAL REFERENCE STATION... 15
2.9 PREVIOUS STUDIES INTO DGPSSYSTEMS... 15
2.10 PREVIOUS DGPSTESTING... 15
2.11 CONCLUSION... 17
CHAPTER 3: METHODOLOGY... 18
3.0 INTRODUCTION... 19
3.1 THE STUDY AREA... 19
3.2 THE CONTROL NETWORK... 20
3.5 DYNAMIC TEST EQUIPMENT... 24
3.6 DATA ACQUISITION... 27
3.7 STATIC DATA ACQUISITION... 27
3.8 DYNAMIC DATA ACQUISITION... 29
3.9 DATA FROM REFERENCE STATIONS FOR POST PROCESSING... 30
3.10 DATA PROCESSING... 31
3.11 DATA EXPORT... 32
3.12 PROCESSING DYNAMIC DATA... 32
3.13 CONCLUSION... 33
CHAPTER 4: RESULTS FROM OBSERVATIONS... 34
4.0 INTRODUCTION... 35
4.1 STATIC TESTS... 35
4.2 DYNAMIC TESTS... 36
4.3 THE PROPAGATION OF ERROR... 36
4.4 RESULTS OF STATISTICAL TESTS FOR STATIC SITUATIONS... 37
4.5 RESULTS OF STATISTICAL TESTS FOR DYNAMIC SITUATIONS... 38
4.6 DISTANCE FROM CORRECTION SOURCE... 38
4.7 CONCLUSION... 40
CHAPTER 5: DISCUSSION ... 42
5.0 INTRODUCTION... 43
5.1 STATIC RESULTS... 43
5.2 DYNAMIC RESULTS... 44
5.3 ACCURACY COMPARISON OF AMSABEACON AND OMNISTAR ... 46
5.4 DIFFERENCES BETWEEN REAL TIME DGPSCORRECTION SOURCES... 48
5.5 DIFFERENCES BETWEEN POST PROCESSED DGPSCORRECTION SOURCES... 48
5.6 COST VERSUS ACCURACY AND PRECISION OF REAL TIME DGPSCORRECTION SOURCES... 49
5.7 COST VERSUS ACCURACY AND PRECISION OF POST PROCESSED DGPS CORRECTION SOURCES... 50
5.8 DIFFERENCES IN ACCURACY FOR POST PROCESSED DATA AND REAL TIME DATA 51 5.9 THE OPTIMUM POST PROCESSED DGPSCORRECTION SOURCE... 51
5.10 CONCLUSION... 52
CHAPTER 6: CONCLUSION... 53
6.0 INTRODUCTION... 54
6.1 CONCLUSIONS... 54
6.2 RECOMMENDATIONS... 55
6.3 POSSIBLE FURTHER RESEARCH... 55
LIST OF REFERENCES ... 57
APPENDIX A. PROJECT SPECIFICATION ... 60
APPENDIX B. CONTROL MARKS... 62
APPENDIX C. GRAPHICAL RESULTS ... 97
APPENDIX D. STATIC DGPS RESULTS ... 99
LIST OF FIGURES
Figure 2.1: AMSA DGPS Service Coverage Map ... 11
Figure 2.2: Coverage Map of OmniSTAR DGPS System ... 12
Figure 2.3: Hardware & Software Architecture for the Queensland VRS system circa 2001... 14
Figure 3.1: Map of Test Area Showing VRS System Bounds and Test Site Bounds ... 20
Figure 3.2: Static Test Equipment ... 24
Figure 3.3: Dynamic Test Equipment ... 25
Figure 3.4: Dynamic Vehicle Mount... 26
Figure 3.5: User Installed Real Time GPS Reference Station... 27
Figure 3.6: 1 Static DGPS Data Acquisition at PM120502 ... 28
Figure 3.7: Dynamic DGPS testing at PM94371 at Ningi ... 30
Figure 4.1 Accuracy with Respect to Distance from Correction Source for Static Situations... 39
Figure 4.2 Precision with Respect to Distance from Correction Source for Static Situations... 40
Figure 5.1: Ranked Precision of Static Results ... 43
Figure 5.2: Ranked Accuracy of Static Results... 44
Figure 5.3: Ranked Precision of Dynamic Results ... 45
Figure 5.4: Ranked Accuracy of Dynamic Results ... 45
LIST OF TABLES
Table 3-1: Datum for Pro XRS GPS Receiver ... 28Table 3-2: GPS Receiver Settings ... 28
Table 3-3: GPS Reference Station Coordinates as used for Post Processing ... 32
Table 4-1: Precision & Accuracy of Different DGPS Correction Sources in Static Situations... 35
Table 4-2: Precision & Accuracy of Different DGPS Correction Sources in Dynamic Situations... 36
Table 4-3: Static DGPS Correction Sources Statistical Results... 38
Table 4-4: Dynamic DGPS Correction Sources Statistical Results ... 38
Table 5-1 OmniSTAR Suggested Correction ... 46
Table 5-2: AMSA Beacon Suggested Correction ... 48
Table 5-3: Costs for Accessing DGPS Real Time Correction Sources... 49
NOMENCLATURE AND ACRONYMNS
The following abbreviations have been used throughout the dissertation and appendices.
AMSA Australian Maritime Safety Authority DGPS Differential Global Positioning System
DMR Queensland Department of Main Roads
DNRM & W Queensland Department of Natural Resources Mines and Water GDA 94 Geocentric Datum of Australia 1994 Geographic Coordinates
from the 1994 adjustment/transformation
GPS Global Positioning System
ICSM Inter-governmental Committee of Surveying and Mapping ITRF International Terrestrial Reference Frame
ITRF2000 The 2000 ITRF adjustment/transformation Main Roads Queensland Department of Main Roads
MGA Map Grid of Australia
MGA94 UTM Map Grid Coordinates from GDA 94
MHz Megahertz
MSK Multiple Shift Keying
NEMA National Electrical Manufacturers Association PDOP Position Dilution of Precision
PM Permanent Mark
RINEX Receiver Independent Exchange Format
RTCM Radio Technical Commission for Maritime Services
RTK Real Time Kinematic (GPS)
SA Selective Availability
SCDB Survey Control Data Base
UTM Universal Transverse Mercator
USQ The University of Southern Queensland
USB Universal Serial Bus
WGS84 World Geodetic System 1984
"Throughout history the science of navigation has played an important role for humanity. Individuals who could reliably travel to and return from distant locations were successful, both militarily and commercially" (Williams, J. 1992).
1.0
Background to the Research
The above statement suggests that knowing one's position accurately has many benefits. The advent of the Global Positioning System and other similar positioning services for civilian use has revolutionised sectors reliant on accurate positioning. Relatively unskilled persons can now know their position to within a few metres with a hand held Global Positioning System (GPS) receiver worth a few hundred dollars or less.
However, more accurate and precise positioning is best achieved using Differential Global Positioning Systems (DGPS), which compares measurements at an unknown point to those at a known point. When spatial data needs to be referenced to a specific accuracy and precision, knowledge of the specifications and characteristics of all available DGPS service providers is essential, especially when different correction service providers become unavailable.
A testing regime was subsequently developed for the purposes of this research to assess the characteristics of several available DGPS correction sources. The accuracy and precision of the results were measured both in real time through a communication medium or post processed following data collection. In addition, other factors that may affect results were assessed, such as the distance from a reference station and the type of correction service being utilised.
1.1
Research Aim
The aim of this research is to compare the accuracy and precision of various DGPS correction sources available in south eastern Queensland to determine if the accuracy and precision of the correction source justifies its cost.
1.2 Research
Objectives
It also provides a comparison between the different correction sources to determine the best DGPS correction service to use depending on the user's requirements. Furthermore, it evaluates whether the cost of accessing the service reflects the accuracy and precision of the final results.
The research compares both the static and dynamic characteristics of the DGPS
correction sources. This is necessary as users will have requirements for both situations.
1.3 Scope
This dissertation document consists of an examination of existing theory, selection of test region, individual assessment of results, and comparison of results.
A review of existing literature relating to Differential Global Positioning Systems provides a background to the workings of DGPS systems and any limitations associated with their use. A critical appraisal of the expected characteristics and accuracy of different types of DGPS correction sources available in south eastern Queensland was then conducted. A review of previous research into the precision and accuracy of DGPS systems enables a comparison of results and a basis for confirming or extending existing theory.
The south eastern corner of Queensland is one of the fastest developing areas in
Australia and has a range of DGPS systems available to users. Together with the Survey Control Database (SCDB) maintained by the Department of Natural Resources Mines and Water (DNRM & W), a testing regime was designed to compare the results obtained from different DGPS correction sources within the south eastern corner of Queensland with the coordinates obtained from the SCDB providing a fixed reference. The control points allow for the comparison of results in relation to the position of the test site and distance to correction source or network.
Precision and accuracy estimates are available through the provided SCDB information (Appendix B) as truth for static positions, or in the case of dynamic testing, Real Time Kinematic (RTK) positions obtained from a dual frequency GPS rover as a truth for the DGPS results comparisons.
1.4 Project
Limitations
The scope of this study is defined by the following factors:
• DGPS correction source testing was only conducted over the south eastern Queensland test site as shown in Figure 3.1.
• The quality of the position data from the SCDB is defined as the Geocentric Datum of Australia coordinates of 1st Order, Class A as per the Standards and Practices for Control Surveys (SP1).
• Dynamic test quality is limited to the accuracy of RTK positions and the inherent problem of accuracy in cornering and latency of correction.
• When tested, the Virtual Reference Station (VRS) DGPS correction source was not available to users and corrections were provided especially for the purposes of this particular study.
• At the time of testing, the VRS system was not operating at its optimum capability as the base station at Beenleigh was inoperable.
• Comparisons were limited to only the tested DGPS correction sources.
• Only one DGPS capable receiver was tested. This project is not a comparison of the quality of GPS receivers.
This dissertation is written under the assumption that the reader possesses a basic knowledge of GPS theory and components.
1.5 Summary
This dissertation aims to compare and determine the accuracy and precision of sources of DGPS corrections available to users in south eastern Queensland. This was achieved using existing coordinated marks from the SCDB for truth in static situations, and a dual frequency RTK receiver for truth in dynamic situations.
The research provides a quantitative analysis of the accuracy and precision of the
in the south eastern Queensland test site. The assessment evaluated whether any type of correction source provided a superior result over others.
The outcome of this research provides a basis for users of DGPS corrections to determine the most suitable correction service based on their requirements.
2.0 Introduction
Chapter One described some of the DGPS correction sources available to users in south eastern Queensland, and raised the possibility that some corrections may be more effective than others in both precision and accuracy. The primary aim of DGPS is to provide the user with improved GPS positions by reducing known errors. Common correction sources must be investigated to determine the accuracy and precision of different DGPS correction sources.
This chapter provides this information by reviewing existing literature to establish the current body of knowledge about DGPS correction sources. It outlines the DGPS correction provider's claims on the performance statistics for their systems and the specifications of the equipment used to conduct analysis of these systems.
Existing test regimes are also reviewed to give an indication of the type and style of testing that has been undertaken before when testing DGPS correction sources.
2.1
Differential Global Positioning Systems
Differential GPS is a method of positioning that improves pseudorange accuracies. It works by using a second GPS receiver at a known position which measures
pseudoranges to all visible satellites. Simultaneously, a roving GPS receiver also measures the pseudoranges.
The roving receivers occupy unknown positions and receive corrections determined by a receiver at a known point. This receiver determines the corrective factors by
comparing measured pseudoranges to the coordinates of the occupied known point. These corrective factors are either communicated to the roving GPS receivers in real time by a radio link or other communication medium (real-time DGPS), or are stored to be applied at a later time (post processing). DGPS eliminates common errors such as atmospheric errors and satellite/receiver clock biases.
2.2
DGPS System Architectures
2.2.1 Single Reference Station Concept
A single reference station concept is where one reference receiver is used to record GPS signals. If used for real time, corrections require the following main components:
• GPS antenna/receiver
• A communication medium to the users (usually a radio link)
• Reference station software on a PC to perform monitoring
• DGPS data correction modelling
• Data archiving
For integrity, monitoring of the reference station usually consists of two independent GPS receivers to limit the possibility of system failure. The Australian Maritime Safety Authority (AMSA) Beacon service uses this type of system and is discussed further in Section 2.4. The observation errors are based on a single position and therefore are not modelled on a wider area. This limits the range of a single reference station DGPS to around 300 kilometres (Van Sickel, 2001).
For post processed applications the need for direct communication with the user is removed. This reduces the required components for DGPS application to:
• GPS antenna/receiver
• Reference Station Software on a PC to perform monitoring
• Data archiving
• This process is used in this research for determining the effects that distance may have on DGPS accuracies and precision.
2.2.2 Virtual Reference Station Network Concept
Another type of architecture is the virtual reference station concept (Retscher,2002).
This approach was also used for post processing data to determine the precision and accuracy delivered by this method. Through a virtual base generator, VRS systems are able to generate a virtual base file at the position of the roving receiver. This virtual file is then used for post processing DGPS applications.
2.2.3 Virtual Reference Cell Concept
Virtual reference cell concept is, in all major components, similar to the Virtual Reference Station Concept, except that a correction is supplied for a small cell area, rather than specifically at the rover's position. Correction models are not estimated for specific users location as in the virtual reference station concept. Rather, models are estimated for a given DGPS service area, which is usually a grid pattern. The roving receiver is assigned to a cell within this grid and there is no need for the virtual station to follow the movement of the roving receiver (Retscher, 2002). This approach is most common in wide area DGPS networks such as OmniSTAR.
2.3
DGPS Correction Sources
DGPS correction sources are available from three distinct areas:
2.3.1 Own Base Station
The user can establish a reference station to obtain differential corrections. It is a convenient way of obtaining differential corrections as it can be situated exactly where the user requires. It can be customised to provide the exact requirements of the user. The major problem with this option is the cost of purchasing an additional GPS receiver, associated software and hardware to establish this reference station. It may also be a problem if the user requires real-time corrections, rather than post processing, to obtain licenses to operate high power radio transmitters to provide data link to rovers, which may require a licence or other additional costs for communications.
2.3.2 Community Base Stations
2.3.3 Commercial Base Stations
Commercial DGPS providers offer DGPS services at a fee to the user. Usually they cover a wide area, and in the case where the user cannot afford the cost of purchasing and maintaining their own base station or only has a small amount to correct, this method is efficient. In most cases, the user is required to purchase a radio receiver and a subscription to the DGPS service provider. Examples of commercial DGPS correction providers are OmniSTAR and VRS DGPS service provided by the DNRM & W.
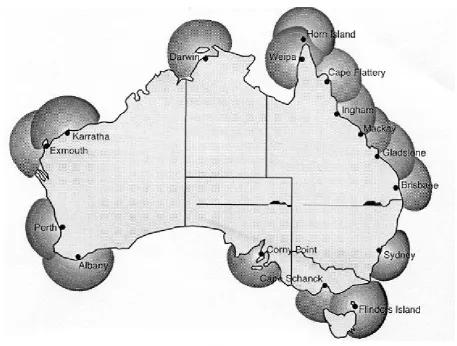
2.4
Australian Maritime Safety Authority Beacon Service
Figure 2.1: AMSA DGPS Service Coverage Map
(Source AMSA (1998))
The correction technique used by the AMSA Beacon service is known as a single reference station, as described in Section 2.2.1.
Corrections from AMSA's DGPS system are sent to the user via radio transmission in the band allocated for maritime radio navigation (AMSA, 1998). The data broadcast by the AMSA stations are in RTCM message format. Satellite corrections are only sent for satellites at an elevation of 5 degrees or greater and the maximum number of corrections sent is for a maximum of nine satellites.
According to AMSA (1998), with a fully operational GPS constellation the position accuracy of AMSA's DGPS service is required to be 10 metres or better with a 95% probability. Through AMSA's internal testing, before the elimination of selective availability, an accuracy of 5 metres or better with a 95% probability was being achieved (D'Amico, 2006).
180 watts. This AMSA Beacon transmits RTCM-104 messages. The Brisbane station occupies two reference locations: permanent marks 126400 and 126401.
2.5 OmniSTAR
OmniSTAR is a differential global positioning service that provides a continuous real time positioning for North America, Europe, Africa and the Australia – New Zealand regions. It primarily provides a correction service designed to deliver sub metre
[image:23.595.115.542.340.581.2]accuracies. It uses a wide area network of reference stations to calculate a correction for users based on their location within the network. This solution is weighted on the user's distance from the various reference station locations. The weighted corrections are combined to provide the user with the best solution from the reference network for their current position (OmniSTAR, 2006). This correction type is the reference cell type as discussed in Section 2.2.3. A map of OmniSTAR coverage is shown in Figure 2.2.
Figure 2.2: Coverage Map of OmniSTAR DGPS System
(Source Ganeshkumar (1999))
The OmniSTAR system comprises a network of approximately 100 reference stations located around the globe. Eleven of these reference stations are located within Australia, with the nearest to the test area being a reference station at Brisbane. A number of geostationary satellites provide the correction data to users through L-band frequencies, 1535.185 MHz is used at the southeast Queensland test area. Two global network control centres process all reference station's data and provide models for corrections that are provided to users. OmniSTAR (2006)and Ganeshkumar (1999) provide a full description of the OmniSTAR system.
2.6
Virtual Reference Station DGPS
The Virtual Reference Station is designed to provide high precision positioning over a large area, eliminating some of the problems associated with a single reference station. The system that is being utilised for DGPS correction services in this research is the VRS system operated by the Department of Natural Resources, Water and Mines covering the south eastern corner of Queensland. The VRS system involves
permanently running GPS reference stations, which allow a model of error corrections to be generated for a unique site. These corrections are then made available to roving receivers via GSM mobile phones. A map of the VRS system as configured at the time of testing is shown in Figure 3.1.
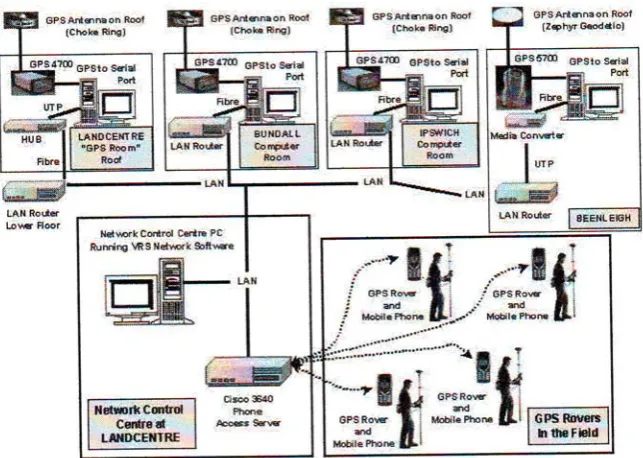
Figure 2.3: Hardware & Software Architecture for the Queensland VRS system circa 2001
(Source: Higgins (2001))
To generate a correction at the rover's position, a phone call is made to the central processing facility, where the rover supplies an approximate position and requests corrections for this position. The rover is then positioned relative to the corrections provided by this virtual reference station at the supplied approximate position. (Higgins, 2001)
As tested, the VRS system included reference stations at Robina (PM753291), Ipswich (PM753164), Caboolture (PM753292) and Woolloongabba (PM753166). There is a station at Beenleigh (PM753165). However this station was undergoing maintenance at the time of testing.
2.7
Post Processed from Single Reference Station
The research also looked into the accuracy and precision of post processed DGPS. This was provided by base stations either installed by the author, supplied by DNRM & W or by the University of Southern Queensland (USQ). Because of the variety of GPS
receivers used for reference, a common data format was needed to standardise the post processed correction data. Subsequently, a format called RINEX (Receiver
INdependent EXchange) was used to standardise the correction data.
correction determined by the base receiver to be common by the roving receiver(s). (Van Sickel, 2001)
2.8
Post Processed from a Virtual Reference Station
Post processing from a Virtual Reference Station is similar to post processing from a single reference station in all aspects, except that the base file is generated virtually from a networked virtual reference station system. This process is designed to eliminate the problems that distance from a correction source can cause. The virtual reference station is generated from archived data from a VRS system for given coordinates and time.
2.9
Previous Studies into DGPS Systems
Investigation of DGPS correction sources has revealed many test schemes used by previous researchers. Most researchers have only tested a single DGPS correction source operating in different conditions for accuracy and precision, and have not made comparisons of DGPS correction sources. In dynamic situations most researchers have utilised the use of designated test tracks to determine differences in DGPS results with control data.
2.10 Previous DGPS Testing
Ganeshkumar (1999) studied the accuracy of OmniSTAR DGPS in regard to a road centreline survey with different quality GPS receivers. This research examined the effects of speed on the final results obtained from the OmniSTAR DGPS systems. Testing was undertaken using a constant offset from a known centreline which was used to calculate the errors within the DGPS system.
monitor more satellites. It also revealed that the speed of the test vehicle did not affect the accuracy or precision of the final results the DGPS positions.
A study by Yoshimura and Hasegawa (2002) clarified the performance of Global Positioning Systems in forested areas after the discontinuation of selective availability using uncorrected GPS measurements and DGPS measurements. It determined the horizontal and vertical precision and accuracy under different operating conditions of visibility to satellites.
It found that while DGPS had been very effective in reducing the error caused by selective availability, it did not improve horizontal precision compared to uncorrected GPS results but did improve the horizontal accuracy.
The conclusion of this study was that obstructed observations to GPS satellites greatly affected precision, which was not overcome by the used of DGPS corrections. In addition, it was concluded that DGPS improved the horizontal accuracy.
Hale M. et. al (2006) assessed the performance of Victoria's VICpos system of DGPS corrections. VICpos consists of 12 networked reference stations providing DGPS correction to users.
It tested different grade survey controllers to determine accuracy of results obtained when using the VICpos DGPS system. Using a Trimble Geo XT GPS receiver with VICpos DGPS corrections, an accuracy of better than 1 metre was achieved. The
research also compared the results of different receivers using carrier wave observations and dual frequency observations. These comparisons will not be covered in this
research.
The control points for the test were established using results from one hour of static observations using a dual frequency GPS receiver, which was post-processed to form a network with the GPSnet reference stations.
This study also looked at the costs of operating a GPS receiver with DGPS corrections being received via a GSM mobile phone and the problems encountered with this style of receiving corrections.
2.11 Conclusion
This chapter has established the background of current knowledge with respect to DGPS correction sources. Specifically it noted the different types of DGPS correction sources, VRS DGPS, OmniSTAR, AMSA Beacon, and stand-alone reference stations. It established the two methods of applying DGPS correction sources as either being in real time or post processed.
It established DGPS architecture as being either single reference station, such as AMSA Beacon, virtual reference stations such as VRS DGPS, or virtual reference cells as used by OmniSTAR.
It discussed the errors that DGPS should remove from GPS measurements as being atmospheric and timing errors. Also established was the need to compare uncorrected GPS measurements with DGPS measurements as selective availability has been removed from the GPS system. This was a major error that DGPS corrected for.
3.0 Introduction
Chapter Two established the current state of theory with regard to the GPS systems, focusing on to DGPS correction sources and providers. It was recognised that the development of a regime of testing that would adequately evaluate the accuracy and precision of the selected DGPS correction sources was needed.
This chapter provides this guidance by outlining the test area, the source of the control data and the equipment used in data acquisition. It then continues to outline how this equipment was used to capture the data that was used to evaluate the selected DGPS correction sources over the test area in south eastern Queensland.
It provides an explanation of the processes of determining the results from these GPS measurements and the method of providing control coordinates for measurements.
3.1
The Study Area
The location of the study site was the south eastern section of Queensland, from the New South Wales Border in the south, Beerwah in the North and Minden to the west. It contains some of the fastest developing areas in Australia with large amounts of
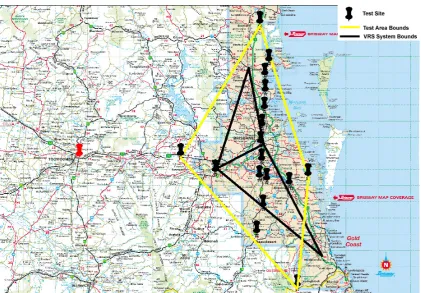
Figure 3.1: Map of Test Area Showing VRS System Bounds and Test Site Bounds
(Source: Edited, Brisway Maps(2005))
major consideration in this research was the comparison of different DGPS correction
3.2
The Control Network
orizontal control was provided by the SCDB that is maintained by the DNRM & W,
are
ontrol marks were chosen for their location in regard to the DGPS correction sources A
sources. This was a major reason for choosing this test site, as it has the only currently operating VRS system in Queensland as described in Section 2.6.
H
Queensland. This database is maintained in accordance with the standards set out in the
Standards and Practices for Control Surveys Version 1.6. (ICSM, 2004). To ensure the
quality of control marks used for the determination of accuracy and precision used in this research, only marks with 1st order, Class A coordinates were used for control marks. The control marks used are listed in Appendix B. The quality of these marks superior in quality to results obtained from code DGPS measurements. Class A control coordinates are referred to by the Standards and Practices for Control Surveys Version 1.6 (2004) as being designed for national and state geodetic surveys.
C
the effects of distance from correction source and if results varied over a significant distance. The location of the test sites is given in Figure 3.1.
In most circumstances, spacing between the test stations was kept around 10km. However, greater or less spacing occurred where there were insufficient coordinated marks at required locations or two different DGPS correction sources intertwined. This spacing of the test sites was to enable a comparison of results with reference to distance from the correction source.
3.3 Equipment
This project involved the use of equipment that was both able to collect GPS
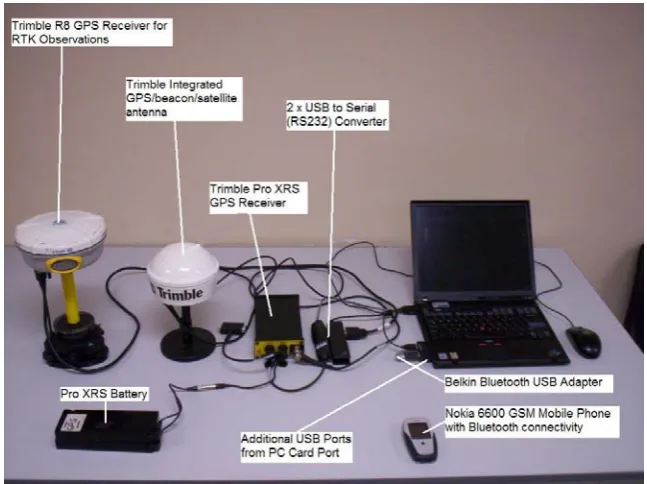
pseudorange measurements from GPS satellites and DGPS corrections from different correction sources. The equipment that was used had to be able to collect information from all the different correction sources to enable the comparison of results, so variance in the equipment used could not be used explain the any differences in observations. This was the reason a Trimble Pro-XRS GPS receiver with the ability to receive both the GPS Pseudorange measurements and corrections from both OmniSTAR and AMSA Beacon DGPS sources through an integrated antenna was chosen as the GPS receiver to test the different DGPS correction sources. An explanation of the operation and
configuration of the equipment will be supplied in Section 3.6.
The major items of equipment that were used for testing DGPS correction sources were as follows:
3.3.1 GPS Receiver
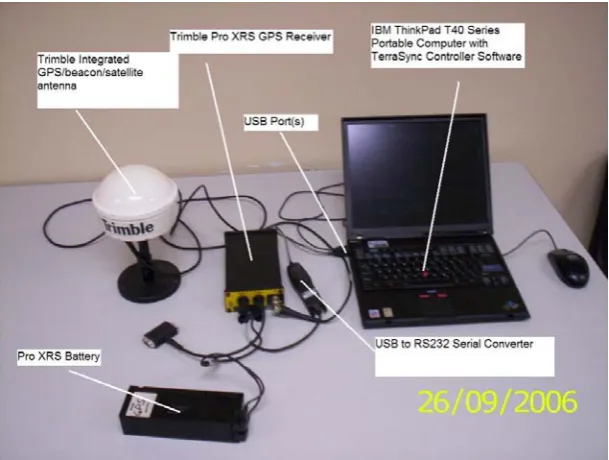
The GPS receiver used for collecting GPS Pseudorange measurements was a Trimble Pro-XRS, which is a 12 channel GPS receiver for the L1 code and carrier GPS signals (Trimble, 2006). This receiver had integrated GPS/MSK radio beacon (AMSA
Beacon)/Satellite Differential (OmniSTAR) correction abilities and it was paired with an integrated GPS/MSK radio beacon (AMSA Beacon)/Satellite Differential
(OmniSTAR) antenna. The Pro XRS is shown in Figure 3.2.
3.3.2 Controlling Software
Software was needed for the field computer to communicate with the GPS receiver. For this purpose, Trimble's TerraSync software was selected. TerraSync allowed the
data integrity. It also allowed the user to select the type of correction sources such as AMSA Beacon and OmniSTAR that were integrated into the GPS receiver. It also enabled the GPS receiver to be connected to an external correction source, which for this research was the VRS system correction (Trimble, 2003).
3.3.3 Field Computer
A field computer was needed to monitor the status of the GPS receiver and to store measurements made by it. For this research portability, was not a major issue and to enable the storage of large amount of data and the need to run other controlling software for different GPS hardware an IBM ThinkPad T40 portable computer was used. This computer is illustrated in Figure 3.2. This approach allowed the storage and processing of data to be undertaken on a single computer.
3.3.4 Receiving VRS Corrections
For receiving the external corrections from the VRS system, which only sends
correction via the GSM mobile telephone network as mentioned in Section 2.6, a Nokia 6600 mobile phone was used. This phone was able to act as a modem between the controller software on the field computer and the VRS system server to obtain
corrections. The phone was connected to the field computer via a Bluetooth connection. This was possible by the use of a Belkin Bluetooth USB adapter connected to a USB port on the computer, and the Bluetooth connection available in the Nokia 6600. This is shown in Figure 3.3.
3.3.5 USB to Serial Converters
3.3.6 Additional USB Ports
With the use of the two available USB ports for the USB to serial converters for the dynamic testing, additional USB ports were needed for both the optical mouse for ease of use of the computer, and the use of the Belkin Bluetooth USB adapter to allow the connection of the field computer and Nokia 6600 to receive VRS corrections. This equipment is illustrated in Figure 3.3.
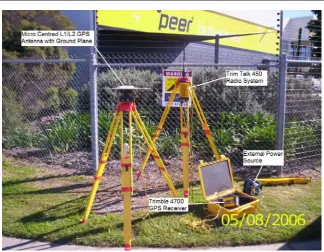
3.3.7 User Installed Base Station
A reference station was installed at 33 Harvey St North, Eagle Farm Brisbane,
Queensland. This was done to allow for the post processing of GPS observations via a user installed base to show accuracies and precisions from this style of DGPS post processed correction source. This reference station was installed over a coordinated mark GUP103. This mark had been coordinated from a coordination project for the Gateway Bridge duplication project. The mark, although not a registered mark, had been coordinated to the specifications of a 1st order, Class A, mark as per the Standards
and Practices for Control Surveys Version 1.6 (2001). For the static observations
undertaken on the weekend of 29/30 of July 2006 a Trimble 4700 GPS receiver, with a micro centred L1/L2 antenna was used to observe static data. For all other times a Leica System 500 GPS receiver system with a Leica AT502 antenna was used to observe static data from this point.
These were the major equipment components used to test the various DGPS correction sources that were common in both the static and dynamic tests.
3.4
Static Test Equipment
Figure 3.2: Static Test Equipment
3.5
Dynamic Test Equipment
The dynamic test involved the use of a second dual frequency RTK GPS receiver to provide control coordinates. Subsequently, a reference station and associated equipment was required to establish a fix for the ambiguities of the roving control RTK GPS receiver. The use of this additional equipment varied significantly from the static tests. A picture of the dynamic equipment used is shown in Figure 3.3. The dynamic
equipment differed from the equipment used for static observations in the following ways:
3.5.1 The use of a Trimble R8 RTK GPS receiver
The R8 was chosen to act as truth for the DGPS observations in this project for these reasons:
• The R8 receiver has the option of exporting NEMA strings (Trimble, 2005), which is vital to record the position of the R8 receiver with reference to the Pro XRS receiver at a period in time. For this project the R8 GPS receiver was configured with Trimble's GPS configurator software to export NEMA GGA strings which contain data on time, position, and fix status.
[image:36.595.164.488.254.496.2]• The R8 GPS receiver does not require a field computer with controller software to obtain a fix and output coordinates. It automatically searches for any available correction signals through its radio port and uses these corrections to obtain a RTK fix which is then used for the coordinates output in the NEMA string.
Figure 3.3: Dynamic Test Equipment
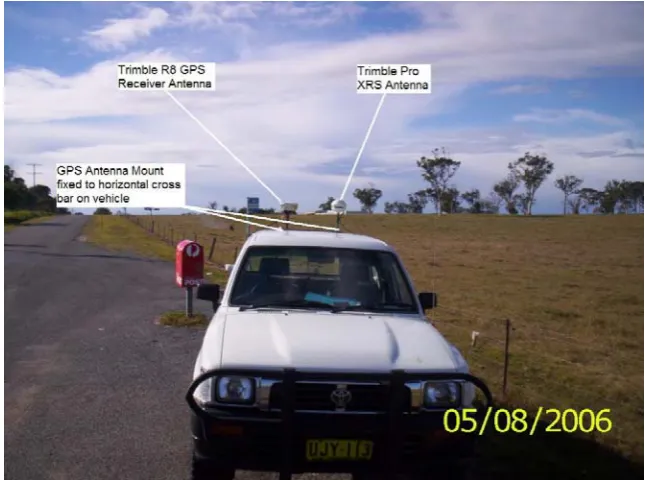
3.5.2 The use of a Test Vehicle with GPS antenna mount
In order to maintain the receivers in parallel while moving, the following method was employed. A vehicle was found that was equipped with rails running square from the centreline of the vehicle. A mount was then constructed with welded mild steel and 5/8" threaded rod which was welded vertically from the mount. The threaded rod was
Figure 3.4: Dynamic Vehicle Mount
3.5.3 Dynamic Reference Station Setup
Figure 3.5: User Installed Real Time GPS Reference Station
3.6 Data
Acquisition
The GPS data used in this study was obtained in a GPS survey campaign. It is important to note that both the control data and GPS data used are not infallible, and cannot be relied on as an unequivocal comparison of different DGPS correction sources. Possible errors are discussed in Section 4.3. It is important then to describe the origins of data and how this it was obtained.
The control data as described in Section 3.2 was obtained from a Map Info database of permanent survey marks supplied by DNRW & M, and accessed through a database maintained by the Department of Main Roads Queensland (DMR). It is important to note the adjustment date of the permanent marks as supplied in Appendix B, and their coordinates. What is also important is the physical inspection of the permanent mark when visited, as any disturbance of the mark could make the coordinates supplied not suitable as a description for the location of the permanent mark.
3.7
Static Data Acquisition
3.6 shows a picture of static data being observed at Beerwah at the northern border of the test site.
Figure 3.6: 1 Static DGPS Data Acquisition at PM120502
All data obtained from the Pro XRS GPS receiver were in the following datum;
Datum: Geocentric Datum of Australia (GDA94) Grid Coordinates (UTM) Map Grid of Australia 1994 (MGA94) in
zone 56 Table 3-1: Datum for Pro XRS GPS Receiver
To ensure the quality of measurements, the following settings were established for obtaining GPS data in the TerraSync software as obtained from the Standards and
Practices for Control Surveys Version 1.6. (2004).
Elevation Mask: 15 Degrees
Maximum GDOP: 8
[image:39.595.110.546.606.661.2]Observation Interval: 1 second epoch
Table 3-2: GPS Receiver Settings
Approximately 10 minutes of data was gathered for each correction source to determine the static position via the DGPS correction source with a level of confidence and
sources was observed in a series at each site to minimise the effect of changes in variables in error sources like atmospheric and satellite geometry changes.
3.8
Dynamic Data Acquisition
Dynamic data was observed in a GPS survey campaign on the weekend of 5/6 August 2006 for AMSA Beacon, OmniSTAR and uncorrected GPS which is also used for post processed DGPS. VRS DGPS was observed on the weekend of the 12/13 of August 2006 because the VRS system needed to be reconfigured to generate RTCM corrections as it usually is configured for CMR+ corrections.
The major difference from static observations involved the use of a second, dual
frequency RTK GPS receiver from which the coordinates were used as truth to compare the results from the DGPS correction sources. This receiver is held at constant offset from the DGPS antenna as described in Section 3.5. For this receiver to work for RTK corrections using on the fly ambiguity resolution, the installation of a user base as described in Section 3.5.3 was needed.
To ensure maximum accuracy of this RTK receiver, the distance from the correction source was kept as small as possible. This was done by utilising the control marks used for the static test as the reference location for the reference receiver. As this mark was in a site with good visibility and open access, it provided an ideal location for the reference station.
The second GPS dual frequency receiver, a Trimble R8, was configured to output NEMA strings containing data on the position of the receiver at one second intervals. To configure the R8 GPS receiver, Trimble's GPS configurator was utilised. This enabled a GGA NEMA string to be output through the serial port on the receiver.
Data from this second GPS receiver was logged as attribute data in the file recording the data from the Pro XRS DGPS receiver. A RS232 cable from the R8 receiver coupled with a USB to serial converter connected the R8 receiver to the field computer.
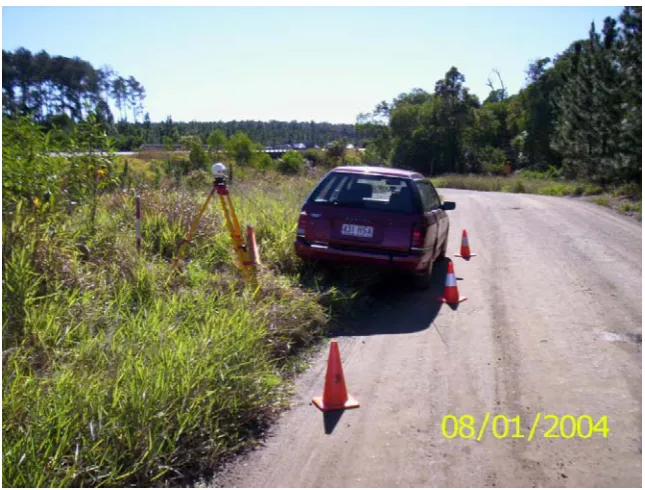
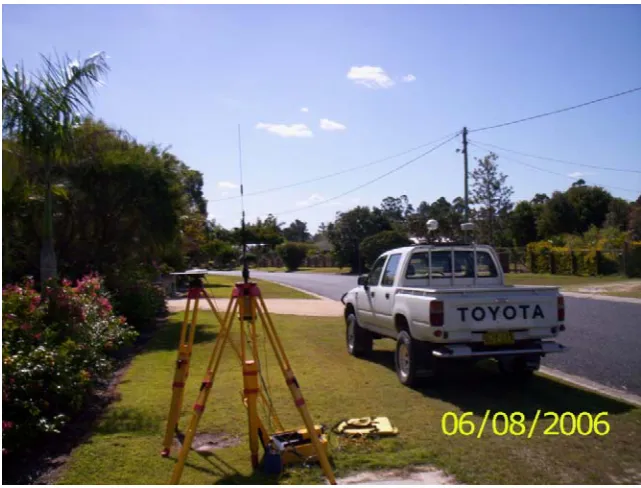
Figure 3.7: Dynamic DGPS testing at PM94371 at Ningi
3.9
Data from Reference Stations for Post Processing
This research also looked at the accuracy and precision that could be achieved from post processed DGPS correction sources. To achieve this, data needed to be obtained from 3 different sources. These three sources are explained below:
3.9.1 User Installed Base
To test the accuracies that could be achieved by installing a reference station to enable post processing, a base station was established at the DMR depot at 33 Harvey St North Eagle Farm, Brisbane. This base station was either a Trimble 4700 for static tests, or a Leica System 500 for dynamic tests. To enable the exchange of data between different GPS systems a common format, RINEX, was used and all data from the Leica System 500 was converted to this format. The data from the Trimble 4700 was already
compatible for post processing applications in Trimble Pathfinder Office.
3.9.2 USQ Base
reference station was in RINEX format. Data was received from this source via an archive of GPS observation data kept by USQ.
3.9.3 Closest VRS Base and Virtual Base
The DNRM & W, at the time GPS observations, had 4 operational continually operating reference stations at Woolloongabba, Robina, Caboolture and Ipswich. By processing GPS measurements with these reference stations gave the possibility of errors due to distance were virtually eliminated. Data from these reference stations was sourced via an archive of GPS observation data kept by DNRM & W. The data was in RINEX format.
Also the DNRM & W offered an option of generating virtual reference stations at any location via their virtual RINEX file generator as part of their Virtual Reference Station network. A request for virtual stations at the control marks via the file generator was submitted. A RINEX file of a reference station at the requested coordinates for the time period was returned. This file was used to post process the GPS data to test the accuracy and precision via this type of DGPS correction source.
3.10 Data Processing
For this project, Trimble Pathfinder Office Version 3.1 was used to interpret the data that was gathered from observations. Pathfinder Office was used to import the raw files generated by the field software, and to directly export data using the dBASE function which is explained in detail in Section 3.11. Pathfinder Office was also used to
differentially correct data using the classic differential correction method. The settings for these corrections were as follows:
• Code processing only
• Output corrected positions only
• Elevation mask of 10 degrees
• Standard rover and base processing technique
Easting Northing Height Antenna Ht LandCenter 503483.980 6959847.652 49.458 0.000
Robina 537459.191 6894212.677 25.189 0.000
Caboolture 495193.402 7003927.263 41.095 0.000
Ipswich 476350.112 6945294.063 48.765 0.000
USQ 394586.985 6946490.639 718.663 0.000
Harvey St 509047.891 6965661.992 3.674 See Below
29_07= 1.637
30_07= 1.640
5_08= 1.336
[image:43.595.141.511.56.242.2]6_08= 1.343
Table 3-3: GPS Reference Station Coordinates as used for Post Processing
3.11 Data Export
All data for this research was exported from Pathfinder Office using the dBASE export function. The dBASE export function allows the user to specify the type of output needed, such as easting, northing, PDOP, sensor records, and others. For this research two different dBase export setups were used, firstly for the static observations, and then dynamic observations. The resulting output file was given the dbf extension.
3.12 Processing Dynamic Data
To obtain control coordinates for dynamic tests, the data from the dbf file generated from Pathfinder Office had to be processed. The reason for this was because the NEMA string placed the coordinates as a single text line in the dbf file as shown below:
$GPGGA,090708.00,2733.51234011,S,15232.79611219,E,4,7,1.0,63.256,M,36.856,M,1.0,
The parts of the NEMA string needed were the latitude and longitude. Latitude and longitude from the NEMA strings needed to be extracted so they could be converted into GDA94 coordinates.
It is important to note that the seconds were in decimal degrees and due to the process to convert these coordinates to GDA94 coordinates the latitude and longitude needed to be in converted from decimal degrees.
The latitude and longitude needed to be converted to GDA94 coordinates for use as control in the comparison. This was done by using Redfearn's formula. This formula can be used to convert between latitude and longitude to easting, northing and zone for a Transverse Mercator projection, such as the Map Grid of Australia. This formula is accurate to better than 1mm in any zone of the Map Grid of Australia, according the
Geocentric Datum of Australia Technical Manual Version 2.2 (2002). To calculate the
easting and northing for each site, the Redfearns's Formula excel spread sheet was used. This spreadsheet was obtained from the Geoscience Australia website (2006).
This spreadsheet needed to be edited in order to remove some of the repetitive tasks from the calculation that would have made the reduction impossible in any reasonable period of time. A Visual Basic program was written to remove some of the repetitive tasks. This program enabled the efficient calculation of the control coordinates.
These control coordinates were still at the 501mm offset from the DGPS coordinates as recorded from the Pro XRS GPS receiver. To correct for this offset, the surveying processing software 12d was used. The control coordinates were input into 12d using the point number, easting and northing function. The traverse line as defined by these coordinates was then paralleled using the parallel string option at -0.501mm to correct for the offset caused by the antenna mount. The offset line was exported as a comma delineated file with the point number, corrected easting and corrected northing coordinates.
The comma delineated file that was output from the 12d software was used for the control reference in all measurements observed in dynamic situations.
3.13 Conclusion
This chapter reflected on the methods of obtaining DGPS measurements and processing the data from these GPS surveys. It outlined the process of post processing data and the sources for the reference station data and the coordinates used for these reference stations.
4.0 Introduction
Chapter Three described the process of obtaining data from field observations and the process of reducing the control data for dynamic tests. This data was then used to calculate accuracy and precision of the different DGPS correction sources.
This chapter outlines the process of determining this accuracy and precision achieved from the selected DGPS correction sources. It examines the process of comparing the results to control data and the statistical tests used to check for similar accuracy and precision in the mean of values and variance of values for each DGPS correction source. It will show the results of both the static and dynamic tests for accuracy and precision and provide a discussion on the effects of distance from the correction source.
4.1 Static
Tests
The results for precision using RMS for static tests for the different DGPS correction sources are shown in Table 4-1. This table is graphically interpreted in Appendix C. Also included in this table is the accuracy of the results obtained from the DGPS correction sources. The results are compared to the control value derived from the SCDB value.
Correction Source Precision (m) Accuracy (m) Precision +/- 95% Confidenc e Interval Accuracy +/- 95% Confidenc e Interval
Post Processed Closest VRS
Base 0.196 0.060 0.063 0.051
VRS DGPS 0.221 0.008 0.049 0.064
Post Processed Harvey St Base 0.266 0.107 0.117 0.097
Post Processed USQ Base 0.280 0.080 0.054 0.065
AMSA Beacon 0.285 1.267 0.048 0.098
OmniSTAR 0.319 0.748 0.071 0.145
Post Processed Virtual Base 0.329 0.028 0.070 0.118
[image:46.595.113.545.452.647.2]Uncorrected 1.375 0.549 0.060 0.475
Table 4-1: Precision & Accuracy of Different DGPS Correction Sources in Static Situations
correction sources are far less accurate. Reasons for this will be discussed in Section 5.3. A full list of results from static testing is provided in Appendix D.
4.2 Dynamic
Tests
The results of the dynamic accuracies and precisions that were obtained from dynamic testing is provided in Table 4-2. This table is graphically interpreted in Appendix C.
Correction Source Precision (m) Accuracy (m) Precision +/- 95% Confidence Interval Accuracy +/- 95% Confidence Interval
VRS DGPS 0.277 0.052 0.055 0.097
OmniSTAR 0.286 0.582 0.060 0.111
AMSA Beacon 0.298 1.229 0.053 0.094
Post Processed Closest VRS
Base 0.373 0.120 0.060 0.117
Post Processed Harvey St Base 0.439 0.157 0.059 0.117
Post Processed USQ Base 0.462 0.105 0.053 0.099
Post Processed Virtual Base 0.554 0.232 0.076 0.227
Uncorrected 1.219 0.802 0.110 0.313
Table 4-2: Precision & Accuracy of Different DGPS Correction Sources in Dynamic Situations
Dynamic results are similar to that obtained from static observations. There is an overall increase in the size of the accuracy and precisions error values, equating to
approximately 100mm. This could be explained through the propagation of error as described in Section 4.3. It can be determined that there is no significant difference in accuracy and precision from both static and dynamic measurements. A full list of results for dynamic tests is provided in Appendix E.
4.3
The Propagation of Error
For this research it was important to understand the possible errors that could be imported into the data. For the static tests the known possible sources of error were eliminated, minimised or taken into account. An example might be the incorrect
The error caused by the inevitable cornering of the test vehicle. This error was calculated by taking into account the sampling interval for GPS measurements at 1 second intervals and the maximum speed of 1.7 m/s. The minimum turning radius of the test vehicle was determined to be 7.5 meters, from which the maximum possible error, if the sample was taken at the worst possible scenario at the middle of two averaged vertices, was 0.089m. The other error from the dynamic tests was the error caused from the initialisation of the R8 GPS receiver. From technical specifications this error was determined to be 0.022 metres. This was calculated by using the propagation of error as shown in Equation 4-1.
2 2
2
tion Initialisa Antenna
Total σ σ
σ = +
Equation 4-1: Propagation of Error
From this equation the total error that was present in the control for the dynamic environment was determined to be 0.092m. No judgement on the accuracy and precision for dynamic results could be made within a limit 0.092 metres.
4.4
Results of Statistical Tests for Static Situations
Real Time Processed Post Processed Uncor-rected VRS DGPS AMSA Omni-STAR VRS Harvey
St USQ Virtual
Uncorrected Mean Fail Fail Fail Mean Mean Mean
VRS DGPS Mean Variance Variance Pass Mean Mean Mean AMSA Fail Variance Variance Variance Variance Variance Fail OmniSTAR Fail Variance Variance Fail Fail Fail Fail
VRS Fail Pass Variance Fail Fail Mean Mean
Harvey St Mean Mean Variance Fail Fail Pass Pass
USQ Mean Mean Variance Fail Mean Pass Pass
[image:49.595.97.530.55.212.2]Virtual Mean Mean Fail Fail Mean Pass Pass
Table 4-3: Static DGPS Correction Sources Statistical Results
4.5
Results of Statistical Tests for Dynamic Situations
The same statistical analysis of results from DGPS correction sources were used for dynamic situations. The results of these tests are shown in Table 4-4.
Real Time Processed Post Processed Uncor-rected VRS DGPS AMSA Omni-STAR VRS Harvey
St USQ Virtual
Uncorrected Fail Fail Fail Fail Fail Fail Fail
VRS DGPS Fail
Varianc e
Varianc
e Mean Mean Mean Mean
AMSA Fail
Varianc e
Varianc
e Fail Fail Fail Fail
OmniSTAR Fail
Varianc e
Varianc
e Fail Fail Fail Fail
VRS Fail Mean Fail Fail Pass Pass Mean
Harvey St Fail Mean Fail Fail Pass Pass Pass
USQ Fail Mean Fail Fail Pass Pass Pass
Virtual Fail Mean Fail Fail Mean Pass Pass
Table 4-4: Dynamic DGPS Correction Sources Statistical Results
4.6
Distance from Correction Source
This research also took into account the errors that could be introduced due to the increasing distance from the correction source. The results for all correction sources in the test area gave no evidence that the distance from correction source had a significant effect on accuracy or precision.
[image:49.595.99.520.361.546.2]source for the test area. Figure 4.1 illustrates the results from stand-alone reference stations for the degradation of accuracy depending on distance from correction source within the test area. There is a small decrease in accuracy degradation of approximately 100mm over the entire test area. However, considering the applications DGPS is used for, this amount is considered negligible.
.
Accuracy with Respect to Distance from
Correction Source for Static Applications
y = 6E-07x + 0.1799
0.000 0.100 0.200 0.300 0.400 0.500 0.600 0.700 0.800
0 50000 100000 150000
Distance From Correction Source (m)
A
c
curacy (
m
[image:50.595.119.532.194.461.2])
Figure 4.1 Accuracy with Respect to Distance from Correction Source for Static Situations
Precision with Respect to Distance
from Correction Source for Static
Applications
y = 6E-08x + 0.415
0.000
0.200
0.400
0.600
0.800
1.000
1.200
0
50000
100000
150000
Distance from Correction Source (m)
Pr
[image:51.595.119.529.83.354.2]ecision (m)
Figure 4.2 Precision with Respect to Distance from Correction Source for Static Situations
These results are based only on the post processed DGPS correction sources from a single reference station. However, the results are commiserate with results obtained from the different DGPS correction sources either real time or post processed. In this research, it was found that distance from the correction source is not a major factor in increasing or decreasing the relative accuracy and precision of any DGPS correction source.
4.7 Conclusion
It showed the errors that needed to be taken into account when making conclusions on results by examining the propagation of errors in dynamic measurements as being caused by the method of providing control. It also demonstrated the minimal effect that distance had on DGPS correction within the limits of the test area by providing an example of common results.
5.0 Introduction
Chapter Four provided the results of the DGPS correction sources for accuracy and precision. It determined the results for tests on variance and mean for these results. It provided a common example of the errors caused by distance.
This chapter will analyse the reasons for these results. It will rank the DGPS correction sources in both accuracy and precision and will analyse the variances as determined by Fisher's F test and the mean as determined by Student's T test.
5.1 Static
Results
Precision
The static results are displayed in Figure 5.1 ranked in order of precision (error bars indicates the 95% confidence intervals for the 17 test sites). There was little difference in the results obtained from different DGPS correction sources regardless of the
techniques they used. All precisions were within 0.4 metres except for uncorrected GPS observations which was 1.4 meters. From this chart it can be easily recognised that DGPS improves the precision of GPS measurements, with minimal differences between the different correction sources.
[image:54.595.146.508.471.681.2]Precision of DGPS Correction Sources in Static Situations 0 0.2 0.4 0.6 0.81 1.2 1.4 1.6 Po st P ro cessed C losest VR S Ba se VRS DG PS Po st P ro cessed Har ve y St Ba se Po st P ro cessed USQ Ba se AM SA B eacon O m n iST AR Po st P roc essed Vir tu al Ba se Unco rr e cted Correction Source P re ci si on R M S (m)
Accuracy
For the static results, the accuracies are displayed in Figure 5.2 in a ranking of smallest to largest. There was little difference in the accuracy of results obtained from correction sources that are known to be linked to GDA94 coordinates. The most interesting fact is the lack of accuracy in measurements obtained from both OmniSTAR and AMSA Beacon DGPS correction sources.
[image:55.595.145.506.205.411.2]Accuracy of DGPS Correction Sources in Static Situations -0.20 0.2 0.4 0.6 0.81 1.2 1.4 1.6 VRS DG PS Po st P roc essed Vir tu al Ba se Po st P ro cessed C losest VRS Ba se Po st P ro cessed US Q B a se Po st P ro cessed Ha rve y S t Ba se Unco rr e cte d Omn iS T A R AM SA B eaco n Correction Source Accurac y ( m)
Figure 5.2: Ranked Accuracy of Static Results
As the variances of AMSA Beacon, OmniSTAR and VRS DGPS are similar according to results obtained from the F test, it can be argued that the coordinates used at the reference station of these DGPS correction sources is not true GDA94 coordinates. This may be caused either from a poor transformation of coordinates or the use of a different datum other than the specified GDA94 in their technical specifications as explained in section 5.3.
5.2 Dynamic
Results
Precision
The precision of the dynamic results are displayed in Figure 5.3, ranked from most precise to least precise. The results are similar to those obtained through static
Precision of DGPS Correction Sources in Dynamic Situations 0.000 0.200 0.400 0.600 0.800 1.000 1.200 1.400 VR S D G PS Omn iS T A R AM S A B
eacon Post
[image:56.595.144.507.67.274.2]P roc essed Close st VR S Ba se Po st P roc essed Ha rv e y St Ba se Po st P roc essed USQ Ba se Pos t P roce ssed Vir tu al Ba se Un co rr e cte d Correction Source Prec ision RMS ( m )
Figure 5.3: Ranked Precision of Dynamic Results
Accuracy
[image:56.595.148.508.418.622.2]The results of the accuracy of the DGPS result in dynamic situations are shown in Figure 5.4. This shows similar trends to those observed for static results.
Accuracy of DGPS Correction Sources in Dynamic Situations -0.2 0 0.2 0.4 0.6 0.8 1 1.2 1.4 VRS D G PS Po st P roc essed USQ Ba se Po st P roc essed Close st VRS Ba se Po st P roc essed Ha rv e y St Bas e Pos t P roce ssed Vir tu a l Ba se O m n iST AR Un co rr e cte d AM S A B eacon Correction Source Ac cu racy ( m )
Figure 5.4: Ranked Accuracy of Dynamic Results
measurement relies on the positions being precise, accurate and especially up to date if used in conjunction with a real time DGPS correction source.
5.3
Accuracy comparison of AMSA Beacon and OmniSTAR
From the results obtained it appears that the accuracy of both the AMSA Beacon and the OmniSTAR DGPS correction sources are poor. This is a trend that was present across all test sites. The use of the same equipment under similar conditions at all test sites indicates that the reference station data provided by these correction sources is different to that provided by VRS DGPS.
This was confirmed by investigating the datum used by the AMSA Beacon and
OmniSTAR DGPS correction sources. It was found that they are not based on GDA 94. VRS DGPS and post processed DGPS correction sources are based on GDA 94. This explains the decreased accuracy of AMSA Beacon, which is based on WGS84, and OmniSTAR which is based on ITRF2000, as the corrections received from these sources make results based on the respective datum.
5.3.1 OmniSTAR Datum
OmniSTAR uses the ITRF2000 coordinate datum for determining corrections to users. This means correction received ITRF2000 is a dynamic datum that is used by
OmniSTAR correction reference stations. The coordinates for these reference stations are updated ever six months by OmniSTAR (Walford 2006). Results obtained from the OmniSTAR DGPS correction source are also based on the ITRF2000 datum. ITRF2000 is approximately 0.77 meters different to GDA94 positions at the end of 2005.
This difference can explain the accuracy error of OmniSTAR results. With the knowledge of this error and with the variance of OmniSTAR and VRS DGPS being similar at the 95% confidence level, VRS DGPS, as shown in Table 4-3 and Table 4-4. Applying a correction to correct the bias will provide a result of similar accuracy and precision to VRS DGPS. From the research Table 5-1 gives a value that would improve accuracy if applied to results.
OmniSTAR Suggested Correction Easting Northing
[image:57.595.224.429.691.739.2]-0.359 -0.656
The implications of the use of ITRF2000 as a datum are that it is a dynamic datum. Unlike the GDA 94 datum, which is fixed at point in time, ITRF2000 is revised at certain time increments. OmniSTAR stated that it revises ITRF2000 datum coordinates at an increment of six months. This does not affect the results of low accuracy
positioning requirements. It does however affect the precise positioning requirements of the user if they require to replicate or return to previously measured sites accurately. OmniSTAR states that they update their coordinates on the 1st of January and 1st of July. If measurements were made during this time it would be important to take this shift in datum and therefore coordinates into account. This also makes OmniSTAR not as useful in for position requirements that require repeatable results over time.
Because the datum shifts to maintain a link to ITRF2000 coordinates, the suggested correction provided by this section will change as of 1st January 2007
5.3.2 AMSA Beacon Datum
AMSA Beacon is based on the WGS84 datum (AMSA, 2006). This means that all results obtained from AMSA Beacon DGPS correction sources is also based on the WGS84 datum. From the results of test it appears that AMSA Beacon DGPS is not a true representation of the WGS84 datum. WGS84 is regularly updated to minimise the difference between it and ITRF2000. This was last done in 2002. If this was the case the accuracy of AMSA Beacon should be similar to the accuracy of OmniSTAR DGPS. The difference should be within the order of 150mm. From testing it was determined to be 520mm different in accuracy. The reason for this greater discrepancy in accuracy compared to OmniSTAR coordinates, which should be within a few centimetres, is unknown.
AMSA Beacon is provided primarily to meet the needs of mariners as an aid in safe navigation. The AMSA Beacon service already meets this requirement with an accuracy of a few meters. AMSA rates the alignment of its DGPS correction service with ITRF as a low priority. With this knowledge, users of AMSA Beacon DGPS corrections need to be aware of possible changes in datum epochs for WGS84 datum by AMSA. AMSA has no explicit policy of revising in WGS84 datum at set dates, such as OmniSTAR. With this knowledge, if high accuracy DGPS was needed monitoring of the AMSA Beacon service would be needed to detect any changes in datum values.
be vastly increased. From this research Table 5-2 suggests a correction for easting and northing when it is used in this test area.
AMSA Beacon Suggested Correction Easting Northing
[image:59.595.217.437.115.160.2]-1.207 -0.384
Table 5-2: AMSA Beacon Suggested Correction
This correction should improve the coordinates obtained from AMSA Beacon results so they closely match the GDA94 value.
5.4
Differences Between Real Time DGPS Correction
Sources
The only difference between real time DGPS correction sources is the accuracy. The precision or variance of results obtained from these different DGPS correction sources within the test area is very small. This was confirmed by the different DGPS Correction sources passing the F test for variance being similar at a 95% confidence level for Easting and Northing.
By applying the correction for AMSA Beacon and OmniSTAR as shown in Table 5-1 and Table 5-2 a user can obtain similar results. The best system clearly is the VRS DGPS correction source for the reason the accuracy is very good compared to AMSA Beacon and OmniSTAR DGPS corrections. However, with the application of the correction for easting and northing, both AMSA Beacon and OmniSTAR will have similar accuracy. With knowledge of a correction to apply to results all real time DGPS correction sources are similar in accuracy and precision.
5.5
Differences Between Post Processed DGPS Correction
Sources
at the time of testing. Comparing Table 4-1 and Table 4-2 shows the accuracy of the different post processed DGPS systems is very similar.
5.6
Cost versus Accuracy and Precision of Real Time DGPS
Correction Sources
The cost of acquiring the different real time corrections appears to have an effect on the accuracy of the results obtained. With VRS DGPS and OmniSTAR being far more accurate than AMSA Beacon, which is the free to air service. However, as discussed in section 5.4 with the application of a correction to the results all three tested real tim