DEVELOPMENT AND VALIDATION OF ANALYTICAL METHODS FOR THE ESTIMATION OF ALVERINE CITRATE IN BULK AND IN PHARMACEUTICAL DOSAGE FORM BY UV SPECTROSCOPY AND
RP-HPLC
Dissertation Submitted to
The Tamil Nadu Dr. M.G.R. Medical University, Chennai – 600 032. In partial fulfillment for the award of degree of
MASTER OF PHARMACY (Pharmaceutical Analysis)
Submitted by
JETTY SUNEEL KUMAR Register No. 261230601
Under the Guidance of
Dr. K. ANANDAKUMAR, M.Pharm.,Ph.D.,
Associate Professor.
(Department of Pharmaceutical Analysis)
ADHIPARASAKTHI COLLEGE OF PHARMACY
(Accredited by “NAAC” with CGPA of 2.74 on a four point scale at “B” Grade) MELMARUVATHUR – 603 319
CERTIFICATE
This is to certify that the research work entitled “DEVELOPMENT AND VALIDATION OF ANALYTICAL METHODS FOR THE ESTIMATION OF ALVERINE CITRATE IN BULK AND IN PHARMACEUTICAL DOSAGE FORM BY UV SPECTROSCOPY AND RP-HPLC” submitted to The Tamil Nadu Dr. M.G.R. Medical University in partial fulfilment for the award of the degree of
Master of Pharmacy (Pharmaceutical Analysis) was carried out by JEETY SUNEEL KUMAR (RegisterNo:261230601) in the Department of
Pharmaceutical Analysis under my direct guidance and supervision during the academic year 2013-2014.
Place: Melmaruvathur Dr. K. ANANDAKUMAR, M.Pharm.,Ph.D.,
Date: Associate Professor,
Department of Pharmaceutical Analysis, Adhiparasakthi College of Pharmacy,
CERTIFICATE
This is to certify that the research work entitled “DEVELOPMENT AND VALIDATION OF ANALYTICAL METHODS FOR THE ESTIMATION OF ALVERINE CITRATE IN BULK AND IN PHARMACEUTICAL DOSAGE FORM BY UV SPECTROSCOPY AND RP-HPLC” submitted to The Tamil Nadu Dr. M.G.R Medical University in partial fulfilment for the award of the degree of
Master of Pharmacy (Pharmaceutical Analysis) was carried out by JETTY SUNEEL KUMAR (Register No. 261230601) in the Department of
Pharmaceutical Analysis, Adhiparasakthi College of Pharmacy, Melmaruvathur which is affiliated to The Tamil Nadu Dr. M.G.R. Medical University, Chennai, under the guidance of Dr. K. ANANDAKUMAR, M.Pharm., Ph.D., Associate Professor, Department of Pharmaceutical Analysis, Adhiparasakthi College of Pharmacy, during the academic year 2013-2014.
Place: Melmaruvathur Prof. (Dr.) T. VETRICHELVAN, M.Pharm., Ph.D., Date: Principal & Head,
Department of Pharmaceutical Analysis, Adhiparasakthi College of Pharmacy,
ACKNOWLEDGEMENT
It gives me an immense pleasure to acknowledge, the help rendered to me by a host of a people, to whom I owe gratitude for successful completion of my Master of pharmacy (Pharmaceutical Analysis) degree course.
First and foremost, I wish to express my deep sense of gratitude to his Holiness ARULTHIRU AMMA, President, ACMEC Trust, Melmaruvathur for his ever growing blessings in each step of the study.
I am grateful to THIRUMATHI LAKSHMI BANGARU ADIGALAR, Vice President, ACMEC Trust, Melmaruvathur and Dr.E.SRILEKHA, correspondent, Adhiparasaakthi College of Pharmacy, Melmaruvathur for having given me an opportunity and encouragement all the way in completing the study.
The research work embodied in dissertation has been carried out under supervision of my esteemed and most respected guide Dr. K.ANANDAKUMAR, M.Pharm., Ph.D., Associate Professor, Department of Pharmaceutical Analysis, Adhiparasakthi College of Pharmacy, my greatest debt of gratitude is to him for his continuous encouragement, valuable suggestions, dynamic guidance to elucidate problems and constant motivation throughout the dissertation work.
I express my deep sense of gratitude to respected Dr. D. NAGAVALLI, M.Pharm., Ph.D., Professor, Mrs. G. ABIRAMI, M.Pharm., Assistant Professor and Mr. J.SAMINATHAN, M.Pharm., Assistant Professor, Department of Pharmaceutical Analysis and other faculty members of Adhiparasakthi college of Pharmacy, Melmaruvathur, for their valuable help and guidance during the course of my research work.
I thank our laboratory staff members and librarian for their valuable support during the research work
I have great pleasure in express my sincere heartfelt thanks to Mr. A.PRABANANTHAN, M.Pharm., for his support during this study.
Last but not least, with my whole heart, I would like to express my thanks to my father Mr.J.M.MALLIKARJUNA, my mother Mrs. J. SUBHASHINI and my brother Mr. MANOJ KUMAR for their encouragement and support which were a tower of strength during the entire course of work.
Dedicated to
My
CONTENTS
SECTION TITLE Page No.
1. INTRODUCTION
1.1. Introduction to Analytical Chemistry 1
1.2. Spectroscopy 5
1.3. Chromatography 24
1.4. Validation 45
1.4.1. Analytical method validation as per ICH guidelines 46
1.5. Basic Statistical parameters 52
2. LITERATURE REVIEW
2.1. Drug profile 56
2.2. Reported methods 58
3. AIM AND PLAN OF WORK
3.1. Aim of work 66
3.2. Plan of work 67
4. MATERIALS AND METHODS
4.1. Materials used 68
4.2. Methods 71
4.2.1. UV Spectroscopic method 71
4.2.2. RP- HPLC method 75
5. RESULTS AND DISCUSSION
5.1. UV Spectroscopic method 82
5.2. RP-HPLC method 85
6. SUMMARY AND CONCLUSION
6.1. UV Spectroscopic method 88
6.2. RP-HPLC method 89
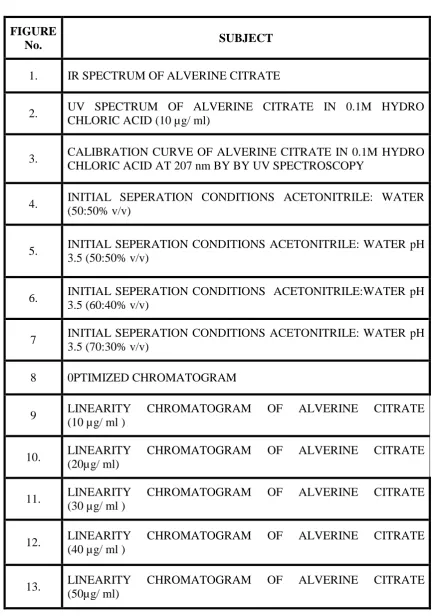
LIST OF FIGURES
FIGURE
No. SUBJECT
1. IR SPECTRUM OF ALVERINE CITRATE
2. UV SPECTRUM OF ALVERINE CITRATE IN 0.1M HYDRO CHLORIC ACID (10 µg/ ml)
3. CALIBRATION CURVE OF ALVERINE CITRATE IN 0.1M HYDRO CHLORIC ACID AT 207 nm BY BY UV SPECTROSCOPY
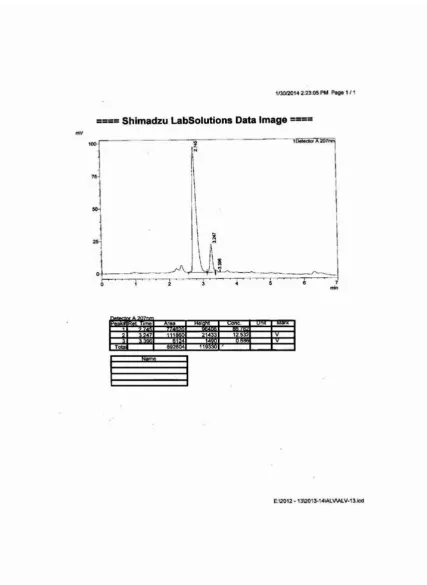
4. INITIAL SEPERATION CONDITIONS ACETONITRILE: WATER (50:50% v/v)
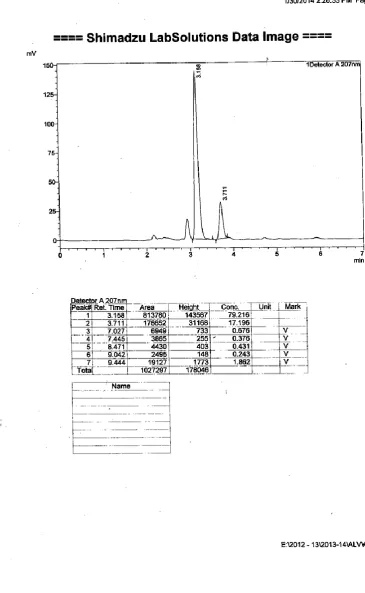
5. INITIAL SEPERATION CONDITIONS ACETONITRILE: WATER pH 3.5 (50:50% v/v)
6. INITIAL SEPERATION CONDITIONS ACETONITRILE:WATER pH 3.5 (60:40% v/v)
7 INITIAL SEPERATION CONDITIONS ACETONITRILE: WATER pH 3.5 (70:30% v/v)
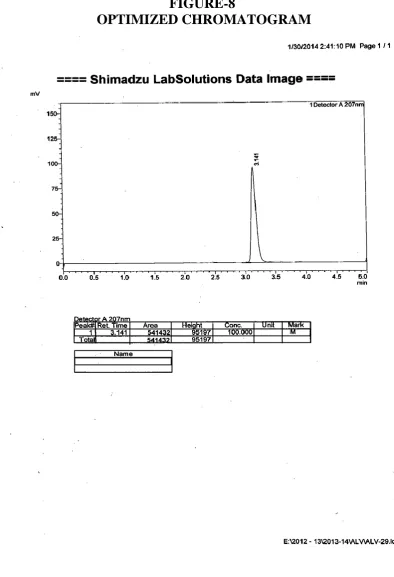
8 0PTIMIZED CHROMATOGRAM
9 LINEARITY CHROMATOGRAM OF ALVERINE CITRATE (10 µg/ ml )
10. LINEARITY CHROMATOGRAM OF ALVERINE CITRATE (20µg/ ml)
11. LINEARITY CHROMATOGRAM OF ALVERINE CITRATE (30 µg/ ml )
12. LINEARITY CHROMATOGRAM OF ALVERINE CITRATE (40 µg/ ml )
14 LINEARITY CHROMATOGRAM OF ALVERINE CITRATE(60µg/-ml ) 15 CALIBRATION CURVE ALVERINE CITRATE BY RP-HPLC
16 REPEATABLITY ANALYSIS OF FORMULATION – 1 BY RP HPLC 17 REPEATABLITY ANALYSIS OF FORMULATION – 2 BY RP HPLC 18 REPEATABLITY ANALYSIS OF FORMULATION – 3 BY RP HPLC 19 REPEATABLITY ANALYSIS OF FORMULATION – 4 BY RP HPLC 20 REPEATABLITY ANALYSIS OF FORMULATION – 5 BY RP HPLC 21 REPEATABLITY ANALYSIS OF FORMULATION – 6 BYRP HPLC 22 CHROMATOGRAM FOR RECOVERY ANALYSIS-1 (80%)
23 CHROMATOGRAM FOR RECOVERY ANALYSIS-2 (80%) 24 CHROMATOGRAM FOR RECOVERY ANALYSIS-3 (80%) 25 CHROMATOGRAM FOR RECOVERY ANALYSIS-1 (100%) 26 CHROMATOGRAM FOR RECOVERY ANALYSIS-2 (100%) 27 CHROMATOGRAM FOR RECOVERY ANALYSIS-3 (100%) 28 CHROMATOGRAM FOR RECOVERY ANALYSIS-1 (120%) 29 CHROMATOGRAM FOR RECOVERY ANALYSIS-2 (120%)
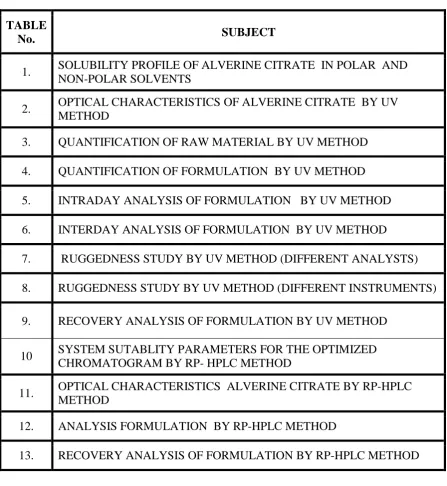
LIST OF TABLES
TABLE
No. SUBJECT
1. SOLUBILITY PROFILE OF ALVERINE CITRATE IN POLAR AND NON-POLAR SOLVENTS
2. OPTICAL CHARACTERISTICS OF ALVERINE CITRATE BY UV METHOD
3. QUANTIFICATION OF RAW MATERIAL BY UV METHOD
4. QUANTIFICATION OF FORMULATION BY UV METHOD
5. INTRADAY ANALYSIS OF FORMULATION BY UV METHOD
6. INTERDAY ANALYSIS OF FORMULATION BY UV METHOD
7. RUGGEDNESS STUDY BY UV METHOD (DIFFERENT ANALYSTS)
8. RUGGEDNESS STUDY BY UV METHOD (DIFFERENT INSTRUMENTS)
9. RECOVERY ANALYSIS OF FORMULATION BY UV METHOD
10 SYSTEM SUTABLITY PARAMETERS FOR THE OPTIMIZED CHROMATOGRAM BY RP- HPLC METHOD
11. OPTICAL CHARACTERISTICS ALVERINE CITRATE BY RP-HPLC METHOD
12. ANALYSIS FORMULATION BY RP-HPLC METHOD
[image:10.595.102.550.111.598.2]LIST OF ABBREVIATIONS USED
% - Percentage
% RSD - Percentage Relative Standard Deviation
- Micron
l - Microlitre
°
C - Degree Celsius
gm - Grams
ICH - International Conference on Harmonisation IR - Infra Red
LOD - Limit of Detection LOQ - Limit of Quantitation mg/ tab - Milligram Per tablet
min - Minute
ml - Millilitre
ml/ min - Millilitre/ Minute
nm - Nano meter
pH - Negative Logarithm of Hydrogen ion Concentration rpm - Rotations Per Minute
Rt or tR - Retention Time SD - Standard Deviation SE - Standard Error IP - IndianPharmacopoeia
v/v - Volume/ Volume λ - Lambda
cm - Centimeter
μg/ ml - Microgram Per Millilitre
HPLC - High Performance Liquid Chromatography
DMF - Dimethyl Formamide
BP - British Pharmacopoeia
CI - Confidence Interval
1
1. INTRODUCTION
1.1 INTRODUCTION TO ANALYTICAL CHEMISTRY
(http://www.files.chem.vt.edu/chem-ed/crossref/ac-intro.html)
Analytical chemistry is the science of making quantitative measurements. In practice, quantifying analytes in a complex sample becomes an exercise in problem solving. To be effective and efficient, analyzing samples requires expertise in:
1. the chemistry that can occur in a sample
2. analysis and sample handling methods for a wide variety of problems (the tools-of-the-trade)
3. proper data analysis and record keeping
To meet these needs, Analytical Chemistry courses usually emphasize equilibrium, spectroscopic and electrochemical analysis, separations, and statistics. Analytical chemistry requires a broad background knowledge of chemical and physical concepts. These hypermedia documents contain links to the fundamental principles that underly the different analytical methods. With a fundamental understanding of analytical methods, a scientist faced with a difficult analytical problem can apply the most appropriate technique(s). A fundamental understanding also makes it easier to identify when a particular problem cannot be solved by traditional methods, and gives an analyst the knowledge that is needed to develop creative approaches or new analytical methods.
The methods of detecting analytes are the fallowing 1. Physical means
o mass o colour
2 o thermal conductivity
2. With electromagnetic radiation (Spectroscopy) o Absorption
o Emission o Scattering 3. By an electric charge
o Electrochemistry o Mass spectrometry
Thereare a limited number of ways to detect an analyte. However, in each of the above general categories there are a large multitude of specific analytical techniques.
1.1.1 Importance Of Analysis (Kellner et al., 2004)
Newer analytical methods are developed for the drugs or drug combinations due to the patient must receive the good quality of drugs, the drug or drug combinations may not be official in any Pharmacopoeia, a literature search may not reveal an analytical procedure for the drug or it combinations, analytical methods may not be available for the drug combinations due to interference caused by excipients and analytical methods for the quantification of drug or drug combinations from biological fluids may not be available.
3 1.1.2 Disciplines Of Analytical Chemistry
(Gurdeep R. Chatwal et al., 2007; Napoleon, 2006; Kamboj, 2007)
There are two types of analysis. Those are as follows: a) Qualitative analysis
b) Quantitative analysis 1.1.2.1 Qualitative analysis
This is practiced in order to establish the composition of naturally occur artificially synthesized or manufactured substances.
1.1.2.2 Quantitative analysis
There are several methods for quantitative analysis such methods are as mentioned below.
1.1.2.2.1 Chemical methods
1.1.2.2.1.1 Titrimetric analysis
The titrimetric methods are considered superior to gravimetric methods the analysis is similarly based on equivalent weight of one substance reacts quantitatively with the other.
i. Acid-base titrations ii. Non-aqueous titrations iii. Redox titrations iv. Precipitation titrations
v. Complexometric titrations 1.1.2.2.1.2 Gravimetric analysis
4 1.1.2.2.1.3 Gasometric analysis
The gases like cyclopropane, carbon dioxide, nitrous oxide, oxygen, octyl nitrate, nitrogen, amyl nitrate, ethylene and helium are determined by gasometric analysis. The measurement of volume of gas is usually done by means of gas burettes.
1.1.2.2.2 Physicochemical methods
These methods are mainly used for the measurement of certain physical properties and to determine the contents or composition of a substance. They are employed for the determination of trace concentrations of elements in preference to the sample. These are preferred due to their selectivity, simplicity, speed of analysis and accuracy than other methods. Most of the methods make use of standards having in the known amount of the constituents serves as the basis of comparison in the instrument. The changes in the properties of system detected by measurement of current, potential, electrical conductivity, specific rotation and refractive index.
1.1.2.2.3 Microbiological methods
5
1.1.2.2.4 Biological methods
When the potency of the drug or its derivative cannot be properly determined by physical or chemical methods, and where it is possible to observe the biological effects of the drug on some type of living matter, the biological assays are carried out on the basis of such assays is to determine how much of sample gives the same biological effect as a given quantity of the standard preparation. The sample and standard tested under identical conditions in all respect. In a typical bio-assay, a stimulus is applied to a subject. The intensity of stimulus applied to a subject is referred to as the dose and is indicated by a weight or in terms of the concentration of the preparation. The application of a stimulus on a subject produces some observable effect and this is called the response. The response may be measured by the total weight or weight of some organ of the subject, blood sugar concentration, and diameter of inhibition zone or by some other physiological symptoms.
1.2SPECTROSCOPY(http://www.wavesignal.com/forensics/Anlys.html)
6
or absorbed by them. A device for recording a spectrum is a spectrometer. Spectroscopy can be classified according to the physical quantity which is measured or calculated or the measurement process.
1.2.1 Spectroscopic Methods
(Gurudeep R. Chatwal, et al., 2008; Beckett and Stenlake, et al., 2007)
Spectroscopy deals with the interaction of an analyte with electromagnetic radiation. The interaction of the electromagnetic radiation results in absorption or emission radiations. Based on the absorption or emission the spectroscopy is classified into, absorption spectroscopy and emission spectroscopy.
1.2.1.1 Absorption spectroscopy
When a beam of electromagnetic radiation is passed through an analyte, certain amount of the radiation is absorbed into the matter. The analyte after absorbing the radiation goes from the ground state to the excited state giving the absorption spectra. The various absorption spectroscopies include the UV-Visible absorption,X-ray absorption, infrared absorption, microwave absorption, radio frequency absorption and atomic absorption, etc.
1.2.1.1.1 Atomic Absorption
7
1.2.1.1.2 Molecular Absorption
The molecular absorption spectra of polyatomic molecules are more complex than the atomic absorption spectra since the number of energy states are higher. The energies associated with a molecule are rotational energy, vibrational energy and electronic energy.
E = Eelectronic + Evibrational +Erotational
The molecule absorbs electromagnetic radiation of energy corresponding to the difference in the energy of the ground state molecule and the excited state molecule. The difference in energy ∆E is given by,
∆E = (Eelectronic + Evibrational +Erotational) excited – (Eelectronic + Evibrational +Erotational) ground
The UV-Visible radiations and X-rays have the energy to induce the transition from the ground state to the excited state.
1.2.1.2 Emission spectroscopy
Emission spectroscopy is the technique in which the wavelength of the photons emitted by an analyte due to the transition from higher energy level to lower energy on exposure to an electromagnetic radiation was studied. Each analyte emits a specific wavelength of radiation corresponding to the composition of the sample. The energy of the photons emitted is given by
Ephoton= hυ
Where E is the energy of the photon, ν is the frequency and h is the Planck’s
8
1.2.1.2.1 Atomic Emission
When an analyte is heated, it emits light characteristic of the atom present in it. For example, Sodium when heated emits yellow light and Potassium emits lilac light. When a metal is heated, the electrons in the outer orbital absorb the heat and goes to a higher energy state. The atom then comes back to the ground state by emitting the photons of light which has energy equal to the difference between the higher energy state and the lower energy state. The instrumental analytical technique, such as the flame emission spectroscopy works on the principle of measuring the photons of energy emitted by a thermally excited atom.
1.2.1.2.2 Molecular Emission
When a beam of electromagnetic radiation falls on a molecular species, it absorbs the radiation and gets excited. The excited molecules are short lived and it fall back to the ground state immediately. The molecules in the excited sate have higher vibrational energy than that of the ground state. They emit the absorbed energy by the following ways, fluorescence and phosphorescence.
The difference in the energy levels of the absorbed radiation, fluorescence and phosphorescence are as below
∆Eabsorption> ∆Efluorescence> ∆Ephosphorescence
The analytical techniques Spectrofluorimetry and Phosphorimetry involve the principle of molecular emission.
1.2.2 Ultraviolet Spectroscopy (Beckett and Stenlake, 2002)
9
from the ground state to higher energy state. It is useful to measure the number of conjugated double bonds and also aromatic conjugation with the various molecules.
The ultraviolet region of the electromagnetic spectrum is frequently subdivided into as follows:
Far vacuum Ultraviolet region (10 - 200 nm)
Near Ultraviolet region (200 - 400 nm)
Visible region (380 - 780 nm)
Ultra violet absorption spectra are attributed to a process in which the outer electron of atoms or molecules absorbs radiant energy and undergoes transitions to higher energy level. Their transitions arequantitized and depend on electronic structure of the absorbent. Many molecules absorb ultraviolet or visible light. The absorbance of a solution increases as attenuation of the beam increases. Absorbance is directly proportional to the path length, b, and the concentration, c, of the absorbing species. Beer's Law states that
A = bc, Where,
Is a constant of proportionality, called the absorptivity.
Different molecules absorb radiation of different wavelengths. An absorption spectrum will show a number of absorption bands corresponding to structural groups within the molecule.
1.2.2.1 Beer - Lambert’s Law
(B.K Sharma, 2006; Robert D. Braun et al., 2006; Gurudeep R. Chatwal et al, 2008)
10 I0 = Ia + It + Ir
Where,
I0 = Incident light Ia = Absorbed light It = Transmitted light Ir = Reflected light
Lambert’s Law states “when a beam of light is allowed to pass through a transparent
medium, the rate of decrease of intensity with the thickness of the medium is directly proportional to the intensity of the light”.
-
It = I0 e-kt--- (1)
Beer’s Law states “The intensity of a beam of monochromatic light decreases
exponentially with the increase in concentration of the absorbing substance”.
-
It = I0 e -k’c
--- (2) (or)
By solving equations 1 and 2, on changing equations from natural logarithm, It = I0. 10-0.4343kt = I0 10-kt--- (3)
It = I0. 10-0.4343 k’c = I0-k’c --- (4) On combining equations 3 and 4,
It = I0 10-act
11
Where k and k' are constants, C is the concentration of the absorbing substance and t denotes thickness of the medium.
1.2.2.1.1 Limitations of Beer’s law
The linearity of the Beer-Lambert law is limited by chemical and instrumental factors. Causes of nonlinearity include:
Deviations in absorptivity coefficients at high concentrations (>0.01M) due to
electrostatic interactions between molecules in close proximity. Scattering of light due to particulates in the sample.
Fluorescence or phosphorescence of the sample.
Changes in refractive index at high analyte concentration. Shifts in chemical equilibrium as a function of concentration.
Non-monochromatic radiation, deviations can be minimized by using a
relatively flat part of the absorption spectrum such as the maximum of an absorption band.
Stray light.
1.2.2.1.2 Deviations from Beer’s law
According to Beer’s law, a straight line passing through the origin should be
12
The latter two are generally known as instrumental deviation and chemical deviation. a. Instrumental deviations
Stray radiation, Improper slit width, Fluctuation in single beam. b. Chemical deviations
Hydrolysis, Association, Polymerization, Ionization and Hydrogen bonding Deviations from Beer’s law can arise due to the following factors
1. Beer’s law will hold over a wide range of concentration provided the structure of coloured ion or of the coloured non electrolyte in the dissolved state does not change with concentration. If a coloured solution is having a foreign substance whose ions do not react chemically with the coloured components, its small concentration does not affect the light absorption and may also alter the value of extinction co - efficient.
2. Deviations may also occur if the coloured solute ions dissociates or associates.
3. Deviations may also occur due to the presence of impurities that fluorescence or absorb at absorption wavelength.
13
5. Deviations may occur if the width of slit is not proper and therefore it allows undesirable radiations to fall on the detector.
6. Deviations may occur if the solution undergoes polymerization.
7. Beer’s law cannot apply to suspensions but the latter can estimated calorimetrically after preparing a reference curve with known concentrations.
1.2.2.2 Choice of solvent (William Kemp, 2006)
A suitable solvent for ultraviolet spectroscopy should meet the following requirements.
(i) It should not itself absorb radiations in the region under investigation.
(ii) It should be less Polar so that it has minimum interaction with the solute molecule. Solvents used in UV spectroscopy.
S.No. Solvent Cut-off (nm)
1. Ethanol 205
2. Methanol 210
3. Acetonitrile 210
4. Hexane 210
5. Cyclohexane 210
6. Diethyl ether 220
7. Chloroform 245
14 1.2.2.3 Transitions in organic molecules
(Sharma Y.R, et al., 2009; Gurdeep R. Chatwal, et al., 2008)
The absorption in the ultraviolet region results in the transition of the valence electron form the ground level to the excited level. The three types of electron transitions are
Sigma (σ) electrons: These are involved in the formation of saturated bonds. The energy required for the excitation of the electrons is more than that of the UV radiations. Hence these electrons do not absorb near UV radiation.
Pi (π) electrons: These are involved in the formation of unsaturated bonds.
Example: Dienes, trienes and aromatic compounds. It absorbs radiation in near UV region.
Nonbonding (n) electrons: These are the lone pair of electrons present in atoms such as oxygen, nitrogen etc., in a molecule. They can be excited by both UV and Visible radiations.
The various types of transitions are σ →σ*
n→σ* π → π * n→π*
15
(http://www.pharmatutor.org/pharma-analysis/analytical-aspects-of-uv-visible-spectroscopy/types-of-electrone-transition.html)
The energy required for the various types of transitions are σ→σ* >n→σ* >π → π * > n→ π *
σ→σ* transitions
These transitions occur in saturated hydrocarbons with single bonds and no lone pair of electrons. The energy required for this type of transition is very high because of the strong sigma bond formed by the valence electrons. Thus, the transitions occur at very short wavelength. The saturated hydrocarbons such as methane, ethane, propane etc. absorbs at 126 -135 nm region of the UV region. Hence these compounds are used as solvents in UV spectroscopy.
n → σ* transitions
Saturated compounds with lone pair of electrons show n→σ* transitions in addition to σ→σ* transitions. The energy required for the n→σ* transition is lesser than the energy required for σ→σ* transitions. The energy required for n→σ*
16
π → π * transitions
These transitions occur in unsaturated compounds containing double or triple bonds and also in aromatic compounds. Lower energy is required for these transitions and hence a longer wavelength causes the excitation of the molecule.
n→ π*
transitions
These transitions occur in compound which contains oxygen, nitrogen, sulphur and halogens because of the presence of free lone pair of electrons. These transitions require least amount of energy and hence they occur in UV and Visible region. Saturated carbonyl compounds shows two types of transitions, low energy n→ π* transitions occurring at longer wavelength and high energy n→ π* transitions occurring at lower wavelength. The shifts in the absorption of the carbonyl compounds are due to the polarity of the solvent.
1.2.2.4 Instrumentation(Gurudeep R. Chatwal et al., 2008)
(http://www2.chemistry.msu.edu/faculty/reusch/virtTxtJml/Spectrpy/UVVis/uvspec. html)
All photometers, colorimeters and spectrophotometers have the following basic components
1.2.2.4.1 Radiation source
i) It must be stable.
ii) It must be of sufficient intensity for the transmitted energy to be detected at the end of the optical path.
iii) It must supply continuous radiation over the entire wavelength region in which it is used.
UV region
17 Visible region
The tungsten lamp and tungsten halogen lamp are the most common source of visible radiation.
1.2.2.4.2 Filters and Monochromators
The filters and Monochromators are used to disperse the radiation according to the wavelength.
1.2.2.4.2.1 Filters
A light filter is a device that allows light of the required wavelength to pass but absorbs light of other wavelengths wholly or partially. Thus, a suitable filter can be selecting a desired wavelength band. It means that a particular filter may be used for a specific analysis. If analysis is carried out for several species, a large number of filters have to be used and interchanged. This method is very useful for routine analysis.
Types of filters
Filters are two types, i) Absorption filters ii) Interference filters
Absorption filters work by selective absorption of unwanted wavelengths and are made up of solid sheet of glass, coloured by a pigment or dispersed in glass and dyed gelatin. Interference filters work by selective transmission of selected wavelengths and they are made up of semitransparent metal film deposited on a glass plate and coated with dielectric material.
1.2.2.4.2.2 Monochromators
18
entrance slit, a dispersing element (prim or gratings) and an exit slit. The entrance slit sharply defines the incoming beam of heterochromatic radiation. The dispersing element disperses the heterochromatic radiation into its component wavelengths whereas exit slit allows the nominal wavelength together with a band of wavelength on either side of it. The position of the dispersing element is always adjusted by rotating it to vary the nominal wavelength passing through the exit slit.
Types of Monochromators 1) Prisms
2) Gratings
A prism is made up of quartz (for UV region), glass (for visual range) and alkali halides (for IR). The main advantage of prisms is that they undergo dispersion giving wavelengths which do not overlap, but the main disadvantage is that they give non – linear dispersion. A grating consists of large number of parallel lines ruled on a highly polished surface like alumina. Generally, gratings are difficult to prepare therefore, replica gratings are prepared from an original grating. This is done by coating the original grating with a film of an epoxy resin which after setting is removed to yield replica. Then replica is made reflective by aluminizing its surface. Gratings give linear dispersion but they suffer from an overlap of spectral orders.
1.2.2.4.3 Sample cells
19
1.2.2.4.4 Detectors
Detectors used in UV-Visible spectrophotometers can be called as photometric detectors. In these detectors the light energy is converted to electrical signal which can be recorded. The types of detectors used are Barrier Layer cell (or) Photo Voltaic cell, Photo tubes (or) Photo emissive tubes, Photomultiplier tubes and Photo diode.
1.2.2.4.5 Recorders
Detectors transmits the amount of light absorbed by a particular chemical species and only by that species is desired and by correcting the absorbance of solvent and other species in the solution. The recorders record the spectrum without any interferences compared with blank and they are user friendly.
Schematic diagram of a single beam UV-Vis spectrophotometer
Schematic diagram of a dual-beam uv-vis spectrophotometer
20
rapid, precise, spectra of highly accurate and less time consuming. Spectrophotometric multi-component analysis can be applied where the drugs overlaps. In such cases of overlapping spectra, simultaneous equation can be framed to obtain the concentration of individual component otherwise multi-component analysis can be applied on any degree of spectral overlap provided that two or more spectra are not similar. The various spectroscopic techniques used for multi component analysis include
1. Simultaneous equation method 2. Absorption ratio method 3. Geometric correction method 4. Absorption correction method 5. Orthogonal polynomial method 6. Differential spectroscopy 7. Derivative spectroscopy 8. Area under curve method.
1.2.2.5 Different spectroscopic methods
The assay of an absorbing substance may be quickly carried out by preparing a solution in a transparent solvent and measuring its absorbance at a suitable wavelength. The wavelength normally selected is a wavelength of maximum
absorption (max), where small errors in setting the wavelength scale have little effects
on the measured absorbance.
1.2.2.5.1 Assay of substances in single component samples
21
Quantitative analysis (assay of an absorbing substance) can be done using following methods.
- Use of values
- Use of calibration graph (multiple standard method) - By single or double point standardization method.
1.2.2.5.1.1 Use of values
This method can be used for estimation of drug from formulations or raw material, when reference standard not available. The use of standard value avoids the need to prepare a standard solution of the reference substance in order to determine its absorptivity, and is of advantage in situations where it is difficult or expensive to obtain a sample of the reference substance.
1.2.2.5.1.2 Use of calibration graph
22 1.2.2.5.1.3 Single or double point standardization
The single point procedure involves the measurement of the absorbance of a sample solution and of a standard solution of the reference substance. The standard and the sample solution are prepared in similar manner; ideally the concentration of the standard solution should be close to that of the sample solution. The concentration of the substance in the sample is calculated using following formula.
Ctest = A test × Cstd / Astd
Where,
CtestandCstdare the concentration in the sample and standard solutions respectively.
Atest and Astdare the absorbance of the sample and standard solutions respectively.
In double point standardization, the concentration of one of the standard solution is greater than that of the sample while the other standard solution has a lower concentration than the sample. The concentration of the substance in the sample solution is given by
Where,
Cstdis the concentration of the standard solution.
Atest and Astdare the absorbance of the sample and standard solution respectively.
Std1 and Std2 are the more concentrated standard and less concentrated
23
1.2.2.5.2 Assay of substances in Multicomponent Samples
The spectrophotometric assay of drugs rarely involves the measurement of absorbance of samples containing only one absorbing component. The pharmaceutical analyst frequently encounters the situation where the concentration of one or more substances is required in samples known to contain other absorbing substances which potentially interfere in the assay. If the recipe of the sample formulation is available to the analyst, the identity and concentration of the interferants are known and the extent of interference is the assay may be determined. Alternatively, interference which is difficult to quantify may arise in the analysis of formulations from manufacturing impurities, decomposition products and formulation excepients. Unwanted absorption from this source is termed irrelevant absorption and, if not removed, imparts a systematic error to the assay of the drug in the sample.
The basic of all the spectrophotometric techniques for multicomponent samples is the property that at all wavelengths:
a. The absorbance of a solution is the sum of absorbance of the individual components, or
b. The measured absorbance is the difference between the total absorbance of the solution in the sample cell and that of the solution in the reference (blank) cell. The various spectroscopic techniques used for multi-component analysis are the fallowing
1. Simultaneous equation method 2. Absorption ratio method 3. Geometric correction method
24 6. Differential spectroscopy
7. Derivative spectroscopy 8. Area under curve method.
1.3 CHROMATOGRAPHY (Sharma B.K., 2000; Gurdeep R. Chatwal et al., 2007) Chromatography may be regarded as “an analytical technique employed for the purification and separation of organic and inorganic substances”. It is also found
useful for the fractionation of complex mixture and separation of closely related compounds such as isomers and isolation of unstable substances. Chromatography technique is based on the difference in the rate at which the components of a mixture move through a porus medium (stationary phase) under the influence of some solvent or gas (mobile phase).
The chromatographic method of a separation in general involves the following steps:
a. Adsorption or retention of a substance or substance on the stationary phase. b. Separation of the adsorbed substance by the mobile phase.
c. Recovery of the separated substance by a continuous flow of the mobile phase. The method being called elution.
d. Quantitative and qualitative analysis of the eluted substance. 1.3.1 Types Of Chromatography
(http://www.buzzle.com/article/types-of-chromatography.html)
25
different criteria of classification of chromatography discussed below, the basic criterion is the purpose for which this process is carried out. On the basis of this criterion, the process of chromatography is classified into analytical and preparative. The former is carried out for the purpose of measuring the amount of an analyte present in a mixture. On the other hand, preparative chromatography is used for separating the components of a mixture for their further use. Depending on the techniques used in chromatography, the process is broadly classified as adsorption and partition chromatography.
1.3.1.1 Adsorption chromatography
In this form of chromatography, the chemical mixtures in question are passed over an adsorbent bed. Different compounds present in the mixture get adsorbed on the bed at different rates. This process is mostly carried out for analytical separation. Adsorption chromatography is further divided into 'affinity' and 'ion-exchange' chromatography.
1.3.1.2 Ion-exchange chromatography
The mechanism of ion-exchange which is used in this form of chromatography allows carrying out the segregation of analytes. This kind of segregation/separation can be performed in 2 different modes, i.e. planar and column. Separation of charged compounds like peptides, amino acids, proteins, etc. takes place through a charged stationary phase.
1.3.1.3 Column chromatography
26 1.3.1.4 Planar chromatography
The stationary phase is placed on a plane surface. The set-up is unlike the one used in column chromatography where stationary phase is placed in a column. Here, a plane surface is used. The plane surface could be anything from paper to glass.
1.3.1.5 Affinity chromatography
The non-covalent interaction which takes place between the analyte in question and certain molecules is the basis of working of affinity chromatography. Purification of proteins bound to tags is conducted with this technique.
1.3.1.6 Partition chromatography
In this separation technique, components of the given mixture are separated through the use of partition of a solute between two solvents. In the process, one of the solvents is immobilized by means of a substance present in the filter paper or column.
1.3.1.7 Gel Filtration chromatography
This technique is also known as gel permeation or size exclusion chromatography. Molecules of the mixture in question are separated on the basis of their size. Technically speaking, the process of separation is carried out on the basis of hydrodynamic diameter (size) of molecules. Larger molecules of the mixture are unable to enter the pores of media; therefore, molecules are washed out quickly. On the other hand, smaller molecules take more time to elute because they are able to enter the pores of media.
1.3.1.8 High performance liquid chromatography
27
high performance liquid chromatography includes a pump (used for moving the mobile phase and analyte through the column), stationary phase and a detector. Retention time for the analyte is also provided by the detector. Depending on the strength of interactions taking place between the analyte and stationary phase, retention time can vary.
1.3.1.9 Gas chromatography
This form of chromatography uses cylinders wherein gas is stored under pressure. These gases do the work of carrying the solute. The carrier gas that is commonly used in this chromatography is helium. Flame ionization detectors and thermal conductivity are used in gas chromatography. There are three sub-types of gas chromatography which include the following: gas-liquid chromatography, gas adsorption chromatography and capillary gas chromatography. In gas-liquid chromatography, an inert porous solid is used as the stationary phase. The stationary phase used in gas chromatography is a bed formed by an adsorbent. In capillary gas chromatography, the adsorbents form a layer on fused silica or glass which line the capillary walls.
1.3.1.10 Pyrolysis gas chromatography
28 1.3.1.11 Reverse-phase chromatography
This technique employs a method which is just opposite to that of normal phase chromatography. In reverse-phase chromatography, the stationary phase is made up of hydrophobic compounds; they attract the hydrophobic compounds present in the mobile phase. Here, the polarity of mobile phase is reduced in order to allow the hydrophobic molecule to elute. The technique of chromatography which is meant for separation of compounds from mixtures thus, holds immense importance in fields like biochemistry, biotechnology and many others. An attempt to list as many types of chromatography as possible is made in this write-up.
1.3.2 High Performance Liquid Chromatography (Sharma B.K., 2006)
The high performance liquid chromatography is thus a method of separation in which the stationary phase is contained in a column, one end which is attached to a source of pressurized liquid eluent (mobile phase).
The choice of mobile phase is very important in HPLC and the eluting power of the mobile phase is determined by it’s over all polarity of the stationary phase and
the nature of sample components. For normal phase separations the eluting power increases with increasing polarity of the solvent, but for reversed phase separations, eluting power decreases with increasing solvent polarity.
1.3.2.1 HPLC separation modes
(http://www.justchromatography.com/chromatography/hplc-separation-modes)
Chromatographic
Mode Abrv.
Column
Type Mobile Phase Application
Reverse-phase chromatography
RPC Non-polar (e.g. C18)
Polar mixture of water and organic solvent (e.g.
29 Chromatographic
Mode Abrv.
Column
Type Mobile Phase Application acetonitrile)
Normal-phase chromatography
NPC Polar ( e.g. unbonded silica)
Less-polar (than stationary phase) mixture of organic solvents (e.g. hexane,
ethyl ether,
chloroform,
methylene chloride)
Water-insoluble samples, isomer separation, and preparative HPLC
Non-aqueous reverse-phase chromatography
NARP Non-polar (e.g. C18)
Mixture of organic solvents (e.g. ACN + methylene chloride) Very hydrophobic samples Hydrophilic interaction chromatography
HILIC Polar (e.g. silica or amide-bonded)
Mixture of water organic solvents (e.g. ACN + H2O
Highly polar samples that are poorly retained by reverse-phase mode
Ion-exchange chromatography
IEC Usually an organic resin that has charged groups able to bind ions of opposite charge
Aqueous solution of a salt with buffer.
Separating ionizable
samples, large biomolecules (e.g. proteins, carbohydrates)
Ion-pair
chromatography
IPC Non-polar (e.g. C18)
Polar mixture of water and organic solvent (e.g. ACN) w/ an ion-pairing reagent (e.g. alkylsulfonates, trifluoroacetic acid) that interacts w/ sample ions of opositecharge
Acids and bases that are weekly retained by reverse-phase
Size-exclusion chromatography
SEC Inert Aqueous or organic Large
biomolecules, polymers.
30 Chromatographic
Mode Abrv.
Column
Type Mobile Phase Application molecular weight.
1.3.2.2 Elution techniques (Sharma B.K., 2006)
Two types of elution techniques generally used. They are, i) Isocratic elution
One particle solvent or mixture is pumped through the whole analysis. ii) Gradient elution
For some determinations the solvent composition may be altered gradually gradient elution system can be classified as low pressure and high pressure system. In low pressure gradient elution system the eluent components are miner proportion varying with time at low pressure and the mixture is pumped in order to be delivered at high pressure to the column. In high pressure gradient elution system components or mixtures of fixed composition are each pumped by separate pump and then mixed at high pressure in a ratio varying with time.
1.3.2.3 HPLC stationary phases (Robert D. Braun, 1986)
31
pellicle is a thin layer or coating on a surface generally the pellicles used for HPLC have thickness about 1µm on glass beds which have diameter about 40mm.
Mobile phases
In HPLC, for solid adsorbent and liquid stationary phases (both normal and reverse phase) mixed solvents are used as the mobile phase .Generally the mobile phase consists of a mixture of polar solvents such as alcohol and non-polar solvents such as hydro carbons.
The mobile phase must be chosen so as not to interfere with the measurement by the detector. For example, if an UV absorption detector is used the solvent cannot absorb UV radiation. Mixtures of methanol, ethanol or propanol with heptane and of chloroform with heptane are popular choices of HPLC mobile phase.
1.3.2.4 Instrumentation(Willard et al., 1986)
The general instrumentation for HPLC incorporates the following components:
i. Mobile phase reservoir pump ii. Injector
iii. Column iv. Detector and Data system
32
1.3.2.4.1 Mobile phase reservoir pump
The mobile phase must be delivered to the column over a wide range of flow rates and pressures to permit the use a wide variety of organic and inorganic solvents. The pump it seals and all connections must be made of materials chemically resistant to the mobile phase. A degasser is needed to remove the dissolved air and other gases from the solvent. Another desirable feature is the solvent delivery system is the capability for generating a solvent gradient.
In HPLC pump should be able to operate to at least 100atm (1500 psi). A pressure suited to less expensive chromatographs however, 400atm (6000psi) is a more desirable pressure limit.
Standard HPLC pump requirements are, a. Flow rate range 0.01 to 100 ml/ min. b. Pressure range: 1 to 5000 psi.
c. Flow rate stability not more than 1% d. Pressure pulsations less than 1% The types of pumps used are,
1. Reciprocating Piston Pumps 2. Syringe-Type Pumps
3. Constant-Pressure Pumps
The common problems in pumping liquids are, a. Solvent degassing
33
1.3.2.4.2 Injectors
In liquid chromatography, liquid samples may be injected directly and solid samples need only be dissolved in an appropriate solvent. The solvent need not be the mobile phase, but frequently it is judiciously chosen to avoid detector interference, column/component interference and loss in efficiency or all of these. It is always best to remove particles from the sample by filtering or centrifuging since continuous injections of particulate material will eventually cause blockage of injection devices or columns. Standard HPLC injector should be accurate in injecting volume in the range of 0.1 to 100 ml with high reproducibility and under high pressure (up to the 4000 psi) and should produce minimum band broadening and should minimize possible flow disturbances.
1.3.2.4.3 HPLC Columns
34
compounds can be used to make chiral HPLC stationary phases and may even be used as (disposable) HPLC solvents.
Different types of columns are used. They are, 1. Analytical column
2. Short column
3. Narrow bore column 4. Guard column 5. Inline filters
Analytical column variables are as follows: a. Length (10-30 cm)
b. ID (4-10 mm)
c. Packing (many kinds) d. Particles sizes (3-10 μm)
e. Most common columns 250mmx4.6mm i.e. with 5μm particle size.
35
1.3.2.4.4 Detectors
Optical detectors are most frequently used. Current LC detectors have wide dynamic range normally allowing both analytical and preparative scale runs on the same instrument.
Basic detector requirements
An ideal LC detector should have the following properties:
1. Low drift and noise level (particularly crucial in trace analysis). 2. High sensitivity.
3. Fast response.
4. Wide linear dynamic range (this simplifies quantification). 5. Low dead volume (minimal peak broadening).
6. Cell design which eliminates remixing of the separated bands.
7. Insensitivity to changes in type of solvent, flow rate, and temperature. 8. Operational simplicity and reliability.
9. It should be tunable so that detection can be optimized for different compounds.
On-line detectors
A. Refractive index.
B. UV/Visible Fixed wavelength. C. UV/Visible Variable wavelength. D. UV/Visible Diode array.
E. Fluorescence. F. Conductivity.
36 Off-line detector
A. FTIR spiral disk monitor. Noise and drift
The problem is to distinguish between the actual component and artifact caused by the pressure fluctuation, bubble, compositional fluctuation, etc. If the peaks are fairly large, one has no problem in distinguishing them. However, the smaller the peak, the more important is that the baseline be smooth, free of noise and drift. Baseline noise is the short time variation of the baseline from a straight line. Noise is normally measured "peak-to-peak": i.e., the distance from the top of one such small peak to the bottom of the next. Noise is the factor which limits detector sensitivity. In trace analysis, the operator must be able to distinguish between noise spikes and component peaks. The baseline should deviate as little as possible from a horizontal line. It is usually measured for a specified time, e.g., 1/2 hour or one hour and called drift. Drift usually associated to the detector heat-up in the first hour after power-on. Data systems
The main goal in using electronic data systems is to increase analysis accuracy and precision while reducing operator attention. In routine analysis, where no automation is needed, a pre-programmed computing integrator may be sufficient. For higher control levels, a more intelligent device is necessary, such as a data station or minicomputer.
The advantages of intelligent processors in chromatographs are,
Additional automation options become easier to implement.
Complex data analysis becomes more feasible.
Software safeguards can be designed to reduce accidental misuse of the
37
1.3.2.6 Summary of HPLC operation (Dong., 2006) 1. Filter and degas mobile phase.
2. Prime pump, rinse column with strong solvents and equilibrate column. 3. Purge injection and make sure there are no air bubbles in the sample syringe. 4. Perform system suitability test.
5. Analyze sample.
6. Process and report data.
7. Rinse column and shut down pump and lamps. 1.3.2.7 Checking for problems (Lloyd R.Snyderet al., 1997)
As method development proceeds, various problems can arise, some of which are listed below.
Problems Comments
Low plate numbers Poor choice of column, poor peak shape effect. Column variability Poor choice of column, secondary retention effect. Short column life Poor choice of column, need for sample pretreatment. Retention drift Insufficient column equilibration, need for sample
pre-treatment, loss of bonded phase. Poor quantitative
precision
Need for better calibration.
1.3.2.8 HPLC method development (LloydR.Snyder et al., 1997)
38
Selection of the HPLC method and initial system
Selection of initial conditions
Selectivity optimization
System optimization
Method validation Quantitative analysis
The four primary techniques for quantitation are a. Normalized peak area
b. External standard calibration method c. Internal standard calibration method d. method of standard addition
a.Normalized peak area
39
b. External standard calibration method
The most general method for determining the concentration of an unknown sample is to construct a calibration plot using external standards. Standards solutions are prepared at known concentrations. A fixed volume of each standard solution is injected and analyzed, and the peak responses are plotted Vs concentration. The standard solutions are referred to as external standards, since they are prepared and analyzed in separate chromatograms from those of the unknown samples. Unknown samples are then prepared, injected and analyzed exactly in the same manner.
c. Internal standard calibration method
Another technique for calibration involves the addition of an internal standard to the calibration solutions and samples. The internal standard is a different compound form the analyte, but one that is well resolved in the separation. The internal standard can compensate for changes in sample size or concentration to instrumental variations. With the internal standard method, a calibration plot is produced by preparing and analyzing calibration solutions containing different concentration of the compound of interest with a fixed concentration of the internal added.
The Internal standard comply the following requirements:
i. Well resolved from the compound of interest and other peaks. ii. Similar retention (k) to the analyte.
iii. Should not be in the original sample.
iv. Should mimic the analyte in any sample preparation steps. v. Does not have to be chemically similar to analyte.
vi. Commercially available in high purity.
40
viii. Should have similar detector response to the analyte for the concentration used.
d. Method of standard addition
A calibration standard ideally should be prepared in a blank matrix of drug formulation components without the drug substance or an animal without added compound usually can be used for standard calibration solutions. The method of standard addition is most often used in trace analysis. In this approach, different weights of analyte(s) are added to the sample matrix, which initially contains an unknown concentration of the analyte. Extrapolation of a plot of response found for the standard addition calibration concentration to zero concentration defines the original concentration in the un spiked sample.
1.3.2.9 System Suitability Parameters
(Lloyd R.Snyder, 1997; Beckette and Stenlake, 2007)
System suitability testing is an integral part of many analytical procedures. The tests are based on the concept that the equipment, electronics, analytical operations, and samples to be analyzed constitute an integral system that can be evaluated as such. System suitability test parameters to be established for a particular procedure depend on the type of procedure being validated.
The parameters that are affected by the changes in chromatographic conditions are,
Column capacity factor (K1)
Resolution (Rs)
Selectivity ()
Column efficiency (N) and
Peak asymmetry factor (As)
41 Column capacity factor (K1)
The retention of a drug with a given packing material and eluent can be expressed as retention time or retention volume, but both of these are dependent on flow rate, column length and column diameter. The retention is best described as a column capacity ratio (K), which is independent of these factors. The column capacity ratio of a compound (A) is defined as
0 0 A 0 0 A A
t
t
t
V
V
V
K
Where,
VA = Elution volume of A
V0 = Elution volume of a non-retained compound (void volume)
At constant flow rate, retention times (tA and to) can be used instead of retention volumes. Retention data is sometimes expressed, relative to a known internal standard (B). The ratio of retention times (tA/tB) can be used, but the ratio of
adjusted retention times
o B o At
t
t
t
is better when data need to be transferred
between different chromatographs.
The values of ‘k’ of individual bands are increase or decrease with changes in
solvent strength. In reversed phase HPLC, solvent strength increases with the increase in the volume of organic phase in the water / organic mobile phase. Typically an increase in percentage of the organic phase by 10 % by volume will decrease k’ of the
42 Resolution (Rs)
The resolution, Rs of two neighbouring peaks is defined by the ratio of the distance between the two peak maxima. It is the difference between the retention times of two solutes divided by their average peak width. For baseline separation, the ideal value of Rs is 2.0. It is calculated by using the formula,
)
W
W
(
5
.
0
Rt
Rt
R
2 1
1 2
f
Where,
43 Selectivity ()
The selectivity (or separation factor), , is a measure of relative retention of
two components in a mixture. The ideal value of selectivity is 2. It can be calculated by using the formula,
0 1 0 2
V
V
V
V
Where, V0 is the void volume of the column and V2 and V1 are the retention volumes of the second and the first peak, respectively.
Column efficiency
Efficiency, N, of a column is measured by the number of theoretical plates per meter. It is a measure of band spreading of a peak. Smaller the band spread, higher is the number of theoretical plates, indicating good column and system performance. Columns with N ranging from 5,000 to 100,000 plates/meter are ideal for a good system. Efficiency is calculated by using the formula,
2 2 16 W Rt N Where,
44 Peak asymmetry factor (As)
Peak asymmetry factor, Ascanbe used as a criterion of column performance. The peak half width b of a peak at 10 % of the peak height, divided by the corresponding front half width a gives the asymmetry factor.
a
b
A
S
Tailing factor (T)
The tailing factor T, a measure of peak symmetry, is unity for perfectly symmetrical peaks and its value increases as tailing becomes more pronounced.
In some cases, values less than unity may be observed. As peak asymmetry increases,integration, and hence precision becomes less reliable.
Where,
W0.05 = width of peak at 5% height
f = Distance from the peak maximum to the leading edge of the peak, the distance being measured at a point 5% of the peak height from the baseline. Limit ≤ 2 is preferable.
Height Equivalent to a Theoretical Plate (HETP)
A theoretical plate can be of any height, which decides the efficiency of separation. If HETP is less the column is more efficient. If HETP is more, the column is less efficient. The height equivalent to a theoretical plate (HETP) is given by
45
1. VALIDATION (Michael E. Swartz et al., 2009) The validation is divided into different types. They are, Prospective Validation
This method is employed when historical data of the product is not available or is not sufficient and in process and finished product testing is not adequate to ensure reproducibility or high degree of compliance to product likely attributes. Retrospective Validation
This provides trend of comparative result (i.e.) review and evaluation of existing information for comparison when historical data is sufficient and readily available.
Concurrent Validation
Based on information generated during implementation of a system for this extensive testing and monitoring are performed as part of initial run of the method. Re-Validation
Revalidation provides the evidence that changes in a process and are the process environment, introduced either intentionally or unintentionally, do not adversely affect process characteristic and product quality.
There are two basic categories of revalidation. Revalidation in case of known change (including transfer of process from one company to another or from one site to another). Periodic revalidation carried out at scheduled intervals.
Reasons/Purpose of Validation
Setting standards of evaluation procedures.
Taking appropriate action in case of non-compliance.
Retrospective validation is useful for trend comparison of results compliance
46
Closer interaction with pharmacopoeia forum to address analytical problems.
Enables scientist to communicate scientifically and effectively on technical matters.
1.4.1 Analytical Parameters Used In Assay Validation As Per ICH Guidelines (Code Q2A; Q2B, ICH Guidelines 1994 and 1996)
The objective of validation of an analytical procedure is to demonstrate that it is suitable for its intended purpose. A tabular summation of the characteristics applicable to identification, control of impurities and assay procedures is included. Types of Analytical Procedures to be validated
The discussion of the validation of analytical procedures is directed to the four most common types of analytical procedures
Identification Tests
Quantitative tests for impurities content.
Limit tests for the control of impurities.
Quantitative tests of the active moiety in samples of drug substance or drug
product or other selected component(s) in the drug product.
A brief description of the types of tests considered in this document is provided below.
Identification tests are intended to ensure the identity of an analyte in a sample this is normally achieved by comparison of a property of the sample (example spectrum, chromatographic behavior, chemical reactivity etc.) to that of a reference standard.
47
characteristics of the sample. Different validation characteristics are required for a quantitative test than for a limit test.
Assay procedures are intended to measure the analyte present in a given sample. In the context of this document, the assay represents a quantitative measurement of the major component(s) in the drug substance. For the drug product, similar validation characteristics also apply when assaying for the active or other selected component(s). The same validation characteristics may also apply to assays associated with other analytical procedures.
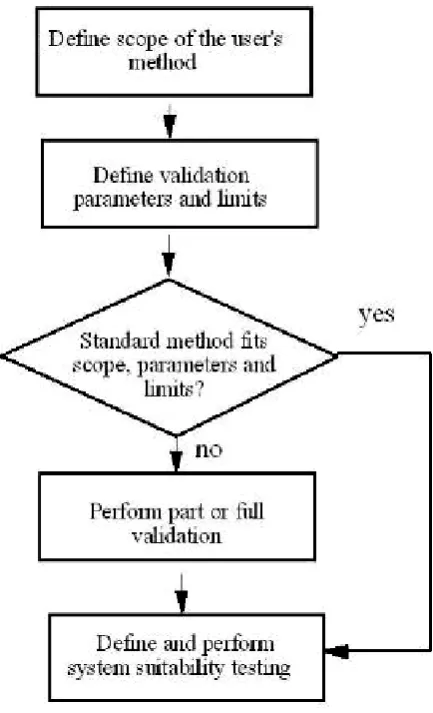
[image:60.595.216.433.352.709.2]The objective of the analytical procedure should be clearly understood since this will govern the validation characteristics which need to be evaluated.
48 Typical Validation Parameters
Accuracy
Precision
Range
Specificity
Linearity
Detection Limit
Quantification Limit
Ruggedness
Robustness
Accuracy
The accuracy of an analytical procedure expresses the closeness of agreement between the value which is accepted either as a conventional true value or on an accepted reference value and the value found.
Precision
It expresses as degree of agreement among individual test results when procedure or method is applied to a homogeneous sample, usually expressed as SD or RSD. It is a measure of degree of repeatability or reproducibility under normal conditions. A more comprehensive definition proposed by the ICH divides precision into three types
1. Repeatability.
49 Range
The range of a method can be defined as the upper and lower concentrations for which the analytical method has adequate accuracy, precision and linearity. The range of concentrations examined will depend on the type of method and its use. Specificity
Ability of the method to measure accurately and specifically the analyte of interest in presence of matrix and other components likely to be present in the sample matrix and impurities, degradation products and other related substances. For this, one may compare the test results of analysis of samples containing other ingredients or impurities or degradation products or related substances or placebo ingredients with those obtained from analysis of sample without these, i.e., the method must allow distinct analytical measurement of analyte of interest and exclusion of all other relevant interferences. If the impurities or degradation products or potential contaminants are not available one can apply a proposed method to the strain and stress (heat, light, humidity) samples. Degree of agreement among results will explain specificity of the method. If the impurities or degradation products are not available, one may carryout additional purity tests by chromatography-HPLC or HPTLC.
Linearity
50 Detection limit
The Detection Limit of an individual analytical procedure is the lowest amount of analyte in a sample which can be detected but not necessarily quantities as an exact value. The detection limit (LOD) may be expressed as
Where,
= the standard deviation of the response.
S = the slope of the calibration curve (of the analyte). Quantification limit
LOQ is defining as the lowest concentration of the substance (analyte) in a sample that can be estimated quantitatively with acceptable precision, accuracy and reliability by a given method under stated experimental conditions. Quantification Limit (LOQ) may be expressed as
Where,
= the standard deviation of the response.
S = the slope of the calibration curve (of the analyte). Ruggedness