University of Southern Queensland
Faculty of Engineering and Surveying
Human Electromagnetic Radiation
Exposure
A dissertation submitted by
Mr. Simon Paech
In fulfilment of the requirements of
Courses ENG4111 and 4112 Research Project
Towards the degree of
Bachelor of Engineering/Bachelor of Science
Majoring in Electrical and Electronics/ Physics
Abstract
The high levels of electromagnetic radiation are a concern today with such large growth in the industries of telecommunications and media broadcasting. The concerns lead to an investigation into the theory of electromagnetic radiation and an application of the theory into a practical outcome around the University of Southern Queensland. Scans were conducted around the University of Southern Queensland (USQ) campus, Toowoomba, measuring the levels of non-ionising radiation from 30MHz to 1GHz. These scans were made using a broadband antenna and a spectrum analyser.
The measurements conducted around the USQ campus underwent analysis of how each site, and signal frequency, affected the exposure within that area as well as many other characteristics of the measured signals. This was to investigate the possible methods of minimising exposure if long-term radiation risks were a concern. The conclusions of this study showed lower amplitudes of measured exposure indoors, when compared with outdoors and determining a number of sites of higher and lower exposures located around the USQ campus.
The peak values of the scans were compared to the Australian Standards, of 0.08W/kg, for general public exposure to signals from distant sources. The largest recorded experimental result was in the magnitude of 106 times smaller than the standard restriction. This eliminated concern for any short-term heating effects which have been discovered for levels above the Australian Standards.
The long-term effects of non-ionising electromagnetic radiation within the range of testing has not been conclusively found to have any known health risks, but also has not been able to be concluded as safe. The many studies which have been conducted discovered both positive and negative results from a number of possible effects such as cancer, behavioural changes, pregnancy difficulties, epidemiological concerns and cognitive ability to name a few.
Difficulties in research are attributed to the difficulties of finding long-term exposure incidences, or recreating these situations in controlled environments. One study which was able to determine no increased risk of cancer, or increase in the rate of rare cancers was a study of the Denmark cancer registry and mobile phone registry which was a nationwide study of over 420,000 observed cases. This study covered the largest sample size seen for a study in this field and had cancer statistics of up to 25 years mobile phone exposure.
University of Southern Queensland
Faculty of Engineering and Surveying
ENG4111 Research Project Part 1 &
ENG4112 Research Project Part 2
Limitations of Use
The Council of the University of Southern Queensland, its Faculty of Engineering and Surveying, and the staff of the University of Southern Queensland, do not accept any responsibility for the truth, accuracy or completeness of material contained within or associated with this dissertation.
Persons using all or any part of this material do so at their own risk, and not at the risk of the Council of the University of Southern Queensland, its Faculty of Engineering and Surveying or the staff of the University of Southern Queensland.
This dissertation reports an educational exercise and has no purpose or validity beyond this exercise. The sole purpose of the course "Project and Dissertation" is to contribute to the overall education within the student’s chosen degree programme. This document, the associated hardware, software, drawings, and other material set out in the associated appendices should not be used for any other purpose: if they are so used, it is entirely at the risk of the user.
Professor Frank Bullen
Dean
Certification
I certify that the ideas, designs and experiment work, results, analyses and conclusions set out in this dissertation are entirely my own effort, except where otherwise indicated and acknowledged.
I further certify that the work is original and has not been previously submitted for assessment in any other course or institution, except where specifically stated.
Simon Paech
Student Number: 0050009678
Acknowledgements
I would like to acknowledge the help and support by Terry Byrne and Brett Richards. Their efforts greatly helped during the project and especially during experimentation. The help they provided acquiring, setting up, troubleshooting and maintaining the equipment was invaluable. The knowledge which was also provided was of great benefit for this experimentation.
I would also like to acknowledge the helpful staff on campus which supported this project through the experimentation, allowing access to many areas and not being concerned by any inconveniences which the large equipment caused.
Lastly I wish to acknowledge David Parsons. As my supervisor I found his help invaluable and this project would have been much more difficult without his mentorship. His organisation, knowledge and previous work on the equipment gave an easy introduction into the experiment which saved days of on-campus time.
Table of Contents
Title Page Page i
Abstract Page ii
Limitation of Use Page iii
Certification Page iv
Acknowledgements Page v
Table of Contents Page vi
List of Figures Page x
List of Tables Page xiii
Glossary of Terms Page xiv
Chapter 1 – Introduction Page 1
Chapter 2 – Review of Theory Page 2
2.1 Electromagnetic Definition Page 2
2.1.1 Electromagnetic Waves Page 2
2.1.2 Electromagnetic Fields/Radiation Page 3 2.2 Electromagnetic Production and Sources Page 5
2.2.1 Natural Electromagnetics Page 5
2.2.1.1 The Sun Page 5
2.2.1.2 The Earth Page 5
2.2.1.3 Magnets and Static Page 6
2.2.2 Man-Made Electromagnetics Page 6
2.2.2.1 Accidental Radiation Page 6
2.2.2.2 EM Leakage in this Project Page 7
2.2.2.3 About Deliberate Radiation Page 7 2.2.2.4 Instrumentation Applications Page 7
2.2.2.5 Medical Applications Page 8
2.2.2.6 Science and Engineering Research Page 8 2.2.2.7 Wireless Integration Applications Page 8 2.2.3 Electromagnetic Signal Transmission Page 9 2.2.3.1 Signal Production Introduction Page 9
2.2.3.2 Antenna Theory Page 9
2.2.4 Shielding and Types of Protection Page 13
2.2.4.1 Minimisation Protection Page 13
2.2.4.2 Relocation Protection Page 14
2.2.4.3 Shielding Protection Page 15
2.2.4.4 Other Design Options Page 16
2.2.4.5 Why Protect Page 16
2.2.5 Electromagnetic Industries Today Page 17 2.2.6 Electromagnetic Sources for this Dissertation Page 18 2.2.6.1 AM Radio Signals and AC Power Page 18
2.2.6.2 FM Radio Signals Page 19
2.3 History and Development Page 21
2.3.1 Early History Page 21
2.3.2 Radio Development Page 21
2.3.3 Television Development Page 22
2.3.4 Mobile Phone Development in Australia Page 23
2.3.5 Today’s EM Developments Page 24
2.4 Health Concerns and Study of EM Radiation Page 25 2.4.1 Health Concerns with EM Radiation Page 25
2.4.1.1 Ionising Radiation Page 25
2.4.1.2 Non-Ionising Radiation Page 25
2.4.1.3 Current Concerns Page 26
2.4.2 Private Scientific Studies Page 27
2.4.2.1 Previous Health Based Study Review Page 27 2.4.2.2 Cellular Telephones and Cancer – a
Nationwide Cohort Study of Denmark Page 28 2.4.2.3 Meta-analysis of long-term mobile phone use
and the Association with Brain Tumours Page 29 2.4.3 Government and Association Research Page 30 2.4.3.1 Australian Electromagnetic Energy
(EME) Program Page 30
2.4.3.1.1 Stage One Page 30
2.4.3.1.2 Stage Two Page 31
2.4.3.1.3 Stage Three Page 31
2.4.3.2 World Health Organisation (WHO) Page 32 2.4.3.3 International Commission for Non-Ionising
Radiation Protection (ICNIRP) Guidelines Page 32
2.4.4 Scientific Conclusions Page 33
2.5 Authorities and Standards Page 35
2.5.1 Standards Authorities and Organisations Page 35 2.5.1.1 International Commission of Non-Ionizing
Radiation Protection (ICNIRP) Page 35
2.5.1.2 Australian Radiation Protection and
Nuclear Safety Agency (ARPANSA) Page 36 2.5.1.3 Australian Communications and Media
Authority (ACMA) Page 37
2.5.2 Standard Documentation Page 38
2.5.2.1 Current ARPANSA Standards Page 38
2.5.2.2 The ARPANS Act Page 39
2.5.2.3 ICNIRP Guidelines Page 39
2.5.2.4 Previous Australian Standards Page 40
2.5.3 The Standards Page 41
2.5.3.1 The Standard Values Page 41
2.6 Public Perception and the Media Page 44
2.6.1 Media Articles Page 44
2.6.2 Public Perception Page 45
2.6.3 Recommendations for those Concerned Page 46 2.7 Background Information on Project Page 47
2.7.1 Project Description Page 47
2.7.2 Project Requirements Development Page 47
2.7.3 Ethics and Consequences Page 48
2.7.4 Engineers Australia: Code of Ethics Page 49
2.7.5 Safety Analysis Page 50
2.7.5.1 Electrical Exposure Page 50
2.7.5.2 Acid Exposure Page 51
2.7.5.3 Cuts, Scrapes, Drops and Accidents Page 51 2.7.5.4 Electromagnetic Radiation Exposure Page 51
2.7.5.5 Ergonomic Stresses Page 52
Chapter 3 – Experimental Methodology Page 53
3.1 Experiment Preparation Page 53
3.1.1 Equipment Details Page 53
3.1.1.1 Rohde and Schwarz – HL562
Ultralog Antenna Page 54
3.1.1.2 Rohde and Schwarz – ESPI 7 Test Receiver Page 55
3.1.2 Location Details Page 57
3.1.2.1 Z Block Electronics Laboratory Page 59 3.1.2.2 Z Block Administration Offices Page 60
3.1.2.3 H Block Lecture Hall Page 60
3.1.2.4 Z Block Oval Page 60
3.1.2.5 The Quadrangle Page 60
3.1.2.6 S Block 5th Floor Foyer Page 60
3.1.2.7 The Refect Page 61
3.1.2.8 GSM Mobile Transmission Antenna Page 61
3.1.2.9 Public Park Page 61
3.1.3 Testing Methods and Location Confines Page 61
3.1.4 Test Day Page 62
3.2 Experimentation Page 63
3.2.1 Experimentation Discussion Page 63
3.2.1.1 Day One Page 63
3.2.1.2 Day Two Page 63
3.2.1.3 Day Three Page 64
3.2.1.4 Day Four Page 64
3.2.1.5 Day Five Page 65
3.2.2 Further Experimentation Page 65
3.3 Implementation Page 67
3.3.1 Implementation Discussion Page 67
3.3.2 Calculations and Scientific Theory Page 67
3.3.2.1 SAR measured in W/kg Page 68
3.3.2.2 Power Density in W/m2 Page 69
3.3.2.4 Additional SAR information Page 70
3.3.3 Expected Results Page 72
Chapter 4 – Results and Results Analysis Page 75
4.1 Raw Data Page 75
4.1.1 A Note on Scans Page 77
4.2 Maximum Values Page 78
4.2.1 Discussion of Maximum Values Page 78
4.2.2 Highest Value Compared to the Standards Page 79
4.2.3 Max Value Conclusion Page 80
4.3 Site Comparisons Page 81
4.3.1 Comparison Theory Page 81
4.3.1.1 Laboratory Tests Page 81
4.3.1.2 Lecture Hall Tests Page 82
4.3.1.3 Z Block Office Tests Page 83
4.3.1.4 Z Block Oval Tests Page 84
4.3.1.5 Quadrangle Tests Page 85
4.3.1.6 Refect Tests Page 86
4.3.1.7 S Block 5th Floor Tests Page 87
4.3.1.8 GSM Transmission Tests Page 88
4.3.1.9 Public Park Tests Page 88
4.3.2 Comparisons between Sites Page 89
4.3.2.1 Number of Peaks between Locations Page 89 4.3.2.2 Amplitude Fluctuations within Sites Page 92 4.3.2.3 Comparison of Single Signals over All Sites Page 97 4.3.2.4 Comparison of Sites, Viewing All Signals Page 98 4.3.2.5 Average Amplitude Variations between Sites Page 98 4.3.3 Patterns and Trends between Sites Page 99 4.3.3.1 102.7MHz S Block Transmission Antenna Page 100 4.3.3.2 Overall Amplitude Trends Page 100 4.3.3.3 91.4MHz, 619MHz and 655MHz
Signal Comparisons Page 100
4.3.3.4 Final Notes Page 101
4.3.4 Polarisation Differences Page 101
4.3.5 Dipole Signal Analysis Page 107
Chapter 5 – Project Discussion Page 110
5.1 Results Discussion Page 110
5.2 Experiment Discussion Page 113
5.3 Future Experiment Recommendations Page 114
Chapter 6 – Conclusion Page 115
Appendix A – Project Specifications Page 116
Appendix B – Project Selection Description Page 117
List of Figures
Figure Name Page
2.1 Picture of unpolarised light becoming polarised. 02
2.2 The Electromagnetic Spectrum 03
2.3 Electric Fields in the Vicinity of an Oscillating Dipole 10 2.4 Gain Characteristics for the HL562 Ultralog Antenna 11 2.5 Gain Characteristics for the HL562 Ultralog Antenna 12 2.6 Gain Characteristics for a theoretical Antenna 13
2.7 10km x 10km view of Toowoomba Area showing 18
Transmission Sites Licensed by ACMA.
3.1 Gain Characteristics for the HL562 Ultralog Antenna 54
3.2 Picture showing the HL562 Ultralog Antenna 55
3.3 Picture showing the ESPI Receiver 56
3.4 Map showing the on-campus measurement locations 58
3.5 Photos of four testing locations 59
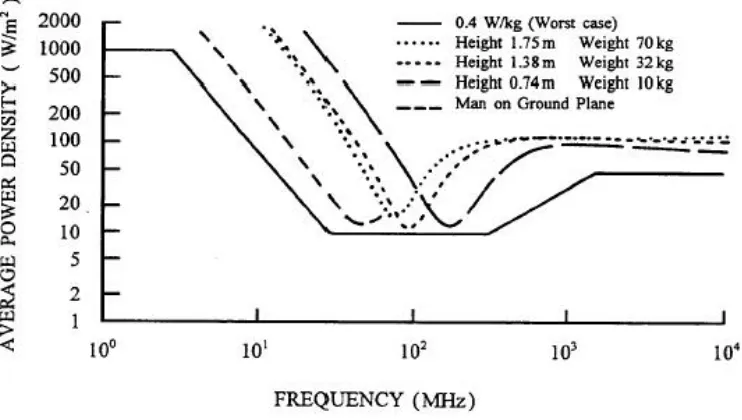
3.6 Measured Power Densities which equates to 0.4W/kg 68
3.7 The SAR Robot Measurement System at the TRL 71
3.8 2mm Mesh of Phantom Head with measured results. 72 3.9 Results gathered by ARPANSA of signals strengths 73
during the Mobile Phone Base Station Survey 2007-2008
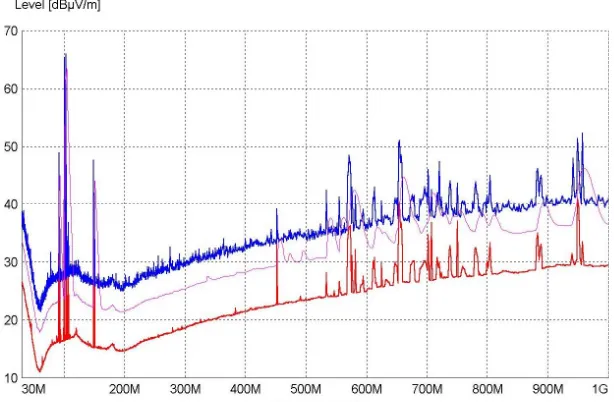
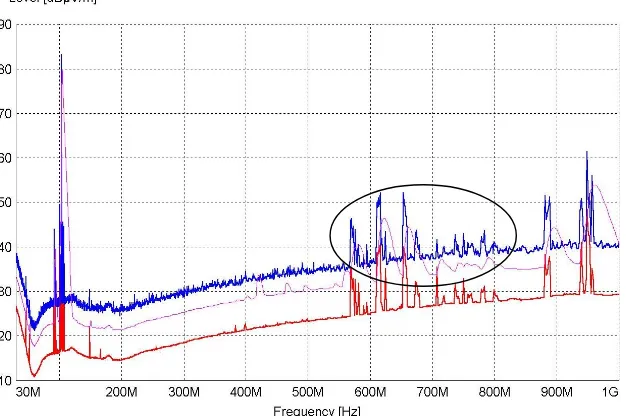
4.1 Scan Graph showing scan at the refect, 30MHz to 1GHz 76 4.2 Scan Graph showing scan from the laboratory, 30MHz to 1GHz 76 4.3 Scan Graph showing a scan from the GSM transmission 77
Site, from 30MHz to 1GHz
4.7 Graph showing vertical scan at the lecture hall site 83 4.8 Graph showing horizontal scan at the admin office site 83 4.9 Graph showing vertical scan at the Z block oval site 84 4.10 Graph showing horizontal scan at the Z Block Oval Site 85 4.11 Graph showing vertical scan at the Quadrangle site 85 4.12 Graph showing vertical scan at the Refect site 86 4.13 Graph showing horizontal scan at the Refect site 86 4.14 Graph showing horizontal scan at the S Block Site 87 4.15 Graph showing vertical scan at the S Block Site 87 4.16 Graph showing horizontal scan at the GSM antenna site 88 4.17 Graph showing horizontal scan at the Public Park Site 89
4.18 Graph showing max, min and average amplitude 93
values of chosen frequencies from Laboratory Site.
4.19 Graph showing max, min and average amplitude 93
values of chosen frequencies from Lecture Hall Site.
4.20 Graph showing max, min and average amplitude 94
values of chosen frequencies from Z Block Office Site.
4.21 Graph showing max, min and average amplitude 94
values of chosen frequencies from Z Block Oval Site.
4.22 Graph showing max, min and average amplitude 95
values of chosen frequencies from Quadrangle Site.
4.23 Graph showing max, min and average amplitude 95
values of chosen frequencies from the Refect Site.
4.24 Graph showing max, min and average amplitude 96
values of chosen frequencies from the S Block Site.
4.25 Graph showing max, min and average amplitude 96
values of chosen frequencies from the GSM Antenna Site.
4.26 Graph showing max, min and average amplitude 97
values of chosen frequencies from the Public Park Site.
Amplitudes for Scans at the Laboratory Site
4.29 Graph showing Horizontal and Vertical Average 102 Amplitudes for Scans at the Lecture Hall Site
4.30 Graph showing Horizontal and Vertical Average 103 Amplitudes for Scans at the Z Block Office Site
4.31 Graph showing Horizontal and Vertical Average 103 Amplitudes for Scans at the Z Block Oval Site
4.32 Graph showing Horizontal and Vertical Average 104 Amplitudes for Scans at the Quadrangle Site
4.33 Graph showing Horizontal and Vertical Average 104 Amplitudes for Scans at the Refect Site
4.34 Graph showing Horizontal and Vertical Average 105 Amplitudes for Scans at the S Block Site
4.35 Comparison of the 700MHz to 800Mhz signals as 106 Tested at the Laboratory Site, different orientations.
4.36 Comparison of the 500MHz to 800Mhz signals as 107 Tested at the Z Block Oval Site, different orientations.
4.37 Comparison of the 600MHz to 800Mhz signals as 107 Tested at the S Block Site, different orientations.
List of Tables
Table Name Page
2.1 Annual mobile phone handset sales in Australia 17 2.2 Australian Standards - Basic Restriction for SAR 41 3.1 Properties of different tissues within the human head 71 3.2 Results of Mobile Phone Base Station Survey 2007-2008 73 4.1 Scan Data, in raw format, scanned from the Laboratory 75
4.2 Table of the 5 Largest Scan Values Measured 78
4.3 Table of the 5 Largest Frequency Scan Values Measured 78 4.4 Table showing the number of signal peaks detected at 89
Each location as well as average amplitudes
Glossary of Terms
3G 3rd Generation mobile phone network currently in place a/c or ac Alternating Current
ACMA Australian Communication and Media Authority
AM Amplitude Modulation/Modulated – Refers to either the method of modulation of a signal or in the context of radio waves the dedicated frequency range for Amplitude Modulated radio broadcasting AMTA Australian Mobile Telecommunications Association
ARPANSA Australian Radiation Protection and Nuclear Safety Agency
CDMA Code Division Multiple Access – this mobile system was in place after analogue was phased out
CT Scan Computed Tomography – a medical scan used for body imaging
EM Electromagnetic
EME Electromagnetic Energy EMF Electromagnetic Field(s)
FM Frequency Modulation/Modulated – Refers to either the method of modulation of a signal or in the context of radio waves the dedicated frequency range for Frequency Modulated radio broadcasting GPS Global Positioning System
GSM Global System for Mobile – the system in place previous to our current 3G system
HF High Frequency, in reference to radio wave frequency bands Hz, kHz, Hertz, kilo-Hertz, Mega-Hertz, Giga-Hertz,
MHz, GHz Measurement Units of frequency
ICNIRP International Commission for Non-Ionizing Radiation Protection MRI Magnetic Resonance Imaging – a medical scan used for body imaging Next G Similar to 3G mobile phone network, often referred to as 2.5G
RF Radio Frequency
RMIT Royal Melbourne Institute of Technology SAR Standard Absorption Rate, (Section 3.3.2.1)
UHF Ultra High Frequency – in reference to radio wave frequency bands USQ University of Southern Queensland
UV Ultraviolet Radiation
VHF Very High Frequency, in reference to radio wave frequency bands WHO World Health Organisation
Chapter 1 - Introduction
The topic of this project is ‘Human Electromagnetic Radiation Exposure’. The topic covers all non-ionising electromagnetic radiation and the exposure risks to the general public. The topic was initiated through public concern for electromagnetic radiation and the current viewpoint today that it could be dangerous.
This concern has become more relevant with the large growth of the broadcasting and telecommunications industries. The current standards focus on limiting the electromagnetic radiation to a level which produces no short-term dangers but through research it is indistinguishable as to whether these levels carry an inherent long-term low level radiation risk.
The amount of research currently conducted around long-term low-level electromagnetic radiation is staggering and a review of these studies was conducted. The studies which were focused on were any which contained topics such as health risks, any other possible effects on living creatures, current knowledge on radiation sources or signal characteristics and measured levels of other studies similar to this one. The experimentation, and focus on this topic, was conducted around the University of Southern Queensland campus. This area is a general public area with a large daily congregation of people and so particular focus was aimed at the public health risks and standards. Focus was aimed at areas of high risk as well as areas which were often used by the general public on a daily basis.
The largest component of investigation was the experimentation which was taken around the campus location and nearby areas. It consisted of taking signal amplitude scans at a number of locations to view the overall strengths of the many signals which the public is exposed to continuously. These consisted of FM radio, Television, Mobile phones and many private signals and to see whether there was any risk of any signals being as high as the Australian Standards.
Also analysis of the different locations and signal frequencies was conducted to view which characteristics of the signal or the location would alter the electromagnetic exposure levels. The analysis would contain statistical data analysis on the measured peak values, would require calculations into relevant data units and an analysis of the final value and the comparisons which could be made between the different locations and signals. The most important analysis was whether of not the signals that were measured were at risk of reaching the standard restrictions.
Chapter 2 – Review of Theory
2.1 Electromagnetic Definition
2.1.1 Electromagnetic Waves
Electromagnetism is a very hard concept to define and one that is often taken for granted. An electromagnetic wave has no mass and propagates through space at the speed of light. It is a mystery because it has no medium to travel through, as sound does, and acts both as a waveform and a particle.
Electromagnetic waves interact with each other as waves rather than particles. So, when two electromagnetic waves occupy the same space the amplitude of the waves is summated. Two in phase waves travelling along the same route will double the amplitude, while two 180º out of phase waves travelling along the same route will eliminate each other. Today, the exact nature of electromagnetic waves still eludes researchers and research into this area continues.
Despite this fact the scientific community doesn’t know its effects and how to use EM waves constructively. What is known; however, is that electromagnetic waves contain both an electric component and a magnetic component. These interact with each other; the change in one represents the amplitude of the other, and vice versa. The orientation of the magnetic component and the electric component are perpendicular to each other and directly effect the polarisation of the wave. Waves with their electric component at the same orientation are classified as polarised. An example of this is shown below in Figure 2.1.
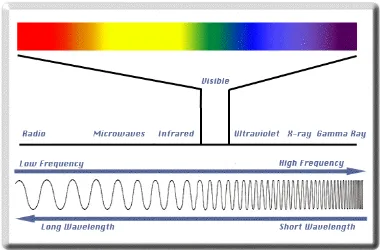
An electromagnetic wave can be of any frequency (or wavelength) and any amplitude. Electromagnetic waves have been classified into different wavelength categories, each category with its own characteristics.
Visible light is the most commonly known electromagnetic wave category and consists of wavelengths from 380nm to 720nm, blue to red respectively. Below the 380nm wavelength is ultraviolet light, X-rays and Gamma ( ) rays. Above 720nm visible light is infrared light, microwaves and radio waves. Radio waves are characterised further into AM, FM, Long Radio waves, HF, VHF, UHF and more depending the use for that frequency of signal today.
[image:18.612.142.522.252.502.2]These EM categories can be seen below in Figure 2.2.
Figure 2.2: The electromagnetic spectrum. (University of Minnesota: Laboratory of Computer Science and Engineering, online resource)
2.1.2 Electromagnetic Fields/Radiation
Electromagnetic fields represent magnetic fields and electric fields. Electromagnetic fields are the three dimensional representation of electromagnetics in an area/volume. Since each electromagnetic wave has an electric and magnetic field component the representation of an area of these waves is an electromagnetic field.
of the field and the orientation of the wire to the field. And vice versa a current moving through a wire produces a magnetic field.
Magnetic and electric fields also directly influence other fields of a similar type. An electric field will influence another electric charge or field.
2.2 Electromagnetic Production and Sources
2.2.1 Natural Electromagnetics
Natural Electromagnetic Radiation is the radiation which is present in our natural world, and there is no way to influence the source. There are a number of sources of natural radiation shown below.
2.2.1.1 The Sun
The Sun is the largest producer of Electromagnetic Radiation in our solar system. It provides the Earth with light and heat, as well as many unwanted electromagnetic waves such as UV, X-ray, Radio Waves and Gamma Waves.
Luckily the Earth’s atmosphere filters out the majority of Gamma, X-rays and UV radiation as these are harmful to life and are classified as Ionizing Radiation. Ionizing Radiation means that the radiation has enough power (due to the high frequency when looking at light as a photon) to strip electrons from our atoms. Radiation such as gamma radiation is highly dangerous and leads to the denaturing of DNA and death of living cells and organisms, The average human being living on our planet needs to know little about this as the surface is protected by the Earth’s atmosphere.
However infrared (heat), visible light, radio waves and some UV radiation all manage to reach the surface of the planet. UV radiation can have harmful effects but this will not be discussed in this dissertation. Visible light and infrared radiation are very useful to life, and without it Earth’s ecosystem could not function. Radio waves are another product of the sun and these are detectable from the surface. Sun Flares and variations in the Sun’s energy production can produce peaks, troughs and other variations in the radio waves emitted. The sun is a major source of radio waves but for this project’s application there was no influence from it as the project looked for specific wavelength signals which were deliberately man-made.
2.2.1.2 The Earth
2.2.1.3 Magnets and Static
Magnets are natural sources of magnetic fields and are found in certain materials around our planet. These metals hold and retain the magnetic field and are a natural source of electromagnetic radiation for this reason. Static electricity and lightning storms are also examples of natural electromagnetic events. These are based on the build up of an electric charge through a number of sources such as friction, ending with the release of an electric discharge, or spark.
These natural electromagnetic sources are not covered in this dissertation but are useful to know the sources for a complete theoretical background for this topic.
2.2.2 Man-Made Electromagnetics
There are two types of electromagnetic radiation produced from man-made sources. These are accidental and deliberate.
2.2.2.1 Accidental Radiation
Electromagnetic leakage is the term used for accidental radiation being produced from electronic and electrical components. Electromagnetic leakage comprises a major assessment component of this dissertation because it is present in areas of office equipment such as computers, printers, photocopiers, lighting systems, air conditioning and more. Electromagnetic leakage is the accidental electric or magnetic field production from any circuit. The cause of EM leakage can be varied. Electrical circuit switches are often a cause of significant leakage, as well are any electrical motors. Any wire in an electronic circuit that has a current causes an electric field. The strength of this field is proportional to this current, so any high current line in a circuit can cause a large enough field to interfere with other nearby electronic circuits.
There are many other causes of leakage in electric circuits, as today there are many circuit components designed, and what these components are made of is often unknown.
Many of the components may have capacitors, inductors, switching components, as well as many other parts which may cause a leakage, and each component on its own will only cause a minor leakage.
Deteriorating electronics are responsible for a large amount of EM leakage too. The most common occurrence is arcing. If a minor break in a circuits wire occurs, then arcing across this break will cause a large amount of electromagnetic noise.
Also switches, switching components and kinetic components as they were down all have an increased chance of arcing, as oxidisation occurs on contacts or formerly smooth parts get worn down and rough.
Many of these problems are only small but when combined in a large circuit they can cause significant leakage, which in effect causes significant influences on nearby electronics.
2.2.2.2 EM Leakage in this Project
While Electromagnetic Leakage is acknowledged in this project, little attention could be spared for this topic, either in calculations, or with researching theory and detection. As will be read later, scans were conducted in an office location and this was to represent a worst case scenario for EM leakage. From this the worst results could be seen and compared to results shown from other locations and situations.
2.2.2.3 About Deliberate Radiation
Deliberate Electromagnetic Radiation is any electromagnetic radiation which is produced with some sort of function in mind. While the outcome might affect areas that were unintentional or expose people which it was not intended to, it is the basis in which the signal was produced which determines if it is classified as a deliberate signal. Some applications of deliberate signals that were not relevant to this topic are discussed below, followed by the signal production which is very relevant to this dissertation.
2.2.2.4 Instrumentation Applications
In many industries wireless instrumentation is used for measurement and control. Devices used to determine distance measurement, time, pressure, object location, object composition and more can produce an almost endless number of applications for electromagnetic radiation.
2.2.2.5 Medical
Today the uses of electromagnetic radiation in medicine are ever increasing. Electromagnetic radiation is very useful in the diagnosis and treatment of many conditions.
Cancer is treated with Chemotherapy which uses high levels of radiation to destroy cancer cells. This radiation also kills healthy cells but in a controlled environment the risks to the patient can be reduced and the patient may live depending on the severity of the cancer.
Imaging devices such as MRIs, X rays, CT scans and others are used for medical diagnosis. X rays and CT scans both use x ray frequency waves to propagate through the body and be captured as an image. X ray is dangerous radiation but in smaller, controlled situations can be highly effective. MRIs use radio waves, in conjunction with large magnetic fields to produce imaging of the body.
All of these images rely on different interactions between the electromagnetic waves and the different tissue compositions of the human body to produce images of its structure.
2.2.2.6 Science and Engineering Research
Scientific and Engineering Research is obviously one area which can use electromagnetic signals and radiation.
Once again the uses of electromagnetics are so varied that it is impossible to classify all applications for this purpose. This dissertation is one example of the type of research underway but the use of EM radiation extends to many more applications. Research areas include EM use, the effects of electromagnetic radiation, using EM signals to solve the mysteries of our world, the safety of EM radiation and development of EM radiation into other useful or more efficient products.
Research is another limitless use of electromagnetic radiation and has a much broader utilisation than any other application. For example different studies may use high levels of electromagnetic radiation over long distances while others may only use minute signals. Electromagnetic radiation may be highly variable and influence objects around it or may be a static field and developing its uses into a new application.
2.2.2.7 Wireless Integration Applications
Today many devices are being integrated as wireless. These are not done out of necessity but instead for convenience. Around the home, devices are all becoming wireless.
Wireless networks and internet allow for computers to talk between each other as if on a wired network. Bluetooth compatibility between computers, mobile phones, keyboards and many other components are becoming the norm. Wireless keyboards, mice, headsets and speakers are all common with today’s computers. Also other items such as GPS navigation gives a wireless navigation system for the car and uses satellite communication to achieve this.
2.2.3 Electromagnetic Signal Transmission
2.2.3.1 Signal Production Introduction
Electromagnetic signal production is the deliberate production and transmission of electromagnetic radiation in the form of analogue or digital signals containing information. This transmission can be from a specific site to another site, one way communication such as is often the case in industry and data logging situations. It may be single site to site communication where two matched signals are used to have two way communications. It may be one site to many broadcasting such as television or radio or could be multiple site to multiple site communication such as a taxi radio network.
There is a wide variety of uses for electromagnetic signals and is continually developing as the advancement leads to new applications for this technology, and as technology evolves.
EM signal transmission first requires specialised equipment to allow it to happen. This comes in the form of a transmitter, a receiver, or both and the key component is some sort of antenna, whether crude or advanced. Often accidental signals can be received or transmitted through items which aren’t antennas but act as one through key, antenna-like characteristics but these are bad receivers and often only produce noise.
2.2.3.2 Antenna Theory
The antenna theory applies to broadcasting and telecommunications, as well as many other applications. An antenna can be anything from a single basic wire antenna to a complex antenna array.
The theory of antenna transmission is based on electromagnetic interaction between electromagnetic fields and electric current and charge difference throughout the antenna.
propagates outwards from the antenna. If the current is reversed, and hence reverse the charge difference, then the electric field has negative amplitude which propagates out. Depending on the antenna this is a direct relationship so a sin wave a/c current will produce a sin wave propagation signal pattern.
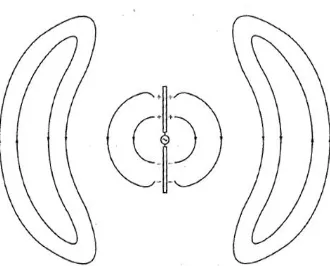
[image:25.612.162.492.252.518.2]A simple picture of this relationship is shown below in Figure 2.3. This picture shows very simple dipole antenna and how it produces the electromagnetic signal. When applying this to more complex antennas and more complex signals the principle is still the same, but instead of a simple relationship between electric current and signal it becomes much more technical and by changing antenna shapes the signals can be redirected into more specific directions or alter its characteristics.
Figure 2.3: Electric Fields in the Vicinity of An Oscillating Short Dipole Antenna at the Instant When the Current is Zero and the Charge is a Maximum (Ball, 2007, p 6.5).
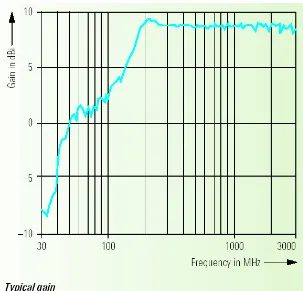
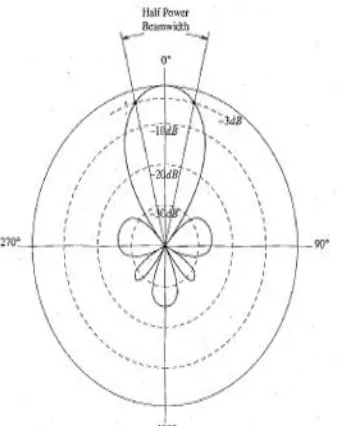
The main characteristic which applies to antennas is signal gain and how it applies to different directions and different frequencies.
Figure 2.4: Gain characteristics from 30MHz to 3GHz for the Rohde and Schwarz HL562 Ultralog antenna. (Rohde and Schwarz, 2004, p 2)
The gain variation for the antenna to signal direction provides information on how signal detection varies according to the direction it is received from. It can be expected that nearly all antennas should have the highest gains directly ahead but it is useful to know how the peripheral angles change the signals. This allows people not to be required to know the exact direction of what is being measured.
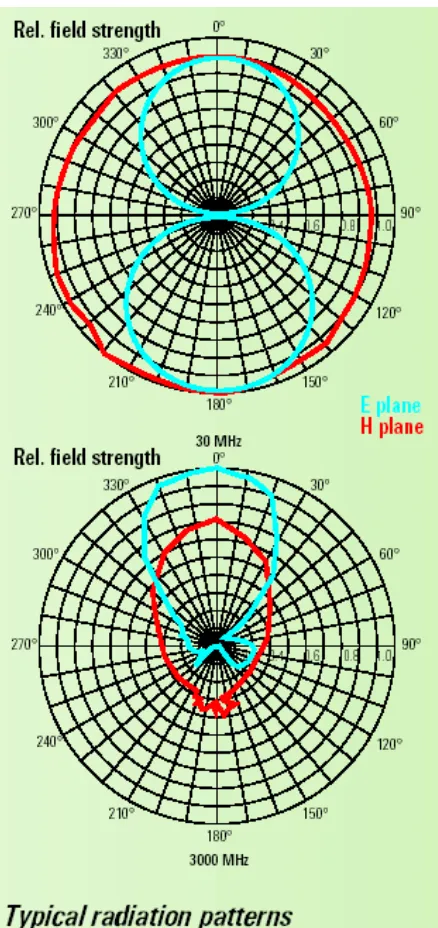
Three examples of different gain angle tables are shown below. Two are from the Rhode and Schwarz HL562 Ultralog antenna used in this experiment, showing the 30MHz angle variation and the 3GHz angle variations. The last graph, Figure 2.6, shows just a typical, relatively simple angle graph and how they look like theoretically, rather than in real life.
Figure 2.6: Gain characteristics for 360º rotation around the antenna for a theoretical antenna. (Ball, 2007, p 6.15)
This was a quick look into antennas and antenna theory. These days a full knowledge of antenna theory is not required. An understanding of the gains and a few characteristics which apply to the application are required and the antenna producer provides the technical background for their product.
2.2.4 Shielding and Types of Protection
As stated all electrical and electronic equipment has potential to produce radiation. Current flows, kinetic movement and magnetism are just a few accidental producers of electromagnetic radiation.
As well as this signal transmission, external interaction (measurement) and light production are a few producers of deliberate electromagnetic radiation. Whether deliberate or accidental all radiation should attempt to be shielded to reduce its influence on nearby external objects which do not require this radiation.
2.2.4.1 Minimisation Protection
Minimisation Protection is reducing accidental radiation through reducing the number, or strength of sources themselves. This includes lowering currents, as the radiation strength is directly proportional to the current strength so as current amplitude is decreased so is the radiation amplitude.
Things such as using newer, lower energy components as well as using power supplies, and parts which are not ‘overkill’ for their application. Avoiding current loops is another means of reducing the production as a current loop amplifies the radiation produced by the current.
The advantage of minimisation is that the radiation is reduced, the efficiency of the product increases. Reducing current loops is a part of good circuit design and so should not have a major influence in a well designed circuit.
The disadvantage of this approach is that it is limited in its application and only reduces radiation, does not eliminate it. The current can only be reduced to a certain level before the electrical/electronic equipment cannot function as it is desired. Also once current loops are eliminated (or reduced to minimum feasible levels) there is little extra advantage from this approach.
2.2.4.2 Relocation Protection
Relocation of a radiation source is a very common way of reducing the strength. Overhead power lines, high broadcasting towers, hands-free mobile phone kits and fenced off transmission stations are all examples of relocation. It is moving a source away from the unwanted exposure locations. Quite often this is one of the most used ways of reducing deliberate radiation.
The advantage of relocation is that it is a very effective way of reducing high strength signals. The reduction is exponential as the distance becomes further so being 10m away from a power line is four times better than being 5m away from the same line.
This is due to 3D spherical strength reduction occurring. The formula for this is:
Si = Prad
4 r2 Si = Power Density of the Signal
Prad = Radiated Power
r = Distance from Source
Another benefit is that quite often relocation occurs for other advantageous reasons. A tall broadcasting tower can broadcast further than a short tower so without worrying about the radiation reduction it has already been located in a position away from harming its surroundings.
The disadvantages of relocation are that for many applications it is not a plausible method. A mobile phone handset antenna can not be run it up a 5m tower. It is inefficient to take a small radiation-producing electronic component and move it out of a piece of electronic equipment.
As well as it being impractical in terms of design it may be found that the losses or disadvantages in such a situation outweigh the benefits. Quite often user interaction also occurs with the source of the radiation which is unavoidable.
2.2.4.3 Shielding Protection
Possibly the most common way to reduce radiation effects is shielding or screening. These are both very similar and involve the blocking of the signal by a plane of material which either absorbs, or reflects the signal. Reflective Shielding reflects the signal as it hits the barrier while Absorption shielding absorbs it in its electron structure, often retransmitting the energy in another form such as heat (low levels). Shielding is used in a vast number of situations, many not related to this application. Nuclear shielding with lead, sun screen, sound proofing, medical equipment design are just a few other applications which involve some form of shielding.
In any broadcasting situation what is wanted is for the signal to be transmitted out to those who need to receive the signal but to limit exposure to those who don’t require receiving the signal such as nearby workers, etc.
One such example is taxi radios are automatically shielded by the roof of the taxi. For people who work at transmitting sites it may be found that work areas can be shielded to reduce the exposure to employees who are present for more than 7 hours a day. Electronic equipment such as office equipment also has in-built shielding and screening to minimise the external radiation which consumers may be exposed to during operation. The advantage of shielding is the signal can be completely eliminated if required and shielding can be quite cheap depending on the application and level of shielding required. Due to its simplicity it is possibly the most used technique. It can also be integrated during construction and with modern machining can be added to a product very easily.
2.2.4.4 Other Design Options
There are other design options which can alter the radiation strength that is emitted. These will be discussed shortly below.
Directional Antennas can be used when broadcasting between set points. By choosing a directional antenna it can transmit a signal with much higher amplitude in the required direction, while other unwanted directions have highly reduced amplitudes. These characteristics come from the design of the antenna itself and should be thought of with the design. A typical graph of directional amplitude is shown here in Figure 2.6 (Section 2.2.3.2, page 9).
Through using multiple smaller transmission stations to cover the same area, the maximum signal strength required is reduced. There are a number of reasons to use the mobile phone cell station setup that is currently in use and this is one advantageous reason.
If a single transmission tower only has to cover half the distance, due to signal distance reduction, it can reduce the total transmission power by four. The lower peak signal value is much safer than the higher value but two stations require much more money and complexity to set up.
2.2.4.5 Why Protect
In a lot of cases protection isn’t necessary. But minimal unwanted radiation is a product of good design for all electronics and electrical equipment. As well as exposing nearby people or animals to the effects of this radiation it may also interact with other electronic equipment in unwanted ways.
For example an unwanted electrical leakage on a wire in a piece of digital electronics could result in another wire producing a digital value of one rather than zero. This could have major ramifications if it is the control system of a piece of large equipment. With modern technology these problems are far easier to fix and very little thought is required on this subject in most cases.
For some industries there are strong regulations on any electromagnetic radiation. This is especially the case in all broadcasting, mobile telecommunications and power transmission just to name a few.
2.2.5 Electromagnetic Radiation Today
Throughout previous sections there has been much discussion into what occurs today. Which industries use electromagnetic signals/radiation and what they are used for. There is a need to look into the condition of these industries and how the growth today has led to the current situation in which there is a public concern about electromagnetic radiation.
The largest area of growth today is easily the mobile phone telecommunications market. The level of growth in this area has been phenomenal and today almost every household has more than one mobile phone.
Table 2.1 shows the growth of mobile phone handset sales from 2002 to a predicted value for this year. Considering there is a total population in Australia of 21.5 million people and yearly mobile phone handset sales of above 9 million there is an extremely large number of handsets being sold each year.
While not all handsets are currently used it should be noted that the more that are bought, the more that are being used and so while not every handset is being used its rise in sales shows an increase in mobile phone usage. Also an increase in mobile phone handset sales and usage also leads to a need for larger support systems and larger mobile phone base stations.
Table 2.1: Annual mobile phone handset sales in Australia (Australian Mobile Telecommunications Association, 2008, online resource)
Year Annual Mobile Phone
Handset Sales (million)
2002 4.00
2003 5.98
2004 8.02
2005 8.01
2006 8.74
2007 9.28
2008 (predicted) 10.2
This growth in the mobile phone industry extends to all industries, even if the level of growth is slightly slower in other areas.
With the number of frequency licences authorised there is also a number of site licences which are also provided. In a 20km by 20km box centred on Toowoomba there are 149 transmission sites authorised. A number of these locations can be seen below in Figure 2.7. The patch of high density sites that can be seen in the middle, towards the right side is the centre of Toowoomba.
Figure 2.7: 10km x 10km view of the Toowoomba, and west Toowoomba, area showing transmission sites licensed by ACMA. (Australian Communication and Media Authority, 2008, online recourse)
2.2.6 Electromagnetic Sources for this Dissertation
There are a number of broadcasting areas of interest for this project. Because this project has a strong hold on public perception it is of great interest that a number of frequency ranges of public interest should be looked at.
As stated in (Section 3.1, page 53), discussing the equipment restrictions, only a scan range of 30MHz to 1GHz will be conducted and so this must be taken into account when considering the signal sources. The areas that were recognised are discussed below.
The frequency ranges of interest are the AM radio range, the FM radio range, the Television Broadcasting range, the mobile phone spectrum and the blue tooth spectrum, as well as possibly the 50Hz AC power range. 2.2.6.1 AM Radio Signals and AC Power
measure for, as the AM radio requires much higher initial signal strength to allow it to carry as required and is commonly very close to the standard restrictions near the site.
2.2.6.2 FM Radio Signals
The FM broadcast range falls from 87.5MHz to 108MHz and so is ideal for measurements. The number of FM radio stations able to be detected around Toowoomba is approximately 10-15 signals depending on the atmospheric conditions.
Frequency modulation, which is used for FM radio, has a quite a low overall amplitude in comparison to other modulation methods. This is because the amplitude only needs to be high enough to transmit the signal, and the signal data itself is stored as a frequency change rather than an amplitude change as can be seen in AM radio.
Additionally some developments in radio which have lead to any increase in the signal data capacity making the signal itself is relatively simple. There are a number of FM transmission sites present all around Toowoomba, and with one being transmitted on-campus from the S-Block roof this was believed to be the largest peak of interest for this project.
2.2.6.3 Television Broadcasting Signals
Television Broadcasting can be found in the band called Ultra High Frequency, or UHF. This range extends from 520MHz to 820MHz, but most television signals are found from around 700MHz to 820MHz for free to air television.
Television broadcasting today has become more complex with digital television. All stations are trying to pack more information into the digital signals as well as keeping the old analogue signals which are compatible with the previous level of technology.
The television antennas in Toowoomba, unfortunately, are on the other side of the city and not easily accessible for this project with this equipment so are not thought of being a major signal of interest, even though they fit in the range and should have signals around the FM radio level.
2.2.6.4 Mobile Phone Communications
found that there are some peaks of interest for this range in some situations, and could prove to be significant for this experimentation. The other mobile phone ranges range lies from 1.8GHz to 2GHz. This range includes all the latest technology, with the 3G network signals having signals found above the 1.9GHz range. This range would include a large number of signals very frequently for some testing sites but unfortunately these signals cannot be measured with a calibrated signal and so cannot discover any useful results.
2.2.6.5 Bluetooth Communications
Bluetooth was going to be investigated as an application of this project on the latest technology. Bluetooth phone compatibility has become standard for all phones today and is an effective, short-range way of transferring data fast between two devices.
Bluetooth operates at the 2.4GHz range and so could not be measured but the proposal was to use two blue tooth devices and transfer data between them, measuring the signal strength produced from these devices at different ranges and situations. This was going to be one of the main points of interest but unfortunately could not be measured due to the equipment limitations.
2.2.6.6 Private/Industry Signals
The last possible signals of interest are private/ government/ rescue service signals. These are licensed throughout the 30MHz to 1GHz range and include applications such as paging, taxi radio systems, police, fire, ambulance and rescue communications, council use, governmental use, industrial use, public transport communications as well as private use by anyone wishing to pay for the licensing.
The signals which were thought to be significant were the council, governmental, police and rescue services and taxi radio signals as these could be found throughout the city. The range of these signals could be found from 30MHz to 600MHz, with sub-ranges based around 30MHz to 80MHz, 120MHz to 250MHz and 450 to 600MHz.
2.3 History and Development
2.3.1 Early History
The earliest leap in the understanding of electromagnetic propagation and broadcasting came from James Clerk Maxwell in his mathematical equations in 1864 (Hecht, 2002). These equations were a massive development in many theories ranging from electricity, electromagnetics, optics, quantum physics and more. One of the major discoveries was the development that a wave could propagate through space. This would later be discovered to be at the speed of light which he was able to accurately predict using his mathematical equations.
The applications from these equations were many and varied. In 1988, Heinrich Hertz used two conductors to propagate a basic signal over a small distance of a few metres or less.
This was then further developed by Guglielmo Marconi in 1895. Using a battery, a spark generator, an induction coil and an antenna he was able to ring a small bell over a significant distance. This distance started from just a few meters but was able to be moved up to a kilometre and a half away and still the bell rang.
This signified electromagnetic wave propagation over a quite a large difference and between Hertz, and later Marconi, the basics of EM propagation was developed. In 1896 Marconi patented his invention as the first radio but this was overturned in the 1940’s allowing Nikola Tesla to claim the first radio patent who was working on radio propagation at the same time as Marconi.
2.3.2 Radio Development
The first AM radio applications soon came into being. The first applications were in service on maritime vehicles for to help with communication while at sea. The first maritime application was a Morse-code signal that was sent between ships and shore (About, Inc.).
Lee Defroste developed a useful amplifier for radio applications and AM modulation, which is a technology still used today. The amplifier allowed for smaller signals to be detected which allowed a much longer distance of propagation to occur. He was also the first person to use the word ‘Radio’. During America’s involvement in the wars the government controlled all patents for the AM radio, to allow strict use by only their forces. This was a significant tactical advantage for the US and those allied with them.
used with care to not allow intelligence to be discovered by the enemy. This required the development of radio security as well as many codes.
The development of FM radio was then introduced in 1933 by Edwin Armstrong. This had the significant advantage of reducing the amount of noise in a signal but it wasn’t until 1965 that the FM antenna system allowed multiple stations broadcasting at once.
2.3.3 Television Development
The first television development was in the late 1920’s and was actually a mechanical television (Genova, 2006). This seems unusual but it contained a spinning disc with a neon light. The product of this was an image about 3 x 5cm and was blurry. It contained only 30 to 120 lines in the image with more being added as the early TV’s were developed.
It wasn’t until the 1930’s that the all-electronic television was developed. This was the cathode ray tube television and was an all grey-scale picture, having no colour technology until much later in the development of television.
At this time televisions were not commercial and, while broadcasting could propagate for hundreds of miles, it was mainly only used for testing and for the select few rich enough to afford an early television.
The first commercial broadcasting was in 1941 in the USA. The history of broadcasting shows that some of the private broadcasting companies known today were developed during this mechanical television time, such as BBC in 1932. These were later developed into commercial stations, and have been developed into the stations that are known today.
By 1944, an inventor by the name of John Bairde exhibited his first fully electronic colour Television. It contained 600 lines and used a three colour interlacing to produce the final image results. In America, the first public colour televisions were distributed in 1950 and only broadcast for one hour a day for every day. This later developed into some night time programs due to public demand.
By late 1950 only 10 colour broadcasting towers were available so broadcasting was limited by distance and money. Slowly the colour coverage grew until coast to coast transmission was possible and by the late 1950’s the colour television had become reasonable common throughout the wealthier population.
Today the industry is developing digital television to run at the same frequencies as analogue. There are a few free to air channels as well as the ability to pay for a large amount of extra channels. Digital broadcasting can now handle multiple cameras for the same footage, menu options and many special features not previously available, the most noticeable being the higher resolution. All these require higher bandwidths and total power in the broadcasting network, and so today the signals are a little higher than they used to be but are still kept significantly low by excellent compression of the data.
2.3.4 Mobile Phone Development in Australia
The history of mobile phone broadcasting in Australia (AMTA, 2008) started in 1981 when Telecom launched the first public broadcasting system. The typical handset cost $5000 to buy and was boot mounted.
In 1987 the first cellular system was introduced based off the current American Analogue model and was developed in the major cities. Handsets still cost around the $5000 range.
The first competition for Telecom was introduced in 1992 when Optus developed their first analogue system. By October there were 500,000 connections and most of these were still controlled by Telecom. At the end of the year Vodaphone became a licence provider.
In 1993 the first GSM network was created by Telstra, shortly followed by Optus and Vodaphone. GSM was a digital carrier which was superior to previous analogue technology but both were still used simultaneously throughout the country. GSM is still in commission today, looking to be phased out slowly in the coming years.
In 1994 one million analogue connections were completed and then in 1996 one million GSM connections had been completed. In 1998 Telstra announced the removal of the Analogue broadcasting, soon to be replaced by CDMA which was introduced in 1999. By the end of 1999 most old Analogue Broadcasting systems had been removed and by September 2000 the last Analogue shutdown was completed.
Until 2003 the current GSM lines were relatively unchanged. The development of internet through mobile phones was introduced as well as a few new network providers starting up. In 2003 Telstra initiated the new 3G network which is one of the newer developments today, allowing video calls, reasonable speed internet and streaming videos that require much higher bandwidth.
Another latest development has been GPS transmissions incorporated into mobile phones for accurate mapping and travel directions. Today there are millions of mobile phones being used every day. In 2005, 2006 and 2007, mobile phone sales were 8 million, 8.7 million and 9.2 million respectively. 9.2 million handsets are more than one phone bought each year in Australia for every three people [AMTA, 2008].
2.3.5 Today’s EM Developments
Today there is a multitude of broadcasting sources. There are many different mobile systems working at the same time and CDMA is currently being phased out and the industry is moving more into 3G and next G mobile systems. As stated above these are much higher bandwidth signals. Also nearly all modern phones contain Bluetooth which is a short range data propagation system.
Today’s radio system contains a multitude of FM and AM stations which are transmitted to cover almost all of Australia with every other country having its own national broadcasting. This broad coverage is able to provide all locations with the same levels of entertainment and news coverage. As well as this there are many private radio systems used by industries such as defence, police, emergency services, taxi services and shorter length radio systems.
2.4 Health Concerns and Study of EM Radiation
2.4.1 Health Concerns with EM Radiation
2.4.1.1 Ionising Radiation
The first health concern with electromagnetic radiation has to do with Ionising radiation. Ionising radiation is classified as the EM waves which are Ultraviolet light, X rays and Gamma Rays. The high frequency of these EM waves means that more energy is stored within one photon of light (which is a packet of light). When these higher levels of energy collide with a particle they are able to strip electrons from the particle. The ability to do this becomes more significant as the frequency of the radiation increases, and so while Ultraviolet light only causes skin tans and burns, gamma waves are highly dangerous and cause radiation sickness and possibly death.
While ionising radiation has no effect on this project, there is a good reason why this description has been included here. This is the most dangerous type of electromagnetic radiation in our world. The difference between ionising radiation and non-ionising radiation is the frequency of the signal and this can influence on the belief of the dangers of non-ionising radiation. There is an implied belief that if this radiation is so dangerous, and there is only a small difference between this radiation and non-ionising radiation, then non-ionising radiation must have major health risks and concerns. However the health risks between these two groups should not be linked in any way as they are both completely separate and have different effects.
2.4.1.2 Non-Ionising Radiation
Non-ionising radiation is the radiation which is known as EM signals. This classification refers to visible light, infrared and radio waves. These are non-ionising as the photons do not have the energy sufficient to strip electrons from particles.
Non-ionising radiation can, however, causing heating of materials in which they come into contact, dependant on the strength of the field. There are interactions in which the electromagnetic energy excites the electrons, giving them more energy, which heats the body. However this effect has been minimised by the standards.
The limit stated in the current standards limits any electromagnetic wave to only a small fraction of the amount of energy required to heat tissue by 0.1ºC. There are 0.1ºC temperature fluctuations in the body within the normal body function and so there is no risk of heating causing any danger.
on electromagnetic radiation. A lessor concern is that there is also electrical currents being produced throughout our body from EM radiation but this has only been theorised as a disturbance to deep sleep. Since this dissertation applies for public areas around Toowoomba there is no reason to follow up these effects.
The long term effects of low-level EM radiation are unknown and this is what causes concern in our community. Having no known effects on our bodies, it should be safe but the long term danger the largest concern with cancer and other effects on the brain and vital organs. The difficulty with long term exposure is that mobile phones, one of the main sources, are ever changing and being optimised, and the industry has only been public for around 21 years, with long term effects being in effect from 10 to 20 years.
Also in the beginning of the industry mobile phones cost around $5000, so even though it was public there were only a limited number of people which could afford one. Also there has been a boom in the mobile phone industry today and an increased use of mobile phones amongst children which has lead to a greater fear for the long term effects. The health risks which apply to mobile phones also apply to other electromagnetic radiation but currently mobile phones and their health concerns are the major topic of interest.
2.4.1.3 Current Concerns
The health concerns for this topic will be discussed briefly in this section before the literature is discussed later in full. Some concerns are as follows and whether these concerns are credible or not is still to be determined through scientific study.
The main concern is an increased risk of cancer from exposure. This increased risk of cancer can be located anywhere in the body but many concerns have been raised for specific types of cancer such as head and brain tumours, eye cancer, skin cancer and glandular cancers.
There are many concerns with increased or decreased heart rate with electromagnetic radiation exposure as well as blood pressure changes and many other vascular concerns. A general decrease in mortality rate has been a concern as well.
Concerns have been noted for the immune system and its overall effectiveness being decreased from exposure and hormone level imbalances being caused by EM signals obstructing the bodies regulating systems.
One of the main points of concern involves exposure of pregnant women and their babies to electromagnetic radiation. The possible concerns are birth abnormalities and defects are some of the more extreme concerns with EM exposure during pregnancy but other concerns are as simple as how EM exposure affects the gender of the child.
The risk increases when these concerns are associated with children and their developing bodies. Changes to a body as it grows, combined with the lower immunological levels of children lead to serious doubts as to whether it is safe. Exposure to children and small problems which may arise during childhood may be amplified in adulthood.
2.4.2 Private Scientific Studies
Some key scientific studies are reviewed in the following section and are a representation of the studies conducted to date around the world.
2.4.2.1 Previous Health Based Study Review
A literature review of the many experiments was conducted by James R Jauchem, from the Air Force Research Laboratories in the USA (Jauchem, 2007). The experiments were conducted from 1998 to 2006. They were reviews of research papers from many journals in well known US databases, such as The National Library of Medicines PubMed, BIOSIS, EMBASE, Toxicology Literature Online just to name a small number.
Some of the results that have been found are presented below. These results are not all conclusive but should be viewed as a guide to some current studies around. Used in this report is the term Radio-Frequency Energy (RFE).
*AM Broadcast Station workers having more abnormalities in resting heart rates compared to non-workers.
*Lower heart rates in RFE plastic sealers.
*A number of experiments showing no difference in heart rates, especially with mobile frequency exposure.
*Lower mortality rates suspected in a number of occupational exposures.
*Possible lower birth weights and higher risk of birth defects in Navy Personnel.
*No credible evidence that low levels of RFE
*Dispute as to Male/Female sex ratio in RFE exposures.
*Many other epidemiological effects reported with cell phone use. Some were significant increases while others not being very convincing. *Reported no change in hormone levels with simulated cell phone exposure.
*Others report higher levels of hormones from radio broadcasting RFE. *Mixed results with some hearing loss and other cases of no hearing loss from different RFE exposures.
These are some results received from the literature review. It was stated by Jauchem that many of the articles he reviewed had biases, lack of evidence, circumstantial conclusions or did not weigh up the significance of results. The results of these journals were greatly variable, sometimes directly contradictory. This implies that these results should not be counted as conclusive.
This article was very useful in pointing out a number of the concerns that is felt in the scientific and medical community but at this time none of the results should be considered as true without full reviews of the experimental data. This does not mean results should be ignored but at this time cannot be given full credibility.
2.4.2.2 Cellular Telephones and Cancer – a Nationwide Cohort Study in Denmark
A study in Denmark is believed to be the most comprehensive in the world to date. This study conducted by C Johansen, J Boice, J McLaughlin, H Christensen and J Olsen was initially published in 2001 (Johansen et al., 2001).
The study involved the match up of two databases in Denmark. First the Danish Cancer Registry and secondly the National Board of Telecommunication. The Danish Cancer registry hold records of all cancer diagnosed and it was studied from 1943 to 1996. The Danish National Board of Telecommunication is the database containing all the mobile phone registration information and this was studied from 1982 to 1996.
The first study looked at the increased incidences of rare cancers, such as ocular melanomas in today’s society. In the last 54 years there has been no increase in this type of cancer, or other similar rare types. This was calculated through the percentage of people on the cancer register with rare types, comparing this rate over time.
The second part was a comparison between the two databases, trying to find links between mobile phone users and cancers. Through complex analysis between the two databases it was possible to determine the cancer rates of people and to determine how the cancer rates of the 90’s compared to yesteryear.
people had 10-15 years mobile phone exposure. No increase in cancer could be recorded due to mobile phone usage from the databases and no increase in rare cases of cancer could be attributed to mobile phone use. A follow up study was conducted by many of the same people, C Johansem, J Boice, J McLaughlin, R Jacobson, J Schuz and J Olsen called Cellular Telephone Use and Cancer Risk: Update on Nationwide Danish Cohort. The registries were expanded up until the year 2001 and more specific cancers reviewed (Schuz et al, 2006).
It was found that mobile phone use was not specifically associated with an increase in brain tumours, acoustic neuromas, salivary gland tumours, eye tumours or leukaemia. These were investigated due to the localisation around the head area. From the 420,095 people on that were viewed on the mobile phone registry the number that developed cancer was 14,249. This was lower than the predicted cancer level of 15,001 from national cancer rates. However there is no biological plausibility to classify this as causing a decreased rate of cancer.
2.4.2.3 Meta-analysis of long- term mobile phone use and the association with brain tumours
This study published and accepted in 2008, and was published in the International Journal of Oncology – Vol. 32, No. 5 published in May 2008. It is based on the statistical analysis of a number of other studies which previously researched into the effects of Electromagnetic Radiation and the resulting Ipsilateral Glioma and Acoustic Neuroma, two types of cancer (Hardell et al., 2008).
The data received from other studies was combined and analysed as a whole to see if any strong trends emerged throughout multiple studies. This is a consolidation and analysis of more data in the hope of seeing a trend emerge from multiple studies.
This can have the positive effect of looking through multiple lots of data and studies and reducing the risk of errors through having more data to rely on. On the other had it could be believed that in fact the cross-examination of multiple studies leads to the multiple sources of error being adopted from each, thus losing credibility through trying to combine multiple studies which cannot be combined.
While there are advantages and disadvantages, if the original sources were under proper scientific scrutiny and are able to be seen as high quality studies the results should lead to a positive outcome of reduced error and be able to show that multiple studies all lead to a conclusion in which a trend emerges.