THE DIVERSIFICATION AND PERFORMANCE OF SELF
MANAGED SUPERANNUATION FUNDS
By
Dr Peter J Phillips
University of Southern Queensland1
Mr Alex Cathcart
Queensland Treasury2
Dr John Teale
University of the Sunshine Coast
ABSTRACT
In this paper we examine the diversification and performance of a small
preliminary sample of Australian self managed superannuation (retirement) funds
(SMSFs). Using the single index model and traditional (risk-adjusted)
performance measures within the context set by modern portfolio theory we find
that the SMSFs in our sample exhibit considerable under-diversification. In
addition, we find that the SMSFs do not appear to be benefiting from even naïve
diversification and, unsurprisingly, perform poorly on a risk-adjusted basis
vis-à-vis the unmanaged S&P/ASX300 index. This empirical investigation contributes
to economists’ understanding of the microeconomic structure of this increasingly
important component of Australia’s retirement income stream.
Key Words: Self Managed Superannuation Funds (SMSF), diversification,
performance.
1
Corresponding Author: Peter J Phillips, Department of Finance and Banking, University of Southern Queensland, Toowoomba, Queensland, 4350. Telephone: 617 46315490. Email: [email protected].
2
THE DIVERSIFICATION AND PERFORMANCE OF SELF
MANAGED SUPERANNUATION FUNDS
Self managed superannuation funds (SMSFs) now represent a significant component
of Australia’s retirement income stream. Indeed, SMSFs represent approximately
one-quarter (to be precise, 23.10 per cent) of all superannuation assets and 97.69 per cent
of all superannuation entities (APRA, September 2006). As this significance
continues to grow, sound government policy concerning the regulation and prudent
management of SMSFs becomes even more important. The regulation of SMSFs and,
indeed, the superannuation fund industry as a whole, is still in its infancy relative to
the prudential supervision of authorised deposit taking institutions and insurance
companies. As such, research into the nature of this new and burgeoning industry is
required to assist with the development of sound policies. It is the purpose of this
paper to contribute to the body of empirical knowledge that guides the policies of
those whose task it is to ensure the prudent management of SMSFs.
Whilst superannuation has generated a reasonable amount of research by economists
and others, self managed superannuation is still very much frontier territory. It has
only just begun to be explored and there remains much to discover, particularly at the
micro level of individual SMSFs. This paper concentrates on contributing to our
empirical knowledge of SMSFs by examining two particular aspects of SMSF
microstructure: diversification and performance. Financial economic theory has long
stressed the importance and benefits of portfolio diversification and much time has
been spent investigating the attainment of appropriate levels of diversification. Using
the single index model developed by Sharpe (1963) and the portfolio performance
measures developed by Sharpe and Treynor, we examine the degree of diversification
exhibited by the SMSFs in our sample and their risk-adjusted performance.
The results of the investigation revealed that, treated as individual portfolios, the
SMSFs analysed herein exhibit a considerable degree of under-diversification and poor risk-adjusted performance relative to the unmanaged benchmark S&P/ASX300
index. The volatility of the returns generated by these SMSFs is attributable to a very
especially particular shares in Australian companies, and only to a very small degree
to the overall share market (or the macroeconomy). These funds, taken as individual
portfolios, are vulnerable to adverse fluctuations in the fortunes of a relatively small
number of companies or industrial sectors. Not surprisingly, the risk-adjusted
performance of the SMSFs is relatively poor and could be improved, in most cases, by
simply allocating funds between the risk free security and the ASX300 index
depending on the degree of risk the individual trustee is willing to bear.
An important limitation of this analysis is the applicability of the results in situations
where the SMSF trustees hold assets outside of their SMSF or when the SMSF cannot
be treated as a separate compartment of the trustees’ wealth. A trustee might have an
under-diversified SMSF but when his or her assets are considered in aggregate there may be no diversification problem. Hence, it is not possible for us to draw
conclusions regarding the optimality of this particular component of Australia’s
retirement income stream. Rather, it is best to treat the results of this investigation as a
description of the microstructure characteristics of SMSFs rather than a study of the
optimality of investors’ retirement funds. Whilst the performance of the SMSFs in our
sample could be improved by more effective asset selection and diversification, it is
not permissible for us to make specific prescriptions in this regard without assuming
that the SMSFs are a separate, stand-alone, component of the trustee’s wealth to
which he or she applies a special set of rules3.
This paper is organised as follows. In the second section, the background to this
analysis is briefly sketched. If SMSFs were not an important component of
Australia’s retirement income stream there would be no need to study them. In
Section II, this importance is established. In Section III, the data are discussed. The
portfolio data gathered for this investigation consist of the actual portfolio structures
of a number of self managed superannuation funds. This would appear to be the first
time that such data have been used in an investigation such as this. In Section IV, the
methodology and the results of the analysis are presented and discussed. The analysis
3
revealed substantial under-diversification of the SMSF portfolios. In Section V, the
policy implications of the results are discussed. Section VI concludes the analysis.
II Background to the Study
Superannuation represents a very significant component of Australia’s retirement
income stream and represents the hopes of successive Australian governments as a
replacement or supplement to the publicly provided pensions that were once relied
upon by the majority of Australia’s retirees as their sole source of retirement income.
The importance of superannuation in Australia has grown significantly since the
introduction of compulsory employer superannuation contributions from 1 July 1992.
As a result of this Federal Government initiative and a greater awareness of the
benefits of superannuation within the wider community, superannuation assets have
grown from $519.4 billion in 1992 to $945.6 billion as at the September quarter 2006,
an increase of 82.05 per cent (APRA, 2006).
A significant part of this increase in superannuation assets has derived from the
growth in the number of self managed superannuation funds and the assets held in
them. A SMSF is a superannuation fund with between two and five members, where
all members are trustees who actively participate in the fund’s management and
investment functions. The fundamental purpose for establishing these funds is
governed by the Superannuation Industry (Supervision) Act 1993 (SISA), which states that the fund’s sole purpose is to provide superannuation benefits to members or
to members’ dependants when they die. SMSFs are also commonly referred to as DIY
funds, ‘mum and dad’ funds or ‘family’ funds.
The concept of the self managed superannuation fund has its origins in the accounting
industry. The accountants who established these funds for clients still control
approximately 80 percent of the self managed superannuation fund market (Barret,
2006). Traditionally, self-employed people and retirees were the main two groups of
individuals who established SMSFs, but in more recent times many employees,
especially high income earners and high net worth individuals have emerged as the
most prominent groups of individuals establishing their own self managed
control, flexibility and choice in the operation of the fund and costs can be minimised
(Leo and Murphy, 2005).
The Quarterly Superannuation Performance report as at the end of the September
quarter 2006 issued by the Australian Prudential Regulation Authority (APRA) shows
that the assets held by SMSFs total $218.4 billion, or 23.10 per cent of all
superannuation assets totalling $945.6 billion. Only retail superannuation funds hold
more superannuation assets with a total of $306.10 billion (APRA, 2006). A further
indication of the importance of SMSFs within the Australian superannuation industry
is emphasised by the size of this sector in terms of the number of funds in relation to
the total superannuation industry. There are 325,730 SMSFs (up from 200,000 in June
2000), which comprise 97.69 per cent of an industry total of 333,429 funds.
Additionally, the SMSFs contain a total of approximately 600,000 members and have
a growth rate of approximately 1,800 new funds per month. SMSFs represent a
significant component of Australia’s retirement savings.
Superannuation in Australia has attracted a reasonable amount of research. This
research has concentrated on the performance of superannuation funds (Drew and
Stanford (2003) and Gallagher (2001)) and the problems of fund selection (Drew,
Stanford and Taranenko (2001), asset allocation and asset selection (Drew and
Stanford (2001). As we have highlighted above, SMSFs are an increasingly important
component of Australia’s superannuation system and despite the research generated
on superannuation in general, SMSFs are still under-researched due to the difficulty
of obtaining micro level data. This study complements these existing, broader
investigations by utilising micro level data from individual SMSFs. The methods used
in this investigation are similar (to the extent that they are derived from modern
portfolio theory) to the methods deployed in the extant literature but we take the
further step of applying these methods to an analysis of the microstructure of SMSFs.
III Self Managed Superannuation Fund Data
The data used in this study were obtained from a large accounting firm in South East
Queensland. This firm administers approximately 130 self managed superannuation
funds. Of these, approximately one third are characterised by the direct management
population of SMSFs are characterised by funds that consist almost solely of
commercial and residential property. We were permitted access to the one third of the
total population of SMSFs administered by this organisation that involve the direct
management of equities by the trustees. Our sample consists of approximately 40
SMSFs where the trustees directly manage the equity securities, cash, real estate and
managed funds contained in their portfolios.
The accounting firm from which the data were sourced does provide financial advice
and employs several individuals qualified to provide financial planning services to
clients. However, upon careful consideration of firm’s operations (including a
personal conversation between the author and the firm’s financial advisor) it is right
to conclude that the SMSF portfolios in this sample are the product of the decisions of
the SMSF trustees and not the financial advisor. It is likely that some general advice
has been sought by the SMSF trustees and, perhaps, some investment advice as well.
Some of this advice may have influenced the choices of particular shares included in
the portfolios and might account for some of the naïve diversification that appears to
have been attempted but this would amount to little more than the advice an
individual normally receives from his or her (full service) stockbroker. Overall, the
portfolios are the product of the trustees’ decisions and the trustees remain responsible
for the management of the portfolios over time.
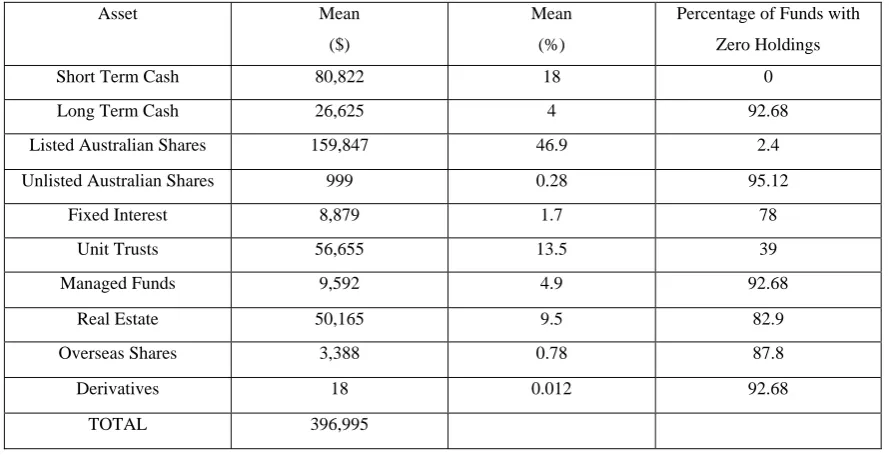
The SMSF portfolio data are extremely detailed. The data include information on the
asset structure of each SMSF at the end of the financial year 2003/2004 (i.e. June 30, 2004). This information contains: (1) asset holdings; (2) purchase prices; (3) purchase
dates; and (4) returns attributable to each investment. A summary of the composition
of the portfolios is presented in Table 1 below. The asset categories are short and long
term cash, listed and unlisted Australian ordinary shares, listed overseas shares,
corporate bonds, unit trusts and managed funds, real estate and derivatives. Short term
cash is cash that is deposited in savings accounts with banks or other deposit taking
institutions. Long term cash is cash invested in term deposit accounts. Real estate is
direct property investment (either commercial or residential). Property trusts are
TABLE 1
The Composition of the Self Managed Superannuation Fund Portfolios
Asset Mean
($)
Mean
(%)
Percentage of Funds with
Zero Holdings
Short Term Cash 80,822 18 0
Long Term Cash 26,625 4 92.68
Listed Australian Shares 159,847 46.9 2.4
Unlisted Australian Shares 999 0.28 95.12
Fixed Interest 8,879 1.7 78
Unit Trusts 56,655 13.5 39
Managed Funds 9,592 4.9 92.68
Real Estate 50,165 9.5 82.9
Overseas Shares 3,388 0.78 87.8
Derivatives 18 0.012 92.68
TOTAL 396,995
Notes: All of the items in the asset column listed above are self-explanatory. However, the ‘derivatives’ category may cause some curiosity. A very small number of funds contained options. These were company options listed on the ASX and not calls and puts traded through ASX Derivatives (ASXD).
The most popular risky investment undertaken by the SMSF trustees is investment in
Australian ordinary shares listed on the Australian Stock Exchange. Almost all of the
SMSFs contained some shares in listed Australian companies. Of note is the large
weighting of cash in the portfolios. On average, the trustees of the SMSFs kept
approximately one-fifth of investable funds in short term cash accounts. All of the
funds contained at least some short term cash. This would tend to indicate, at the very
least, a reasonable amount of disinterest in ‘squeezing’ the maximum return from
each investable dollar. It could also be indicative of a lack of confidence or a higher
level of risk aversion amongst some trustees. Unit trusts and managed funds and real
estate are also reasonably popular asset classes. However, a large number of the
SMSFs in the sample did not contain any of these assets.
The SMSF portfolio data have some advantages that are not usually present in data
gathered from primary data sources. Most importantly, the data are accurate, complete
and correct. The portfolio structures containing all of the information discussed above
were provided to us directly from the administering accounting firm’s databases. As
gather the data. This avoided or diminished the impact of some of the biases and
inaccuracies that may influence other sets of primary data. The only things that we do
not know about the SMSFs concern the trading names of the funds, the names of the
trustees and the demographics of the trustees. This information, of course, was
withheld from us in compliance with privacy legislation.
In order to determine the level of diversification of the SMSFs in our sample, we
supplemented the SMSF portfolio data discussed above with some additional
secondary (market) data gathered from Thomson DataStream as well as some
additional data that were the results of calculations that were undertaken as part of the
investigation and analysis. These data included: (1) market prices of marketable assets
sourced from DataStream; (2) the weights of each security or asset in each portfolio;
(3) the daily returns (including dividends and other cash distributions) for each
security; (4) the betas for each security; (5) the covariances of the returns between
each pair of securities in each portfolio; and (6) the variance of each portfolio. The
portfolio data provided by the accounting firm and supplemented by these additional
data permit the computation or determination of the level of diversification of the
SMSF portfolios.
IV Methodology and Results
The methodology deployed in this investigation is straightforward. The tool that may
be utilised to determine the level of diversification of a portfolio of assets is readily
available from the existing body of mathematical and statistical tools in the field of
financial economics. Quite simply, the level of diversification of a portfolio may be
measured by determining the proportion of the variance of the portfolio’s returns that
is attributable to the variance of the returns of a broad stock market index (which is
usually considered to be a proxy for the macroeconomy) vis-à-vis the proportion that is attributable to the returns of specific assets in the portfolio. Computing these
proportions is a data and time intensive exercise but an exercise that is, nonetheless,
relatively straightforward. The procedure involves computing the parameters for
Sharpe’s (1963) single index model.
According to modern finance theory, investors face two types of risk: (1) systematic
downs of a broad market index, is risk that cannot be diversified away.
Non-systematic or firm-specific risk is risk that derives from particular securities or
business sectors that can be diversified away by combining securities in a portfolio.
Since non-systematic risk can be diversified away, the investor is only rewarded for
bearing systematic risk. To the extent that the investor bears systematic risk rather
than non-systematic risk his or her portfolio is diversified or, conversely, to the extent
that the investor bears non-systematic risk rather than systematic risk his or her
portfolio is under-diversified. One of the most readily applicable contributions to
modern finance theory that provides important insights into portfolio diversification is
Sharpe’s (1963) single index model. This model permits the calculation of the
proportion of total portfolio risk that is attributable to systematic and non-systematic
factors.
Whilst Markowitz mean-variance analysis has been widely used in the financial
services industry for over forty years, there are certain features of the analytical
method that are undesirable from an operational standpoint. It was these features that
prompted the development of index models. The single index model developed by
Sharpe (1963) compares securities to a single benchmark or index and can result in
significant computational economies vis-à-vis the standard portfolio analysis developed earlier by Markowitz (1952). Formally and according to Sharpe (1963), the
excess return on a portfolio is given by4:
P M P P
P R e
R =α +β + (1)
In practice, Equation (1) is utilised as a regression equation where αP and βP are
parameters, is the excess return on a broad market index during a particular time
period and is a random variable with a mean of zero. Since excess returns (returns
in excess of the risk-free rate of return) are not significantly different from zero at
daily time horizons, we deploy total returns measured at daily intervals throughout the
analysis. From Equation (1) it is possible to derive Equation (2) (below), which is an
equation for the variance exhibited by a portfolio.
M
R
P
e
4
According to Sharpe (1963), the total variance of the returns generated by the
portfolio is given by:
) ( 2 2 2 2 P M P
P β σ σ e
σ = + (2)
In this equation, is the portfolio variance, is the square of the Beta for the
portfolio (where Beta is a measure of the sensitivity of the portfolio’s returns to the
returns on a market index
2 P σ 2 P β 5
) and is the variance of the returns on a market index.
The two terms and represent the two components of portfolio variance:
(1) the systematic component; and (2) the non-systematic or firm-specific component.
For a well-diversified portfolio, the first term dominates. That is, is a large
percentage of when the portfolio is well-diversified.
2 M σ 2 2 M Pσ
β 2( )
P e σ 2 2 M Pσ β 2 P σ
In both Equation (1) and Equation (2), ‘M’ denotes a broad market index like the S&P/ASX 300 or All Ordinaries Index. It could also be GNP, a price index or any
other ‘macro’ factor that represents the current state of the macroeconomy (Sharpe,
1963, p.281). One can see immediately that both of these single index equations, one
for the return on the portfolio and one for the risk of the portfolio, relate the portfolio
return and total variance to a single broad market index. In short, the model suggests
that the return and total variance of a portfolio is a function of the return and variance
of a broad market index. The sensitivity of the portfolio’s return and variance to those
exhibited by the market index is measured by the beta of the portfolio.
For the purposes of this analysis, Equation (2) is most important. In Equation (2), the
term denotes that part of the total variance of the returns of the portfolio that is
attributable to systematic factors (the variance in the returns of the broad market index
as a proxy for the state of the macroeconomy) and denotes the variance
attributable to non-systematic factors (the variance in the returns of the portfolio
attributable to the specific idiosyncrasies of the assets in the portfolio or, in general
2 2 M Pσ β ) ( 2 P e σ 5
terms, firm specific factors). Hence, the single index model provides a means of
analysing total portfolio variance in terms of these two components. Indeed, one can
utilise the single index model to determine the percentage of the total portfolio
variance that is attributable to the movements in the market index and the percentage
that is attributable to movements in individual securities (Elton, Gruber, Brown and
Goetzmann, 2003, p.137).
To facilitate the analysis, some adjustments were made to the data. In some portfolios,
the investors held securities that were delisted during the time frame. The delisted
securities were excluded from the analysis. Also, a number of portfolios held property
assets without including a rate of return on the property. In these cases a proxy rate of
return was included, whose fluctuations were based on fluctuations in the cash rate.
This was chosen because the capital growth in different properties fluctuates at
different rates, and in the last ten years there has been little evidence of significant
negative returns in property. Hence, the conservative estimate based on the cash rate
was used. Overall, most portfolios remained complete and unaltered. In cases where a
proxy value could be reasonably used to simulate returns, it was. And in cases where
no reasonable simulation was available to substitute returns, the asset was excluded.
In most cases, the excluded asset/s represented a small fraction of the total portfolio
value, typically less than five percent (not enough to affect the conclusions of the
analysis).
In all cases, it was assumed that all SMSF investors adopted a passive investment
strategy after the last asset in the portfolio was purchased. In most cases, investors
gradually added securities to their portfolios, and the portfolios were analysed from
the date the last security was added until the 24th of April 2006. The dates the last
security was added varied from 1999 to mid 2004. The variations in portfolio dates
does not limit the analysis however, as all portfolios were analysed individually, and
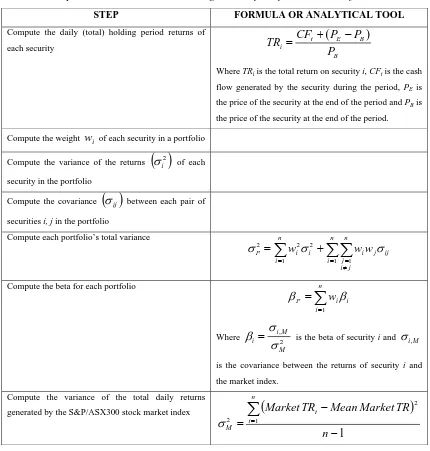
all portfolios were stationary for at least two years. To determine the level of
diversification of the SMSFs in our sample, we compute the parameters of the single
index model (Equation (2)). This involves the following steps, presented in Table 2
TABLE 2
Steps to be Followed in Undertaking the Analysis of the SMSF Portfolios
STEP FORMULA OR ANALYTICAL TOOL
B B E t i P P P CF
TR = +( − )
Where TRi is the total return on security i, CFt is the cash
flow generated by the security during the period, PE is
the price of the security at the end of the period and PBis
the price of the security at the end of the period. Compute the daily (total) holding period returns of
each security
B
Compute the weight wi of each security in a portfolio Compute the variance of the returns
( )
σi2 of eachsecurity in the portfolio
Compute the covariance
( )
σij between each pair ofsecurities i, j in the portfolio
Compute each portfolio’s total variance
∑
∑∑
= = ≠= + = n i n i n j i j ij j i i iP w ww
1 1 1
2 2
2 σ σ
σ
Compute the beta for each portfolio
∑
= = n i i i P w 1 β βWhere ,2
M M i
i σ
σ
β = is the beta of security i and σi,M
is the covariance between the returns of security i and
the market index.
Compute the variance of the total daily returns
generated by the S&P/ASX300 stock market index
(
)
1 1 2 2 − − =
∑
= n TR Market Mean TR Market n t t M σNotes: All of the steps of the analysis outlined in the table were undertaken using Microsoft Excel. As mentioned previously, all data were gathered either (1) primarily from the South East Queensland accounting firm that cooperated with this research project or (2) from Thomson DataStream.
Once all the steps in Table 2 (above) had been carried out for all of the portfolios in
our sample, the results could be input into the single index model Equation (2) to
facilitate the analysis of the level of diversification exhibited by each of the self
managed superannuation funds in our sample. The results obtained from steps one
through seven (above) can be input in Equation (2) to facilitate the analysis. The
proportion of each portfolio’s variance of returns that is attributable to systematic or
) (
2 P
e
σ , the proportion of each portfolio’s variance of total returns that is attributable
to non-systematic or firm specific factors can be similarly computed. The results of
[image:13.595.58.543.191.578.2]these calculations are presented below.
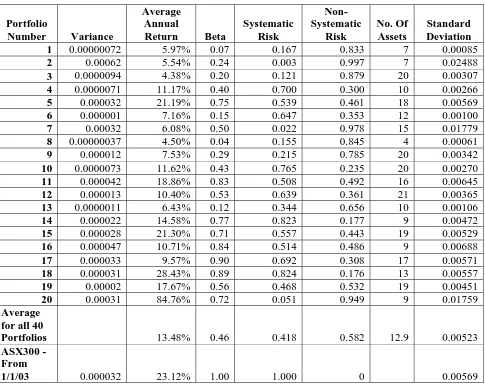
TABLE 3
The Results of the Analysis of Diversification: Portfolios 1 to 20
Portfolio
Number Variance
Average Annual
Return Beta
Systematic Risk
Non-Systematic
Risk
No. Of Assets
Standard Deviation
1 0.00000072 5.97% 0.07 0.167 0.833 7 0.00085
2 0.00062 5.54% 0.24 0.003 0.997 7 0.02488
3 0.0000094 4.38% 0.20 0.121 0.879 20 0.00307
4 0.0000071 11.17% 0.40 0.700 0.300 10 0.00266
5 0.000032 21.19% 0.75 0.539 0.461 18 0.00569
6 0.000001 7.16% 0.15 0.647 0.353 12 0.00100
7 0.00032 6.08% 0.50 0.022 0.978 15 0.01779
8 0.00000037 4.50% 0.04 0.155 0.845 4 0.00061
9 0.000012 7.53% 0.29 0.215 0.785 20 0.00342
10 0.0000073 11.62% 0.43 0.765 0.235 20 0.00270
11 0.000042 18.86% 0.83 0.508 0.492 16 0.00645
12 0.000013 10.40% 0.53 0.639 0.361 21 0.00365
13 0.0000011 6.43% 0.12 0.344 0.656 10 0.00106
14 0.000022 14.58% 0.77 0.823 0.177 9 0.00472
15 0.000028 21.30% 0.71 0.557 0.443 19 0.00529
16 0.000047 10.71% 0.84 0.514 0.486 9 0.00688
17 0.000033 9.57% 0.90 0.692 0.308 17 0.00571
18 0.000031 28.43% 0.89 0.824 0.176 13 0.00557
19 0.00002 17.67% 0.56 0.468 0.532 19 0.00451
20 0.00031 84.76% 0.72 0.051 0.949 9 0.01759
Average for all 40
Portfolios 13.48% 0.46 0.418 0.582 12.9 0.00523
ASX300 - From
1/1/03 0.000032 23.12% 1.00 1.000 0 0.00569
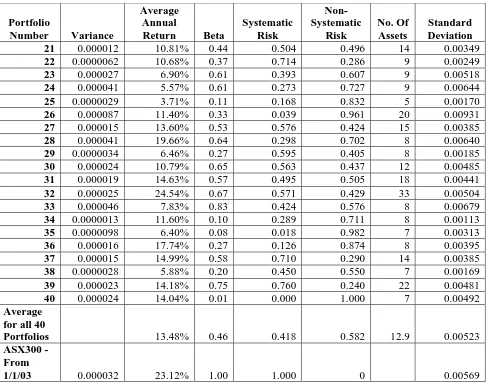
TABLE 4
The Results of the Analysis of Diversification: Portfolios 21 to 40
Portfolio
Number Variance
Average Annual
Return Beta
Systematic Risk
Non-Systematic
Risk
No. Of Assets
Standard Deviation
21 0.000012 10.81% 0.44 0.504 0.496 14 0.00349
22 0.0000062 10.68% 0.37 0.714 0.286 9 0.00249
23 0.000027 6.90% 0.61 0.393 0.607 9 0.00518
24 0.000041 5.57% 0.61 0.273 0.727 9 0.00644
25 0.0000029 3.71% 0.11 0.168 0.832 5 0.00170
26 0.000087 11.40% 0.33 0.039 0.961 20 0.00931
27 0.000015 13.60% 0.53 0.576 0.424 15 0.00385
28 0.000041 19.66% 0.64 0.298 0.702 8 0.00640
29 0.0000034 6.46% 0.27 0.595 0.405 8 0.00185
30 0.000024 10.79% 0.65 0.563 0.437 12 0.00485
31 0.000019 14.63% 0.57 0.495 0.505 18 0.00441
32 0.000025 24.54% 0.67 0.571 0.429 33 0.00504
33 0.000046 7.83% 0.83 0.424 0.576 8 0.00679
34 0.0000013 11.60% 0.10 0.289 0.711 8 0.00113
35 0.0000098 6.40% 0.08 0.018 0.982 7 0.00313
36 0.000016 17.74% 0.27 0.126 0.874 8 0.00395
37 0.000015 14.99% 0.58 0.710 0.290 14 0.00385
38 0.0000028 5.88% 0.20 0.450 0.550 7 0.00169
39 0.000023 14.18% 0.75 0.760 0.240 22 0.00481
40 0.000024 14.04% 0.01 0.000 1.000 7 0.00492
Average for all 40
Portfolios 13.48% 0.46 0.418 0.582 12.9 0.00523
ASX300 - From
1/1/03 0.000032 23.12% 1.00 1.000 0 0.00569
Notes: All of the calculations have been derived from daily data. Unless otherwise stated, all values presented in the Table refer to daily return horizons. Most importantly, the variances and standard deviations reported in the Table above are daily variances and standard deviations. This accounts for the low values presented in the Table.
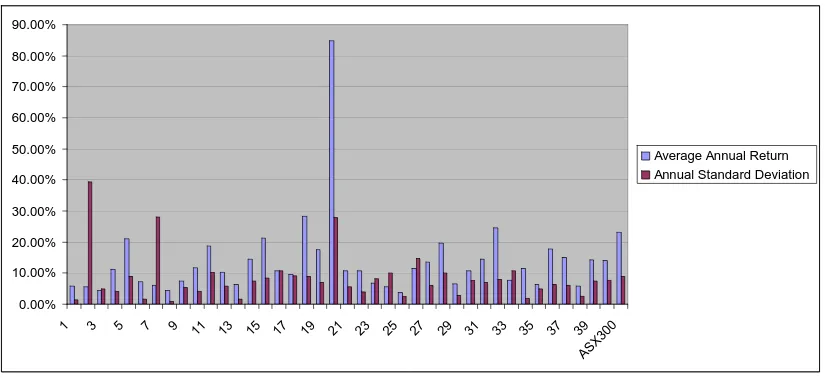
The SMSF returns and standard deviation data displayed in Tables 3 and 4 are
summarised in the chart presented below. This permits a visual inspection of the
return and risk characteristics of the SMSFs and permits the comparison of the returns
(unadjusted for risk) with the S&P/ASX300 index for the same period. The daily
standard deviations have been adjusted to annual standard deviations to facilitate the
FIGURE 1
The Average Annual Returns and Standard Deviation of the SMSF Portfolios
0.00% 10.00% 20.00% 30.00% 40.00% 50.00% 60.00% 70.00% 80.00% 90.00%
1 3 5 7 9 11 13 15 17 19 21 23 25 27 29 31 33 35 37 39
ASX3 00
Average Annual Return Annual Standard Deviation
It can be said that, as a whole, the SMSF portfolios (examined as individual portfolios
without reference to trustees’ ‘outside’ assets) are not well diversified. Even though
most SMSFs contain over ten assets, firm specific (non-systematic) risk still
represents nearly 60 percent of all risk in the portfolios. In 11 of the 40 portfolios the
non-systematic risk accounted for 80 percent of all risk and in only two portfolios did
it account for less than 20 percent of all risk. Evidence indicates that investors need
between 30 and 40 assets in their portfolios to benefit significantly from
diversification (Evans and Archer (1968) and Campbell et al. (2001)). Only one portfolio had over 30 securities and non-systematic risk still accounted for 42.9
percent of its risk. A fully diversified portfolio would contain no non-systematic risk.
Theoretically, investors are not rewarded for bearing non-systematic risk and, as such,
it is desirable to diversify non-systematic risk away.
Our results, by and large, also highlight the risk-return trade-off. Whilst significant
returns were earned by some portfolios (especially portfolio 20), these returns were
generated by investing in very few assets (portfolio 20 contains just 9 securities) and
bearing a large amount of risk (variance). Portfolio 20 exhibits very high returns but
also exhibits an annual standard deviation that is approximately three times larger
than that exhibited by the unmanaged S&P/ASX300 index. This portfolio is, as are
many of the portfolios in our sample, very vulnerable to fluctuations in the fortunes of
the economic system may result in significant adverse results for such a thinly
diversified portfolio. Diversification insulates the portfolio from these vulnerabilities
and usually provides a simple way of improving expected returns whilst reducing the
variance of the portfolio.
In short, theoretical financial economics tells us that investors are not rewarded for
bearing non-systematic risk. Also, effective diversification can enhance (expected)
returns and reduce the risk of a portfolio of assets. The SMSFs in our sample all bear
some degree of non-systematic risk. In most cases the percentage of total portfolio
risk that is attributable to non-systematic factors reaches high levels. Theoretically, it
would be best for such portfolios (treating them as individual portfolios) to exhibit no
non-systematic risk. This would be achieved by investing in a broader range of
securities (approximately 30). However, even the addition of a handful of carefully
selected securities could potentially increase the expected returns of the portfolios and
diminish the variance they exhibit. Some of the SMSF trustees appear to have
attempted this careful selection by selecting shares from different industry
classifications.
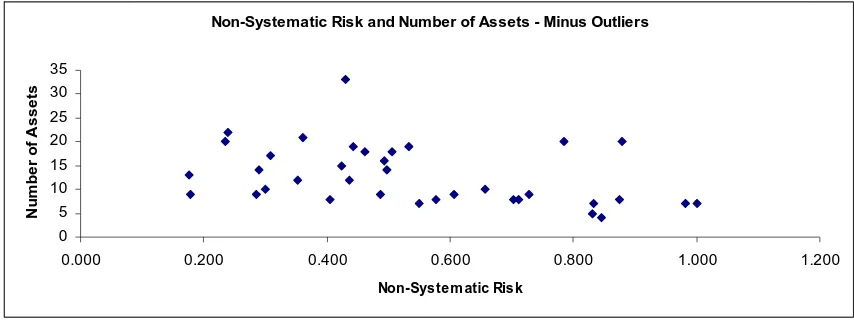
Interestingly, the attempted diversification that is exhibited by the portfolios appears
to have been far from effective. Even the portfolios with a larger number of assets do
not appear to be benefiting from even naïve diversification (the reduction in risk that
occurs simply by randomly adding more assets to the portfolio). This feature of the
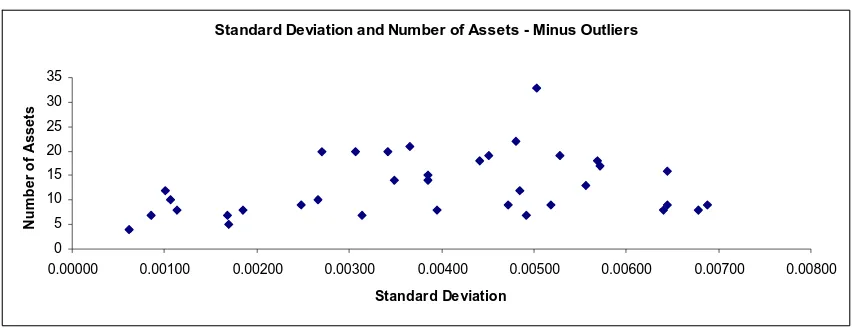
[image:16.595.91.518.607.770.2]SMSF portfolios is highlighted by the charts below:
FIGURE 2
Non-Systematic Risk and the Number of Assets in the Portfolio
Non-Systematic Risk and Number of Assets - Minus Outliers
0 5 10 15 20 25 30 35
0.000 0.200 0.400 0.600 0.800 1.000 1.200 Non-System atic Risk
Nu
mb
er o
f As
set
FIGURE 3
Portfolio Standard Deviation and Number of Assets in the Portfolio
Standard Deviation and Number of Assets - Minus Outliers
0 5 10 15 20 25 30 35
0.00000 0.00100 0.00200 0.00300 0.00400 0.00500 0.00600 0.00700 0.00800
Standard Deviation
N
u
m
b
er
o
f
A
sset
s
The absence of a negative relationship between non-systematic risk, portfolio
standard deviation and the number of assets held in the portfolios indicates that the
portfolios fail, as mentioned above, to benefit from even naïve diversification.
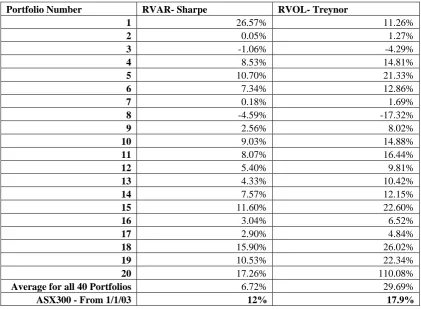
Not surprisingly, the performance of the portfolios is quite poor on a risk adjusted
basis, compared to the performance of the unmanaged S&P/ASX300 index. In this
research, two measures of risk adjusted return were used. These are the Sharpe
(RVAR) measure and the Treynor (RVOL) measure. Whilst neither of these measures
is perfect, each has maintained an almost permanent presence in portfolio
management practice for the past forty years. Since the Sharpe measure relates return
to total risk it is most appropriately used in situations where non-systematic risk has
been diversified away. Since our SMSFs exhibit a large amount of non-systematic
risk, the Sharpe measure will tend to rank these under-diversified portfolios lower
than the Treynor measure. Theoretically, as mentioned above, investors should only
be rewarded for bearing systematic risk. Therefore, the Treynor measure is likely to
be the most appropriate evaluation tool for our portfolios. The Sharpe measure of risk
adjusted return is calculated as follows:
p f
p r
r r
σ
−
= (3)
p f
p r
r r
β
−
= (4)
Where rp is the average return of the portfolio and rf is the average return of a risk
free asset. The risk adjusted return of the S&P/ASX300 index is calculated using the
same equations. It is necessary to perform these calculations due to the presence of
the risk/return trade-off. Certain portfolios may earn higher returns than others, but
are subject to a greater degree of risk, and therefore cannot be compared. The results
of the calculations are presented in Tables 5 and 6 below. A higher RVAR or RVOL
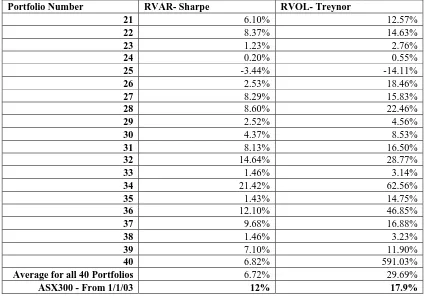
[image:18.595.87.509.362.671.2]ratio indicates superior risk-adjusted performance:
TABLE 5
The Risk Adjusted Performance of the SMSFs: Portfolios 1 to 20
Portfolio Number RVAR- Sharpe RVOL- Treynor
1 26.57% 11.26%
2 0.05% 1.27%
3 -1.06% -4.29%
4 8.53% 14.81%
5 10.70% 21.33%
6 7.34% 12.86%
7 0.18% 1.69%
8 -4.59% -17.32%
9 2.56% 8.02%
10 9.03% 14.88%
11 8.07% 16.44%
12 5.40% 9.81%
13 4.33% 10.42%
14 7.57% 12.15%
15 11.60% 22.60%
16 3.04% 6.52%
17 2.90% 4.84%
18 15.90% 26.02%
19 10.53% 22.34%
20 17.26% 110.08%
Average for all 40 Portfolios 6.72% 29.69%
TABLE 6
The Risk Adjusted Performance of the SMSFs: Portfolios 21 to 40
Portfolio Number RVAR- Sharpe RVOL- Treynor
21 6.10% 12.57%
22 8.37% 14.63%
23 1.23% 2.76%
24 0.20% 0.55%
25 -3.44% -14.11%
26 2.53% 18.46%
27 8.29% 15.83%
28 8.60% 22.46%
29 2.52% 4.56%
30 4.37% 8.53%
31 8.13% 16.50%
32 14.64% 28.77%
33 1.46% 3.14%
34 21.42% 62.56%
35 1.43% 14.75%
36 12.10% 46.85%
37 9.68% 16.88%
38 1.46% 3.23%
39 7.10% 11.90%
40 6.82% 591.03%
Average for all 40 Portfolios 6.72% 29.69%
ASX300 - From 1/1/03 12% 17.9%
Our calculations show that only 13 of the SMSFs (a little less than 1/3) performed
better than the unmanaged S&P/ASX300 market index on a risk-adjusted basis. The
other 27 (over two-thirds) SMSFs in our sample under-performed the unmanaged
S&P/ASX300 index on a risk-adjusted return basis. It would be possible to improve
the performance of the average SMSF in our sample by simply allocating the
investment capital to combinations (determined by the desired level of risk) of the
ASX300 and the risk-free asset. As individual portfolios (treated separately from
trustees’ outside assets) the SMSFs in our sample exhibited under-diversification and
poor risk-adjusted performance relative to the ASX300. These microstructure
characteristics of SMSFs contribute to our understanding of the nature of SMSFs as a
component of Australia’s retirement income stream.
V Policy Implications
At the time of writing, the Australian Taxation Office is responsible for the
supervision of SMSFs in Australia. The Australian Taxation Office has prepared a
number of documents to assist trustees, tax advisors, financial planners and auditors to
documents is not the prudent management of the portfolios. Rather, the focus appears
to be the compliance of the SMSF with the relevant regulations with particular
reference to the SIS (Superannuation Industry Supervision) Act 1993. Whilst compliance with this legislation is certainly of critical importance, the prudent
management of the SMSF portfolio itself does not figure prominently in the ATO
literature. It would seem entirely possible to manage a SMSF portfolio very poorly yet
still maintain compliance with the SIS Act, as long as the fund’s financial position remains sound and there are no breaches of requirements such as the sole purpose
rule6.
The potential problems revealed in our sample might be a consequence of the fact that
the actual management of the portfolios (leaving aside the issue of compliance)
figures less prominently than perhaps it should in the relevant documents and
legislation governing the behaviour of SMSFs. For example, in the Australian
Taxation Office’s ‘It’s Your Money…But Not Yet!’ document, prudent portfolio
management is accorded much less attention than the compliance issues mentioned
above. Responsible investment, including having a strategy and diversifying the
fund’s assets, receives only brief attention and there would appear to be little practical
information available in these documents that would provide investor education with
regards to these issues.
The nature of specific educational information will depend on the percentage of
trustees’ total wealth that is represented by the SMSF. If the SMSF represents a
significant proportion of the trustees’ wealth, the under-diversification of the SMSF is
a particularly important portfolio management problem. If a decision has been made
to invest in risky securities, the SMSF can achieve a higher expected return and lower
risk through diversification. Through the selection of approximately 30 securities, the
percentage of total portfolio variance attributable to firm specific factors is made
negligible. If, on the other hand, the SMSF trustees hold assets outside of their SMSF,
the diversification of the SMSF itself may be of less concern if the trustees’ overall
portfolios are diversified. Trustees who hold cash balances and property outside of the
SMSF will experience less volatility in their overall wealth portfolio than their
6
individual (under-diversified) SMSF. It is possible for a trustee to have a volatile,
under-diversified SMSF and yet maintain a diversified total wealth portfolio of which
the SMSF is a part.
Whilst portfolio management is important, the Australian Taxation Office’s
investment strategy fact sheet for SMSF trustees is heavily focussed on compliance
issues. Trustees are instructed that the fund must have particular regard to the SIS Act, Section 52 (2) (f) by: “(1) investing in such a way as to maximise member returns
taking into account the risk associated in holding the investment; (2) appropriate
diversification and the benefits of investing across a number of asset classes (for
example, shares, property, fixed deposit) in a long term investment strategy; and (3)
the ability of the superannuation fund to pay benefits as well as other costs of the
superannuation fund as they become due and payable” (ATO, 2006). However, the
remainder of the document deals with compliance issues and we could not find any
more detailed investor education information that would provide guidance to SMSF
trustees on the practical attainment of these objectives.
In light of our analysis and our review of the information that is available to trustees,
auditors, financial planners and tax agents from the regulatory body charged with the
supervision of SMSFs, we have developed several simple and straightforward policy
recommendations. First and foremost, it would seem highly desirable to devote more
supervisory or regulatory attention to the practical management of the SMSF
portfolios. Whilst it would not be feasible to undertake in-depth portfolio analysis of
every fund, it is relatively easy to determine whether or not a SMSF is dangerously
under-diversified and therefore vulnerable to specific industries and sectors. Financial
economic theory informs us that 20 to 30 shares are necessary to approach full
diversification (Evans and Archer, 1968)7. Most of the SMSFs that we investigated
had 12 or less shares in their portfolios. Second and of equal importance, the potential
problems that we have detected could be rectified by the provision of investment
education material or by even more actively encouraging SMSF trustees to seek
financial advice specifically regarding the management of their portfolios, not just on
compliance issues.
7
VI Conclusion
Self managed superannuation funds are a significant component of Australia’s
retirement income stream. With the growth of the SMSF industry showing no signs of
abatement their regulation becomes an ever more important issue. Prudent regulation
requires information and we have set out to uncover some of the micro-level
characteristics of SMSFs. Our results revealed (or perhaps confirmed existing
suspicions) that the SMSFs in our sample were considerably under-diversified and
contained a very small number of securities. Second, we discovered that most of the
SMSFs in our sample performed poorly relative to the S&P/ASX300. Whilst we
cannot draw conclusions concerning the optimality of the SMSFs, it is possible that
under-diversification and poor relative performance are indicative of portfolio
management issues that should be addressed. We suggest a more active programme of
investor education as well as an auditing process that takes account of such important
REFERENCES
Australian Prudential Regulation Authority, September 2006, Quarterly Superannuation Performance, APRA, Canberra, pp. 5-7.
Barrett, J. 2006, ‘Big players slice SMSF pie’, The Australian Financial Review, 26th April.
Bodie, Z., Kane, A. and Marcus, A. 2005, Investments, McGraw Hill, New York, New York.
Campbell, J.Y., Lettau, M., Malkiel, B. and Xu, T. 2001, “Have Individual Stocks Become More Volatile? An Empirical Exploration of Idiosyncratic Risk,”
Journal of Finance, pp.1–43.
Drew, M.E. and Stanford, J.D. 2001, “Asset Selection and Superannuation Fund Performance: A Note for Trustees,” Economic Papers, Vol. 20, No. 1, pp.57-65.
———2003, “Returns from Investing in Australian Equity Superannuation Funds, 1991-1999,” The Services Industries Journal, Vol. 23, No.4, pp.12-24.
Drew, M.E., Stanford, J.D. and Taranenko, P. 2001, “Hot Hands and Superannuation Fund Performance: A Second Note for Trustees,” Economic Papers, Vol. 20, No. 4, pp.18-25.
Elton, E., Gruber, M.J., Brown, S.J. and Goetzmann, W.N. 2003, Modern Portfolio Theory and Investment Analysis, 6th Edition, John Wiley and Sons, New York, New York.
Evans, J. and Archer, S. 1968, “Diversification and the Reduction of Dispersion: An Empirical Analysis,” Journal of Finance, December, pp.761–767.
Gallagher, D. 2001, “Attribution of Investment Performance: An Analysis of Australian Pooled Superannuation Funds,” Accounting and Finance, Vol. 41, pp.41-62.
Kaheman, D. and Tversky, D. 1982, “The Psychology of Preferences,” Scientific American, January, pp.136-142.
Key Statistics, Quarterly Superannuation Performance, APRA, March 2006.
Leo, L. & Murphy, S. 2005, Australian Master Superannuation Guide, 9th edn, CCH Australia Limited, Sydney.
Markowitz, H. 1952, “Portfolio Selection,” Journal of Finance, March, pp.77–91.